Want to make sure that your data gets used to inform decisions?
Get your stakeholders involved in the sense-making process!
Are you familiar with data placemats?
Here’s how they work:
- Design Data Placemats
- Facilitate an Interpretation Meeting
- Include those Insights in the Final Report or Slideshow
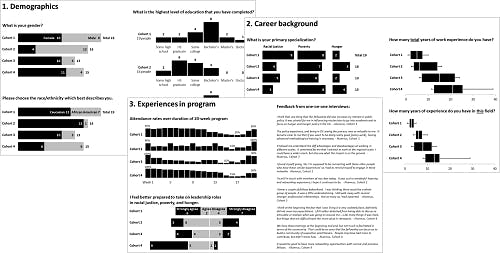
Step 1: Design Data Placemats
First, we analyze the data and display key findings in data placemats. You might display survey responses, for example.
These placemats should include traditional graphs. That means the graph titles contain the topic area, not the takeaway finding, and there’s no color contrast. Imagine a bar chart where every bar is the same color, so that nothing stands out. It’s up to the viewer to figure out the “so what?” for themselves.
We can make data placemats in any software program. You know I’m a champion for everyday software. PowerPoint’s my top choice for data placemats because it’s easy to arrange multiple graphs on the slide.
Your placemats might look like this, with one page per survey topic.
Step 2: Facilitate an Interpretation Meeting
Next, we gather people together, either virtually or in-person.
During the meeting, we’re facilitators, not lecturers.
It’s a conversation, not a presentation.
We ask questions like:
- “What surprises you about the data?”
- “What factors might explain the patterns we’re seeing?”
- “What additional questions do you have?”
The goal is to get attendees to verbalize the takeaway findings in their own words. We listen, listen, listen.
Step 3: Include those Insights in the Final Report or Slideshow
Finally, we go back to our offices and create a final deliverable for the project, like a report or slideshow (if needed).
The final version should include storytelling graphs, which means the graphs have the takeaway findings in the graph titles, and include color contrast. Imagine a bar chart where everything’s grayed-out except for the one important bar in a darker color.
The interpretation meeting becomes a data collection event; we quote the meeting attendees and include that qualitative data in the final report.
This process not only gets stakeholders involved in the process–making it more likely that they’ll use the findings–but makes the final report or slideshow even richer.
Learn More
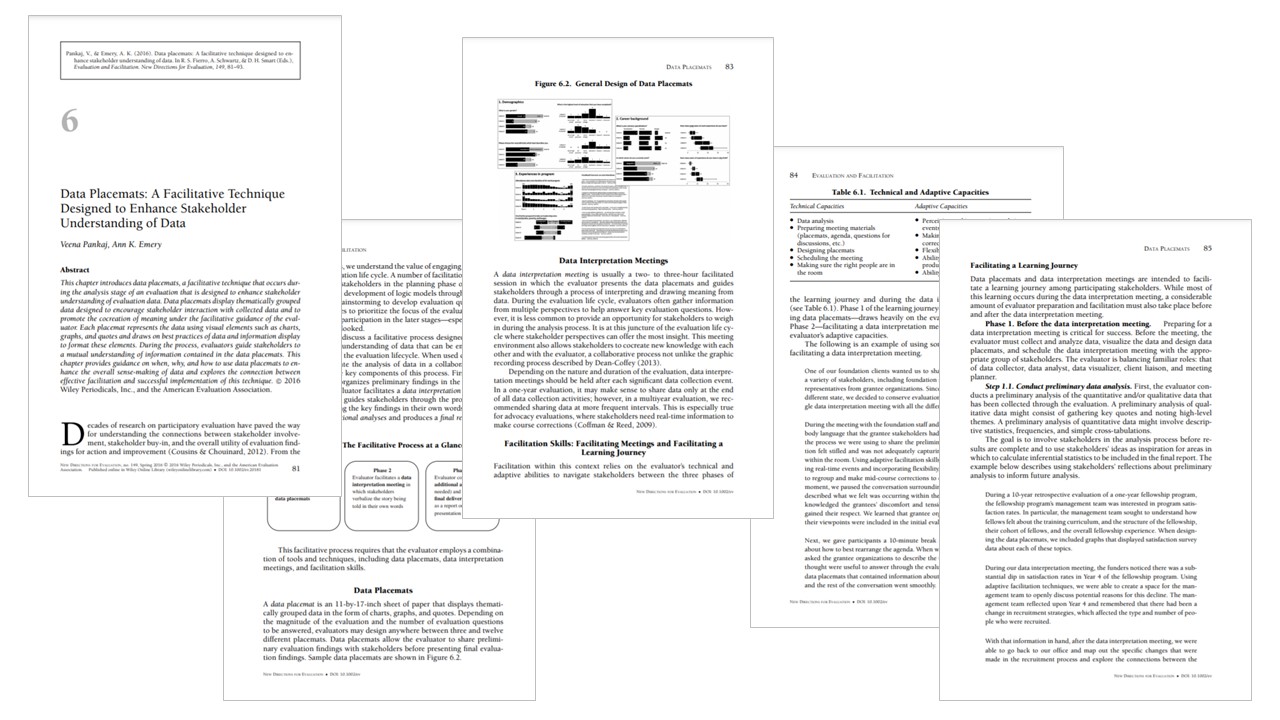
I learned this technique years ago from Veena Pankaj. Veena and I published an article about placemats together that you read can here: https://onlinelibrary.wiley.com/doi/pdf/10.1002/ev.20181
Your Turn
Have you used data placemats in your project? Comment and share tips of your own!