Dashboards aren’t scary!
In this video, let’s make a starter dashboard in Microsoft Excel.
You’ll learn how to make four quick visuals:
- Sparklines
- Data bars
- Symbol fonts
- Color scales
I use these visuals over and over in my real-life consulting projects.
Watch the Tutorial
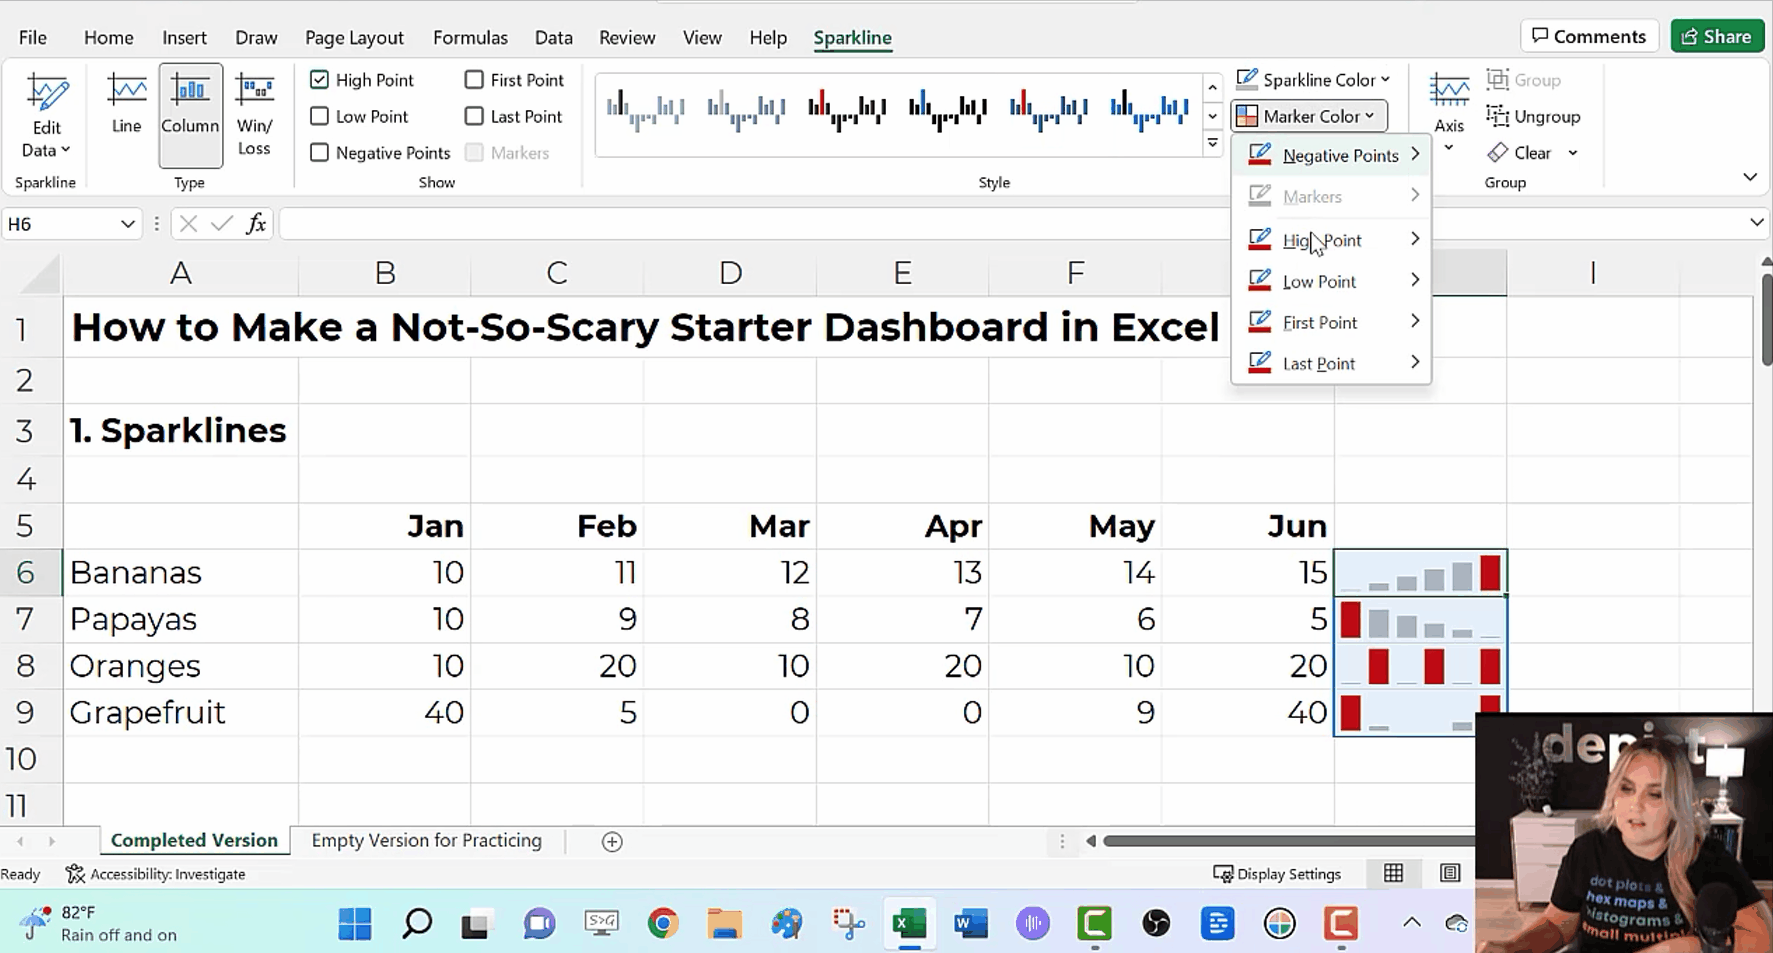
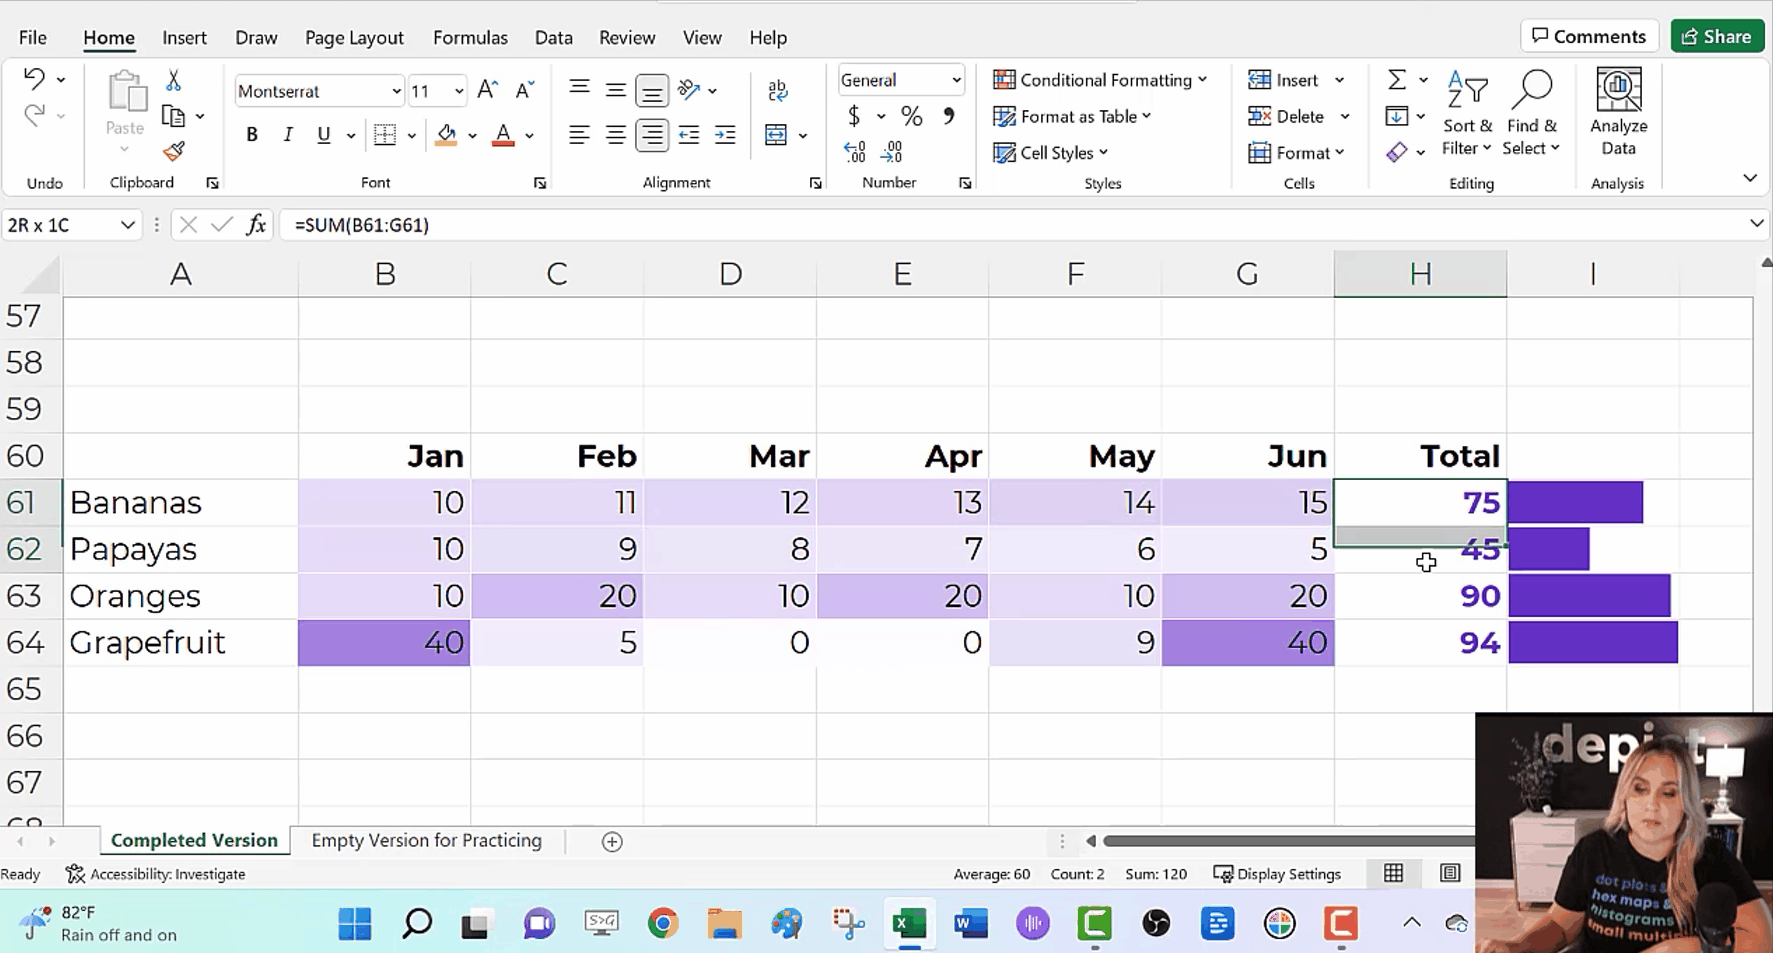
Sparklines
Sparklines are helpful for visualizing patterns over time, like daily, weekly, monthly, quarterly, or annual data.
To create sparklines:
- Highlight the first row of your table.
- Go to the Insert tab.
- Go to the Sparklines section.
- Click on the first one (a Line sparkline).
- Choose where we want to put the sparklines (off to the right of the table).
- Click insert and enjoy the sparklines!
We can also edit our sparklines!
We might adjust the data source, type (from line to column), or color. I typically gray everything out and highlight a high point or low point in a dark brand color.
We can also group and ungroup our sparklines (e.g., if we want each category in our dashboard to have its own color).
And if we change our mind, we can clear them out.
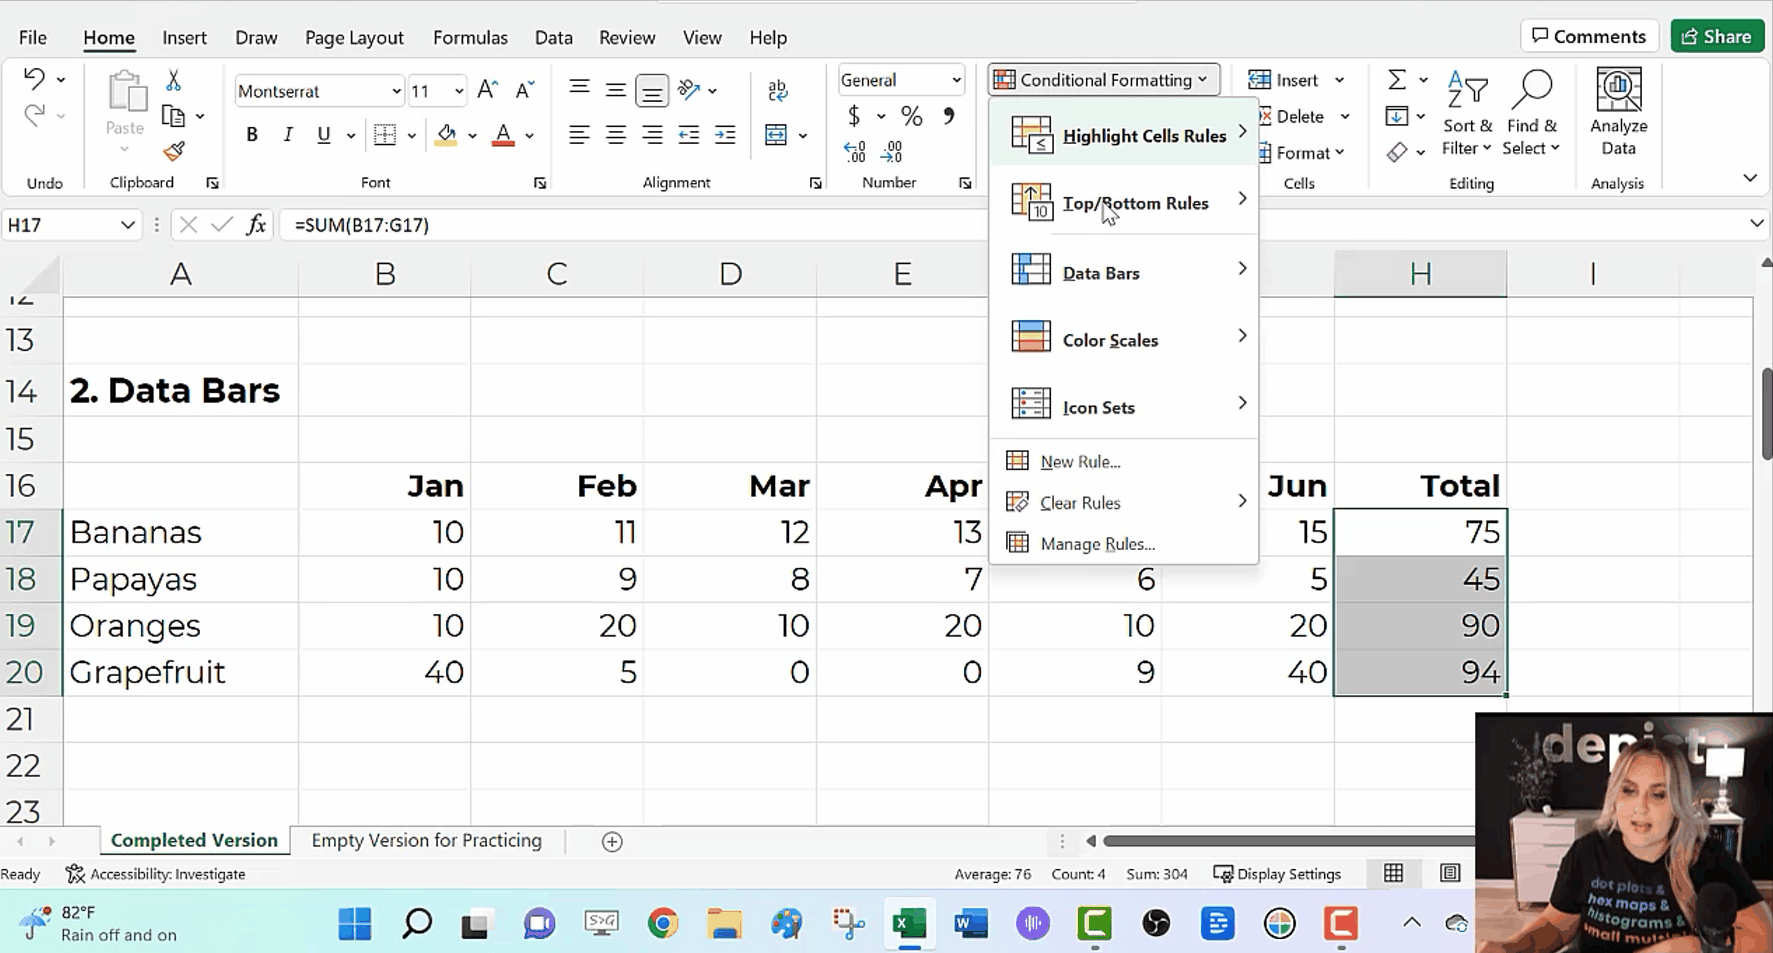
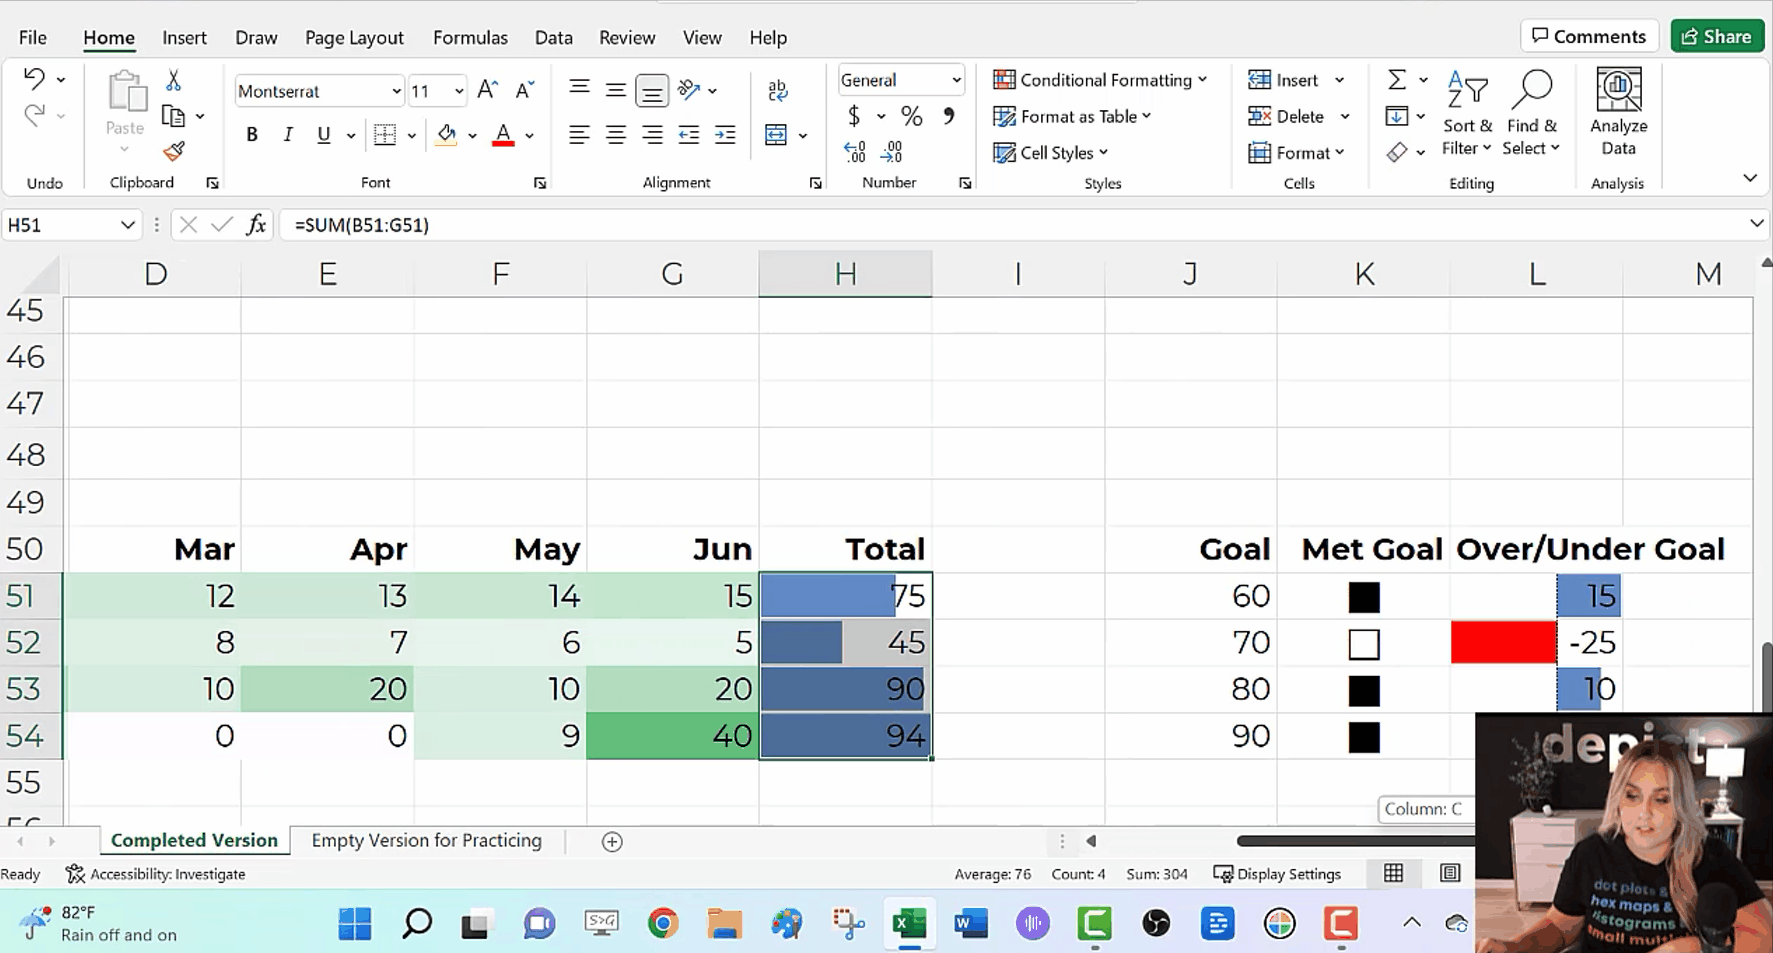
Data Bars
Data Bars give us horizontal bars (as opposed to sparklines’ vertical columns).
They’re helpful for visualizing summary statistics like totals or averages.
To create data bars:
- Highlight the cells you want to visualize (e.g., the total column).
- Go to the Home tab.
- Click on the Conditional Formatting button.
- Select solid-filled data bars.
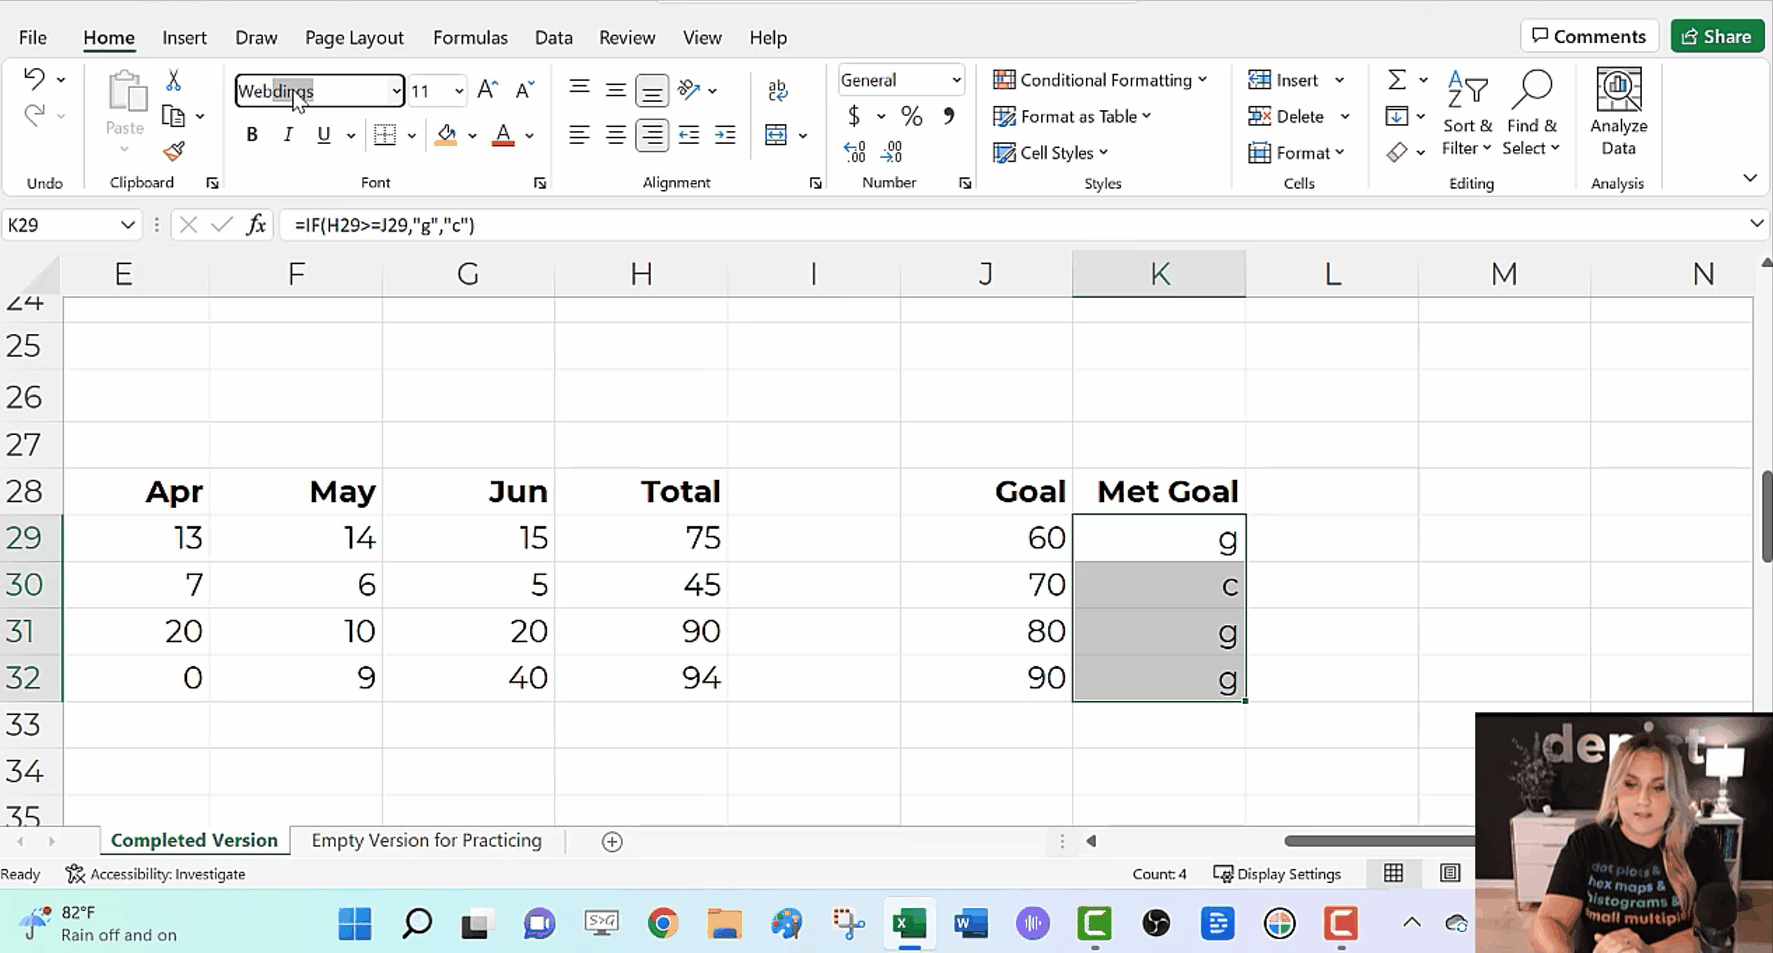
Symbol Fonts
I use checkboxes to visualize whether I met a goal or target.
We can get quick checkboxes through symbol fonts!
In the video, you’ll see me write an =if() statement to transform g’s and c’s into Webdings checkboxes.
Audiences love the checkboxes. They’re intuitive, colorblind-friendly, and grayscale printing-friendly.
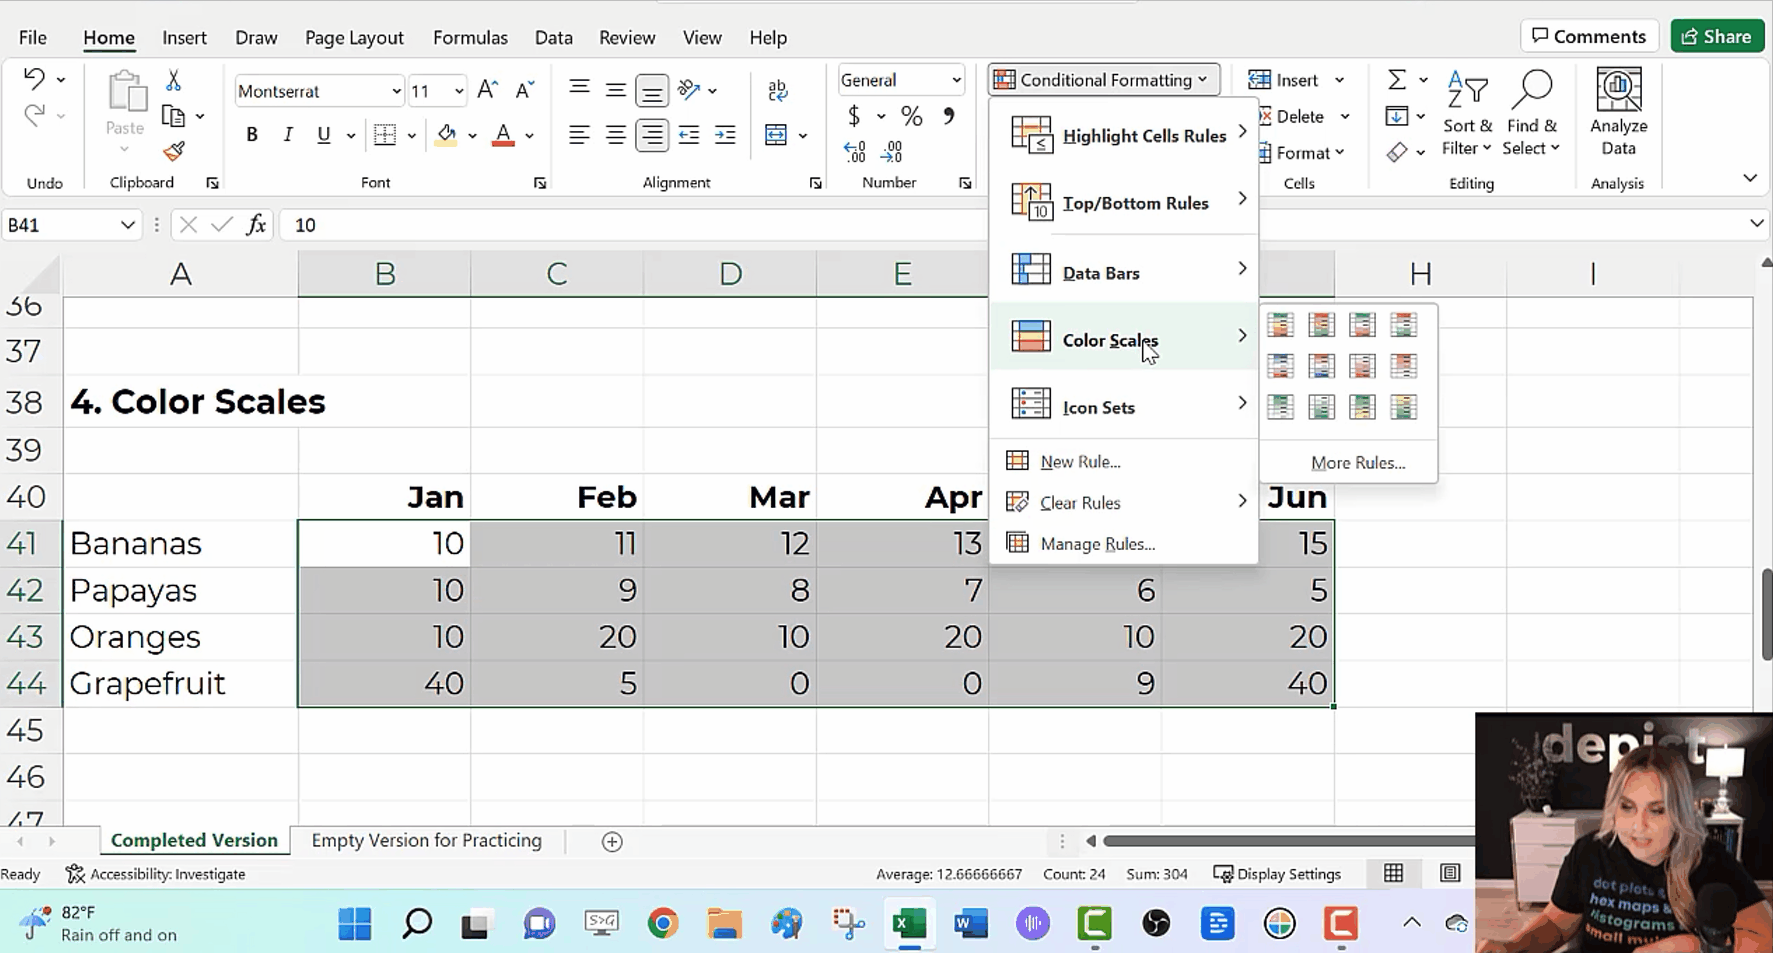
Color Scales
a.k.a. heat maps or heat tables.
I love color scales for visualizing the interior of my table—when I want to compare lots of rows and columns to each other.
To create color scales:
- Highlight the cells you want to visualize (i.e., the interior of the table).
- Go to the Home tab.
- Click on the Conditional Formatting button.
- Select Color Scales. Most of the time, we’ll use a Green-White Color Scale. That’ll make the big numbers dark (and the small numbers will be light).
Combos
In real life, we might combine several of these techniques.
We might add color scales to the interior of the table…
We might compare the totals with data bars…
We might add Webdings checkboxes to see whether we met a goal…
And we might add more data bars to see how far we were over or under our goal.
Formatting
In real life, we’d edit these quick visuals.
I suggest:
- Using brand colors and brand fonts.
- Outlining the color scales in white (so the cells can be differentiated against each other).
- Placing the data bars in a separate column than their numeric labels.
- Coloring the checkboxes (rather than boring black).
- Adjusting the colors in the over/under bars (to avoid scary red).
- Moving the labels to the over/under bars to their own column (via an =if() statement to save time).
Download this Spreadsheet
Try it yourself!
Explore the completed version with the =if() statements.
Use the empty version to practice alongside me as you replay the video.
Get in Touch
If you get stuck, reach out on LinkedIn.