This is the first in a series of posts on chart design in Adobe XD. In each post we will take on a different chart type. Today we start with one of the most ubiquitous and useful charts, the Bar Chart.
What you’ll find in this post:
- An Oversimplified How To
- How to create a good looking bar chart.
- 6 other things related to creating bar charts with Adobe XD.
An Oversimplified How To
Creating a bar chart (or column chart) in Adobe XD is just a little shape creating.
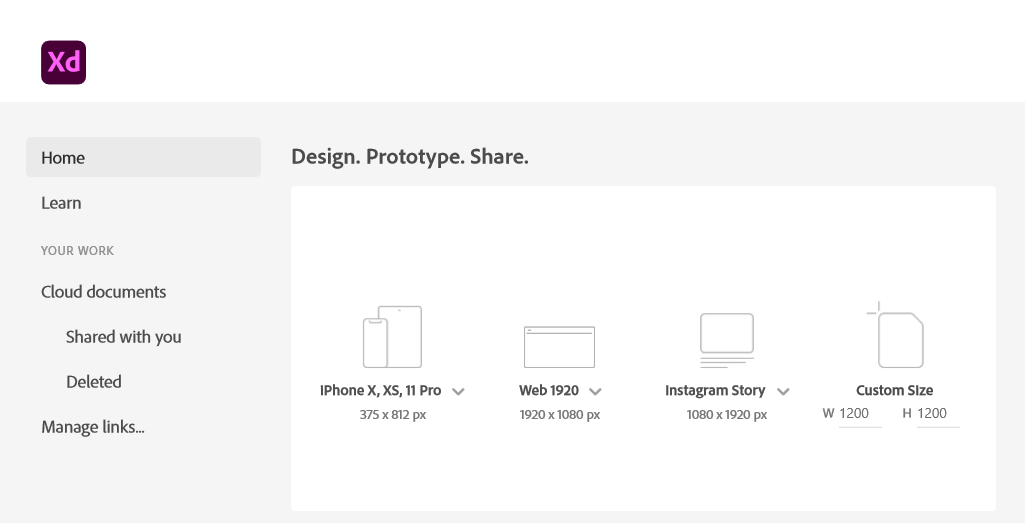
Step 1. Start by creating an artboard in Adobe XD. It doesn’t matter which you choose, you can create multiple artboards of different sizes within each Adobe XD file.
You should also have some data… I’ll just use some random numbers: 10,11,13,15,18.
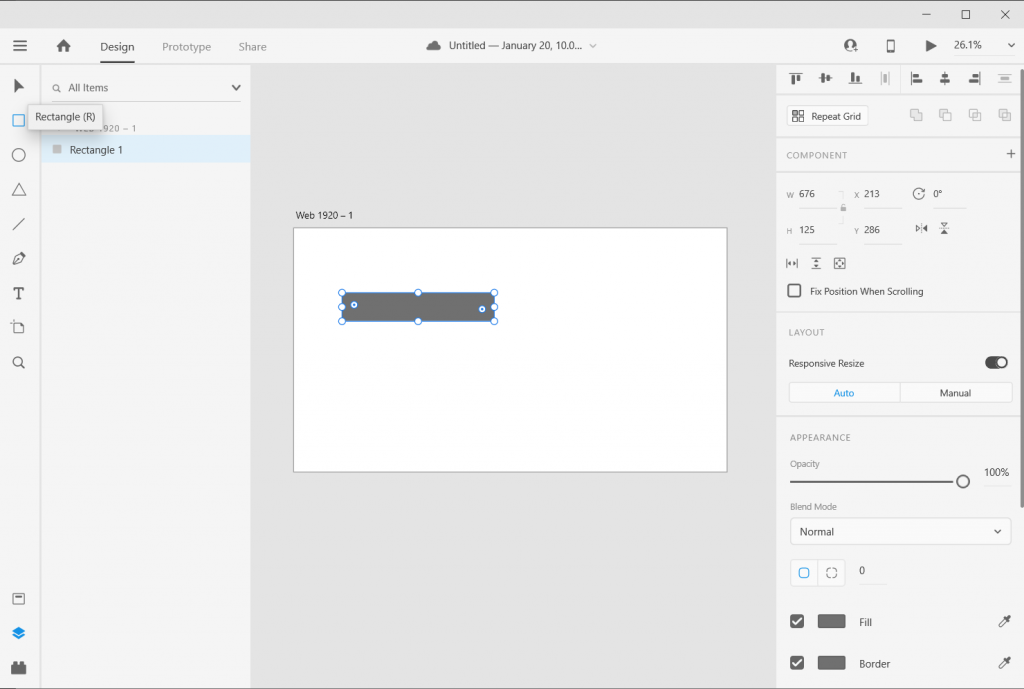
Step 2. Draw a rectangle by clicking on the little square icon and drawing it on the artboard (you can also change the fill color if you’d like).
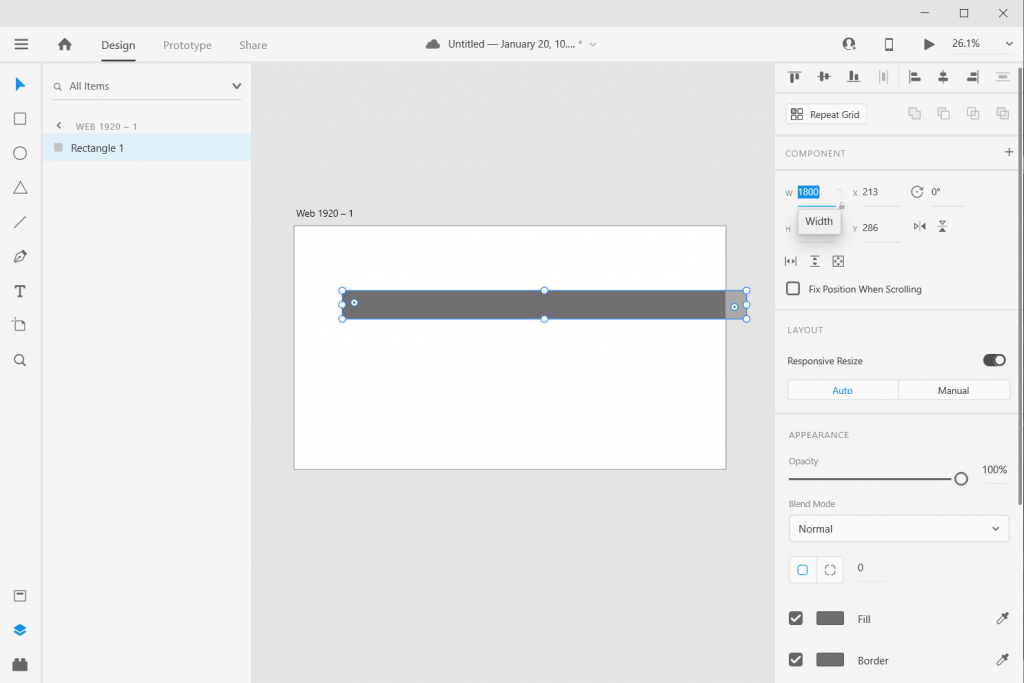
Step 3. Size it using pixels. I often just multiply all my data by 10 or 100. I also usually start with the largest number (so in my case 18 * 100 = 1800). It doesn’t matter if the bar fits on the artboard.
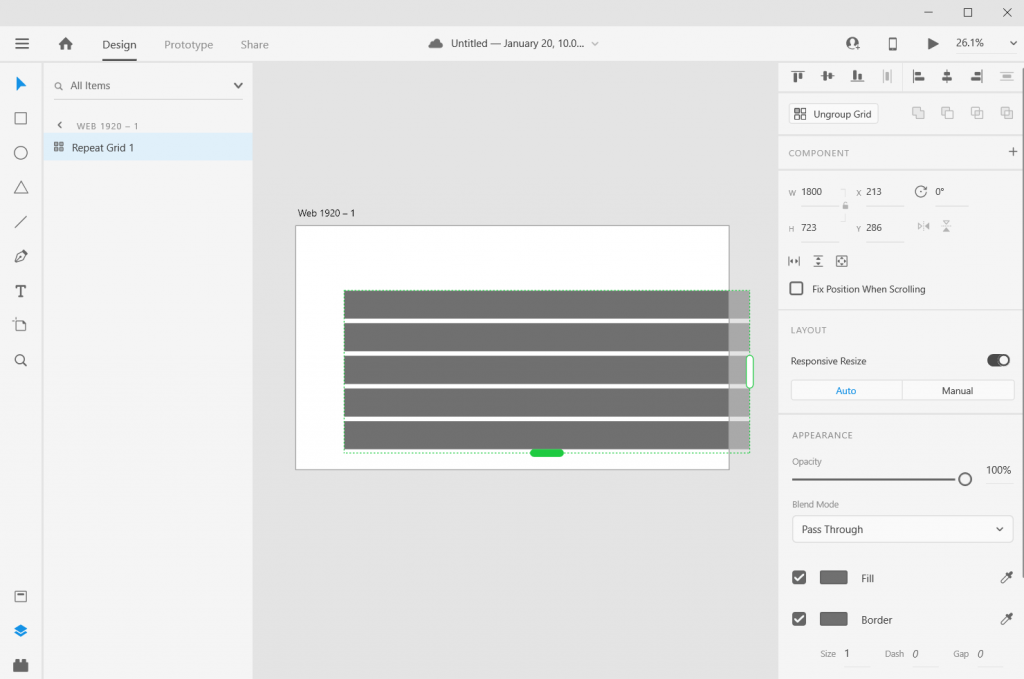
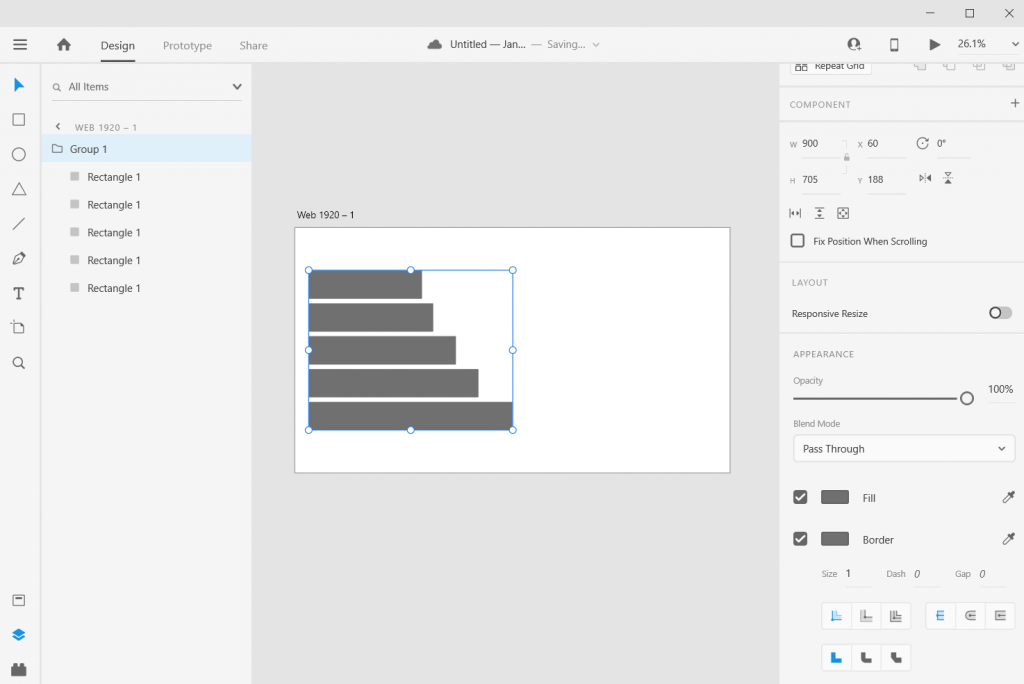
Step 4. Use “repeat grid” to copy the bar. Since I have 5 numbers I want five bars (or you can copy/paste, or you can insert new bars).
If you used repeat grid like I did, you should then ungroup the grid.
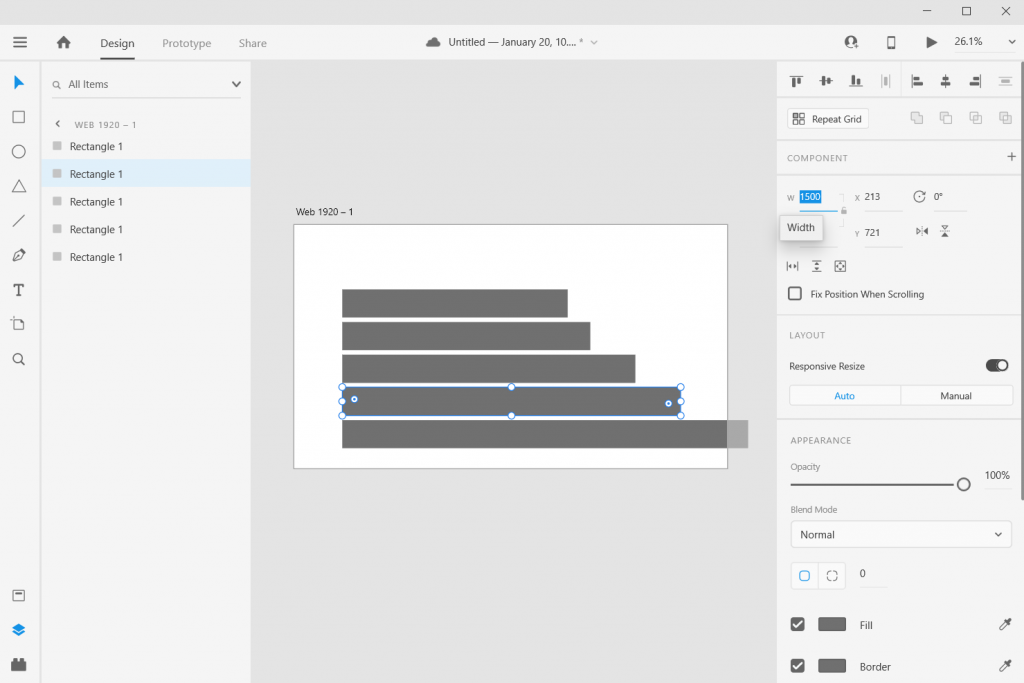
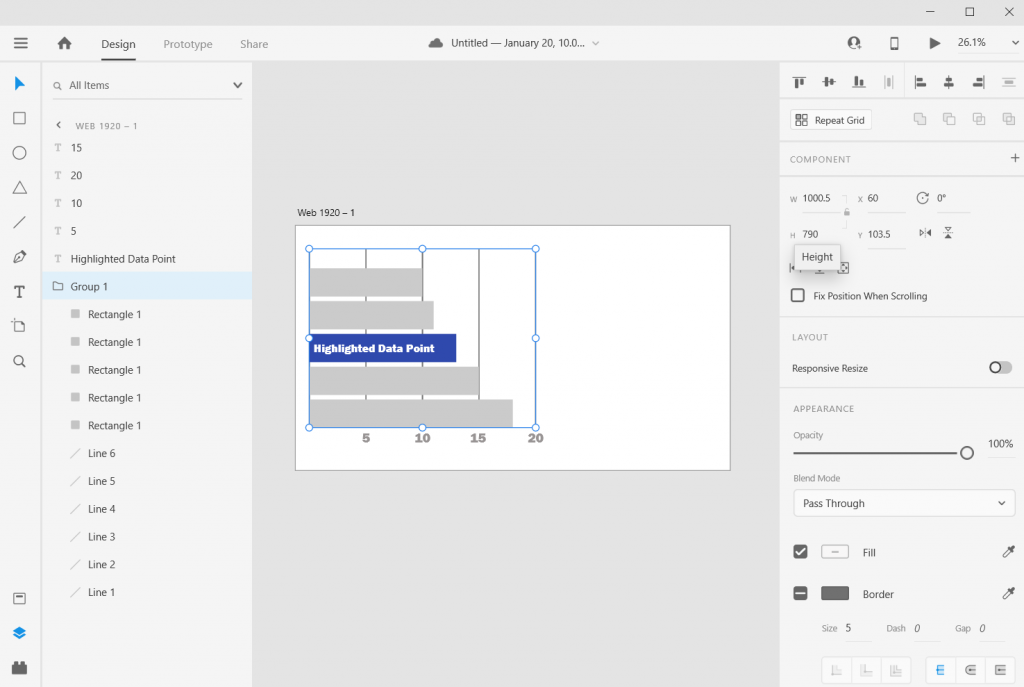
Step 5. Now resize the rest of the bars based on your data.
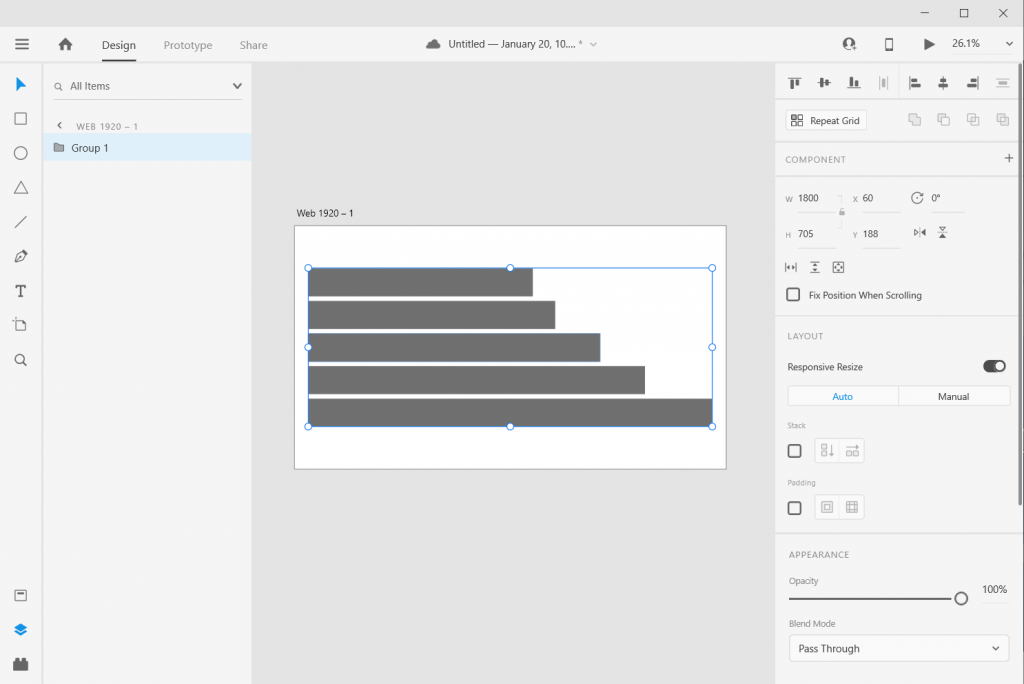
Step 6. Now select all the rectangles (group them if you would like) and resize or center so it fits on your artboard. As long as you stretch or skew the bars together, the visual will still be accurate.
And there you go, you have a bar chart.
How to create a good looking bar chart.
Okay, so now you know the basics, let’s look at what else you can do. Adobe XD is a design program, not a spreadsheet. What you lack in automatic charting, you gain in complete control over formatting.
Stretch and Skew.
Adobe XD is a vector design program, so you can stretch and skew to your heart’s content without sacrificing quality. And as long as you group all the bars together prior to changing the size, bar proportions will remain intact.
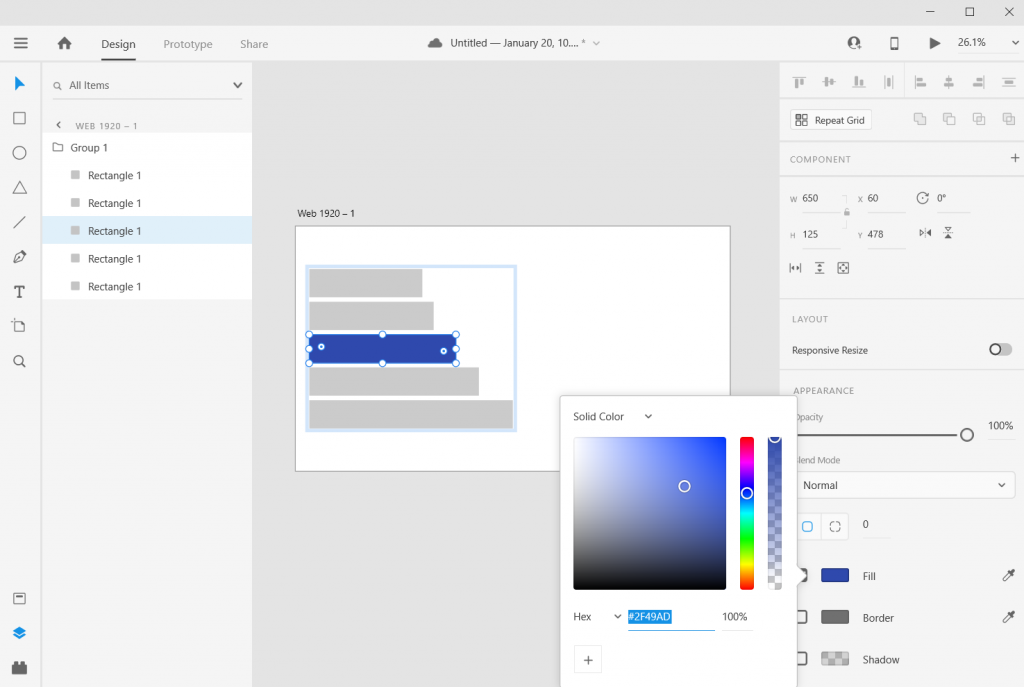
Adding Color
Add color by just selecting a rectangle and then clicking on the box next to “Fill/Border.”
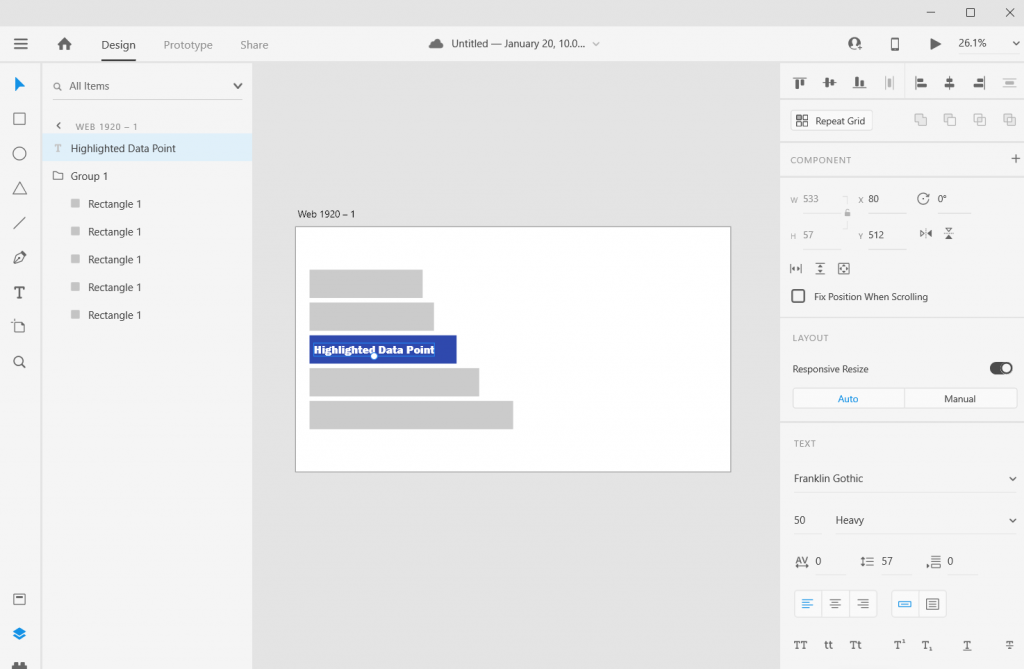
Adding Labels
Add labels by clicking the “T” icon and entering the text somewhere on the page. You can easily shift the text placement, change the size, change the font, or change the color. Do the same for any bar labels you want.
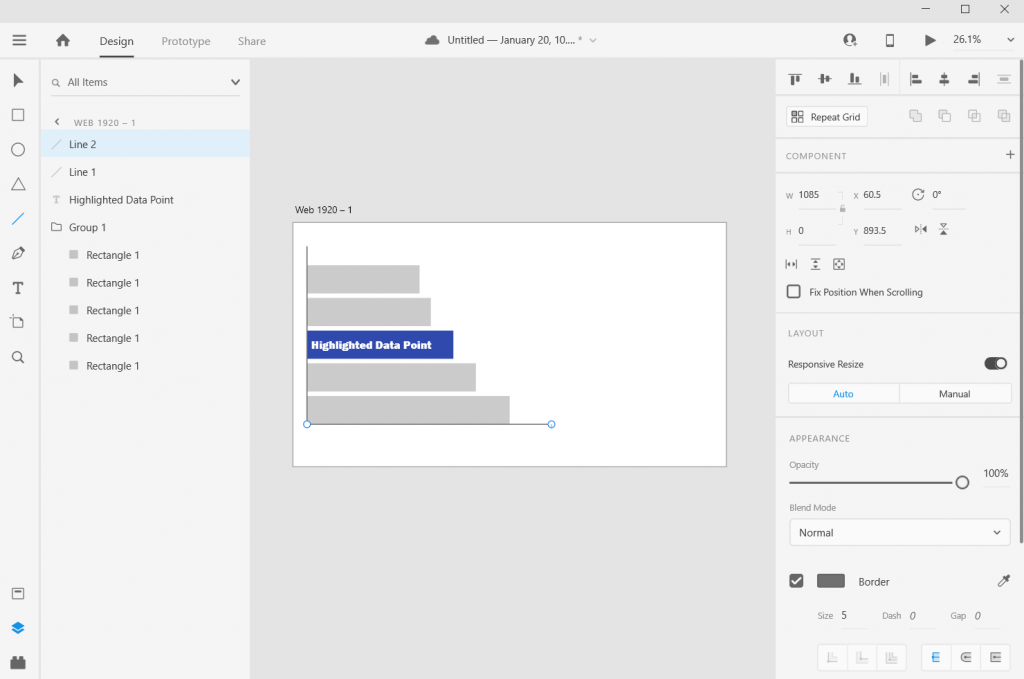
Adding an Axis
If you want one, add one with a couple of lines. XD makes it really easy to align objects to other objects.
Adding Grid Lines
Want Grid Lines, just draw them. Use the pixels/ x and y coordinates to measure and place. XD keeps every object on its own layer, so if you want the grid behind everything, just drag them to the bottom on the left hand side.
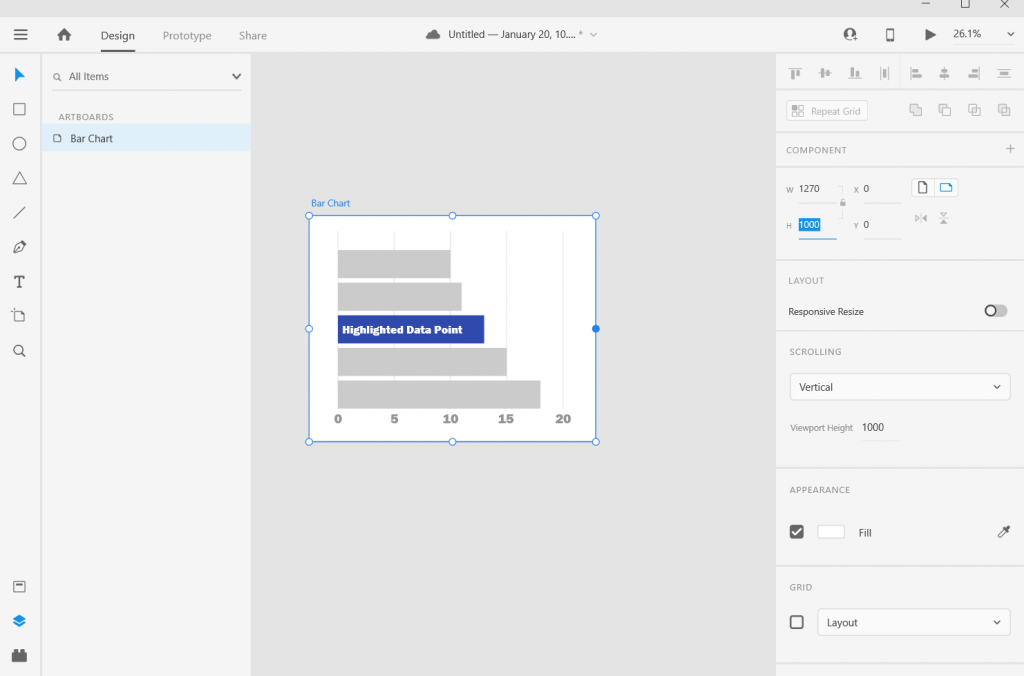
Adjusting the Art Board
Adjusting the art board is as simple as adjusting the size of any shape within the artboard. Just click on the artboard title, you’ll be given the ability to drag the sides (or you can just change the pixels in the W & H boxes on the right side of the page).
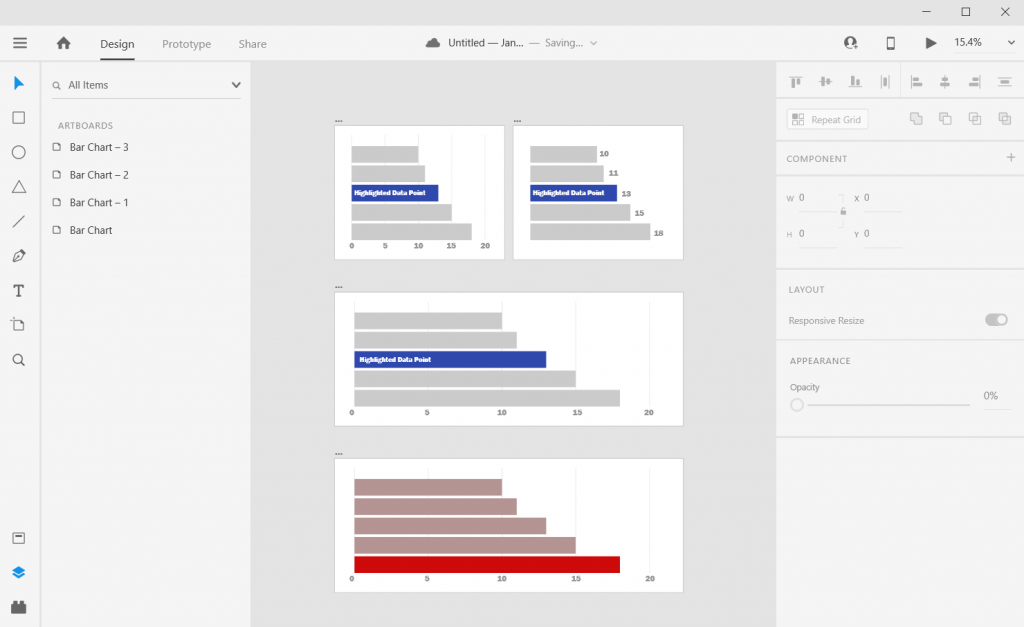
Alternate Shapes and Sizes
You can also copy/paste or duplicate artboards. This lets you create all sorts of different shapes and sizes for different dissemination tools.
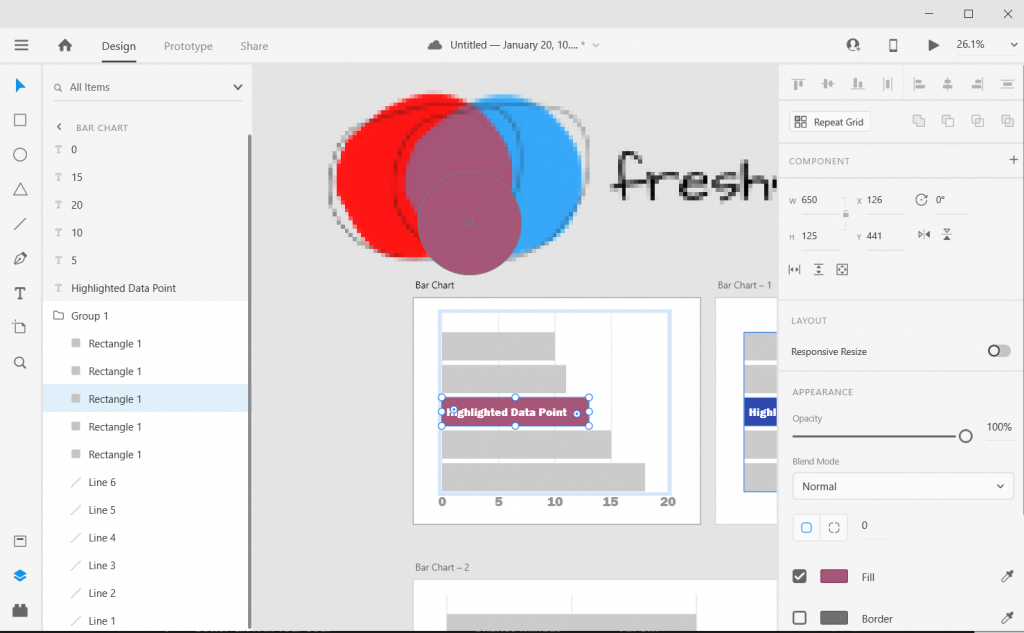
Matching Colors
Want to color match your bar chart with a logo or picture? Just paste the image into the XD file then use the eye dropper to pick the color.
Beyond the Basics
This is just the basics. There are all sorts of things you can do with Bar Charts in XD.
I often use Adobe XD when I want to increase the control I have over the aesthetic presentation. Especially if I am creating infographics or visuals meant to be shared across multiple communication channels.
6 other things related to creating bar charts with Adobe XD
1. Want to know more about pixel math?
Want to go deeper into the pixel math I use to create charts in Adobe XD? I wrote a post on it that you can check out here: Pixel Math, Charts, and Adobe XD
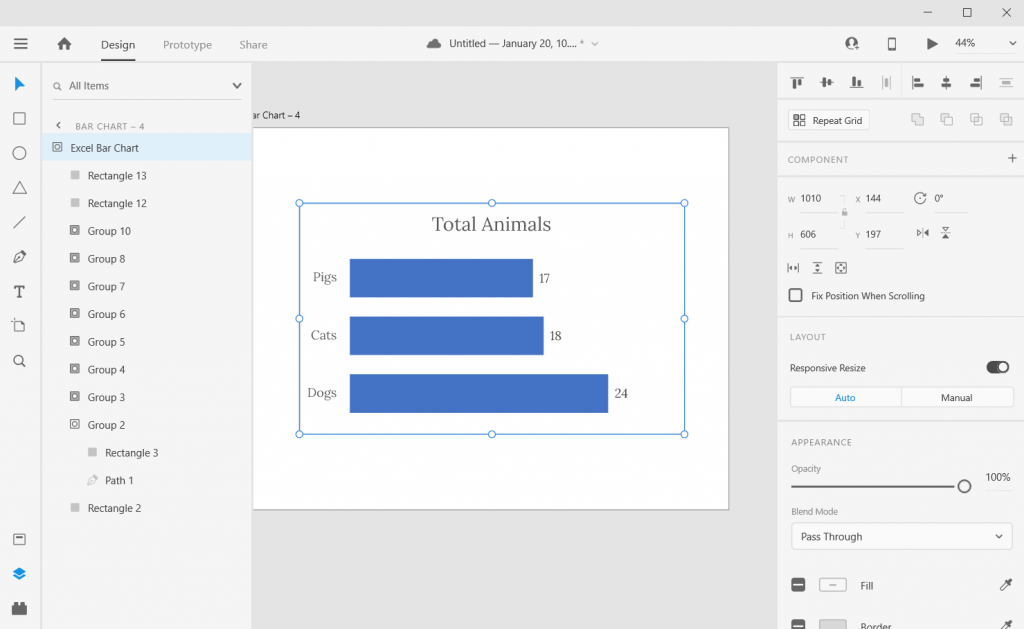
2. Want to create in Excel and format in Adobe XD?
That’s really easy to do. Just save your Excel chart as a Scalable Vector Graphics (SVG) file.
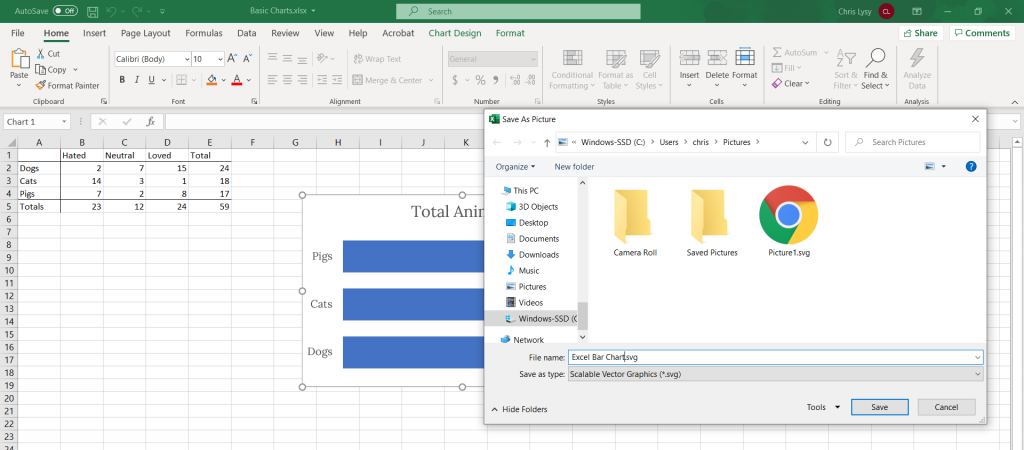
You can then drop the SVG file right into Adobe XD. The chart will actually show up in layers, making it really easy to tweak colors/styles. If there is a lot of data, it can be easier to create the charts in Excel (or in R or something else) and bring it over to XD for formatting.
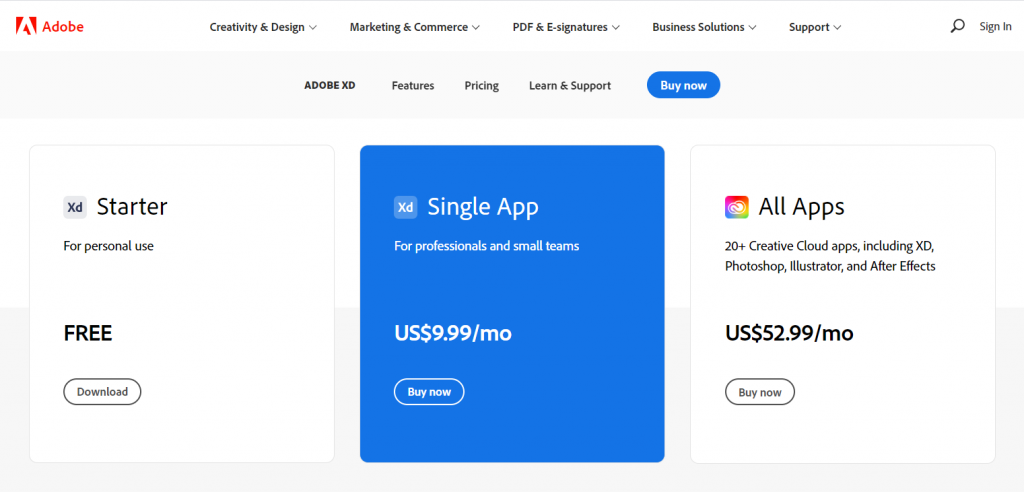
3. Adobe XD is FREE-mium.
Okay, so they’ll try to upsell you to the “Single App” or a Creative Cloud plan. But the Starter plan is completely full featured. It’s only missing some of the collaboration features and cloud storage, which you really don’t need most of the time.
Also, if you are already a user of Adobe Creative Cloud (Photoshop, Illustrator, InDesign, etc. (then you already have access to the full program).
4. Adobe XD works on both PC and Mac.
There are a couple of tools that are similar to Adobe XD (and better in some respects). One of those tools is called Sketch. Unfortunately with Sketch, you can only use it on a Mac, which might work for many UX designers but not so much for most of the data visualization designers I know.

5. There are plugins that can act as chart creators.
Another option for those with lots of data is to use one of a Adobe XD few plugins that auto create charts from CSV data. Honestly, I find it easier to just create the basic charts elsewhere and paste in, or just build within the profile. But these options do exist.
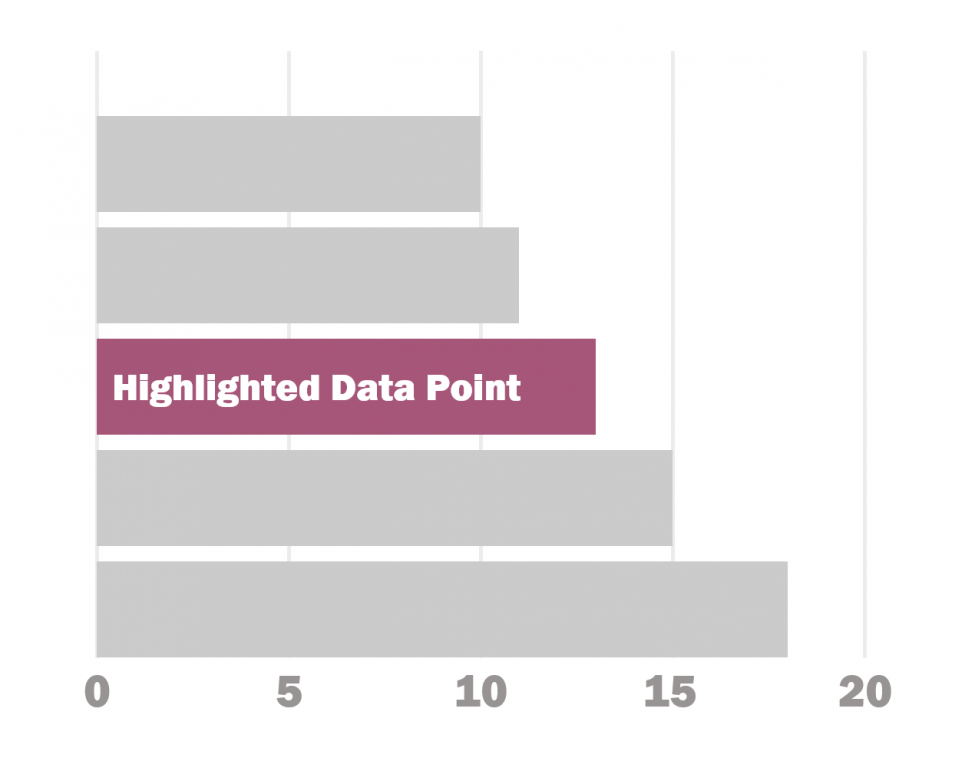
6. Any good bar chart examples?
I shared a few bar chart examples and considerations in my How to create bar charts in Excel post. The cool thing about Adobe XD is that you can replicate just about any static graphic you find on the web. You can also prototype all sorts of interactive graphics as well.