One thing I’ve been learning lately is how to use ArcGIS, a super fancy mapping tool that allows you to collect, analyze, and visualize all sorts of data.
I’ve talked about mapping with clients and at conference presentations for awhile, and I’ve loved using public (read: FREE) mapping tools to learn more about the communities I was serving or studying.
I’ve used maps in many ways – describing the community for grants or needs assessments, determining which students need home visits, or figuring out which resources are near students’ homes.
Most recently, I’ve gotten to use maps through my part-time work as a researcher at Ohio State.
We were trying to figure out if the students in our college had practicum placements within federally designated “medically underserved communities.”
Using a free public map file from a government agency and uploading a list of addresses where our students were placed, I was able to instantly visualize and (through ArcGIS’s fancy tools) analyze the percentage of our students working within underserved communities.
Seeing it all come together was magical.
It painted such a clear picture of the impact of our college and the difference that our students are able to make.
Given the disproportionate impact of COVID-19 on disadvantaged communities and the rising awareness of systemic racism on, well, every aspect of community life, knowing what children and families need outside of school – and acting on it — is critical.
Using data to pinpoint which students are at the greatest risk of disengaging from online school or whose families struggle to meet basic needs is essential for targeting interventions and outreach.
Here’s a list of free mapping tools to get you started (from my May post on the AEA365 blog):
Demographics
- U.S. Census Bureau QuickFacts and Data Explorer
- Income Segregation Maps (Stanford Center on Poverty and Inequality)
- KIDS COUNT Data Center (Annie E. Casey Foundation)
Education
- School and Community Factors that Affect Learning (Brookings Institution)
- School Zones and Segregation (Vox)
- Education Data Explorer (Urban Institute)
- NAEP Report Cards – Data Tools
Health
- U.S. Department of Health and Human Services Datasets
- USDA Food Access Research Atlas
- Air Pollution Map (Center for Public Integrity)
- HRSA Mapping Tool
- COVID-19 Dashboard (Johns Hopkins University)
City and county agencies also have amazing resources. See if your health or police departments, school districts, or universities have online tools for exploring your area.
Here’s a map I created of the schools, hospitals, and other services where I live, from the city’s mapping tools:

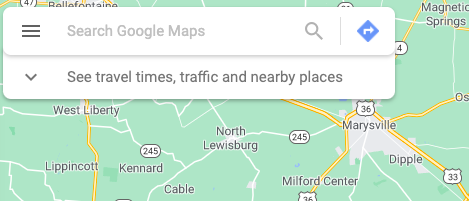
Beyond being a lifesaver for those with a poor sense of direction like me, Google Maps offers a free tool for creating your own maps. You can map multiple data sources and use colors, symbols, and labels to make sense of your data.
|
To get there from the Google Maps page, click on the three lines at the top left of your screen (see image below).
|
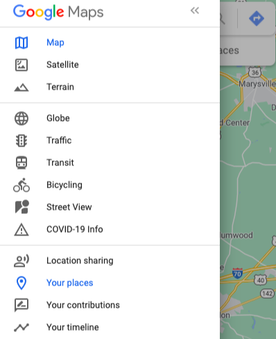
Then, go to “Your places” (highlighted in blue below).
|
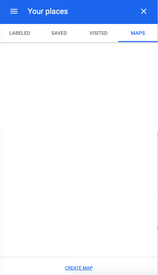
Finally, in the “Your places” menu, click the “Maps” tab on the right and then “Create Map” at the bottom.
|
Now think about each of your students and families as dots on that map. Imagine what they might see every day when they walk down the street. What resources are available to them in their community? In what ways is their community potentially putting them at risk?
You can use what you learn from your mapping explorations to influence survey questions and interview protocols for students and families. For example, if there has been a recent rise in crime rates in a neighborhood, ask families and students if they feel safe and what the school or district could do to make them feel safer.
Certainly, your findings can also help you figure out what services to offer within your program or school.
It’s been so enjoyable to build my mapping skillset and explore a whole new way of looking at data. I hope you take some time to play around with these mapping tools and see what you can learn!