Stop overthinking infographics. Not every infographic needs to be a fully illustrated well-developed story. It can be enough to just share a simple factoid or quote and give it some pretty colors.
In my workshops I tend to call simple infographics, micrographics. But you also might see them mentioned as featured images, small infographics, or social graphics.
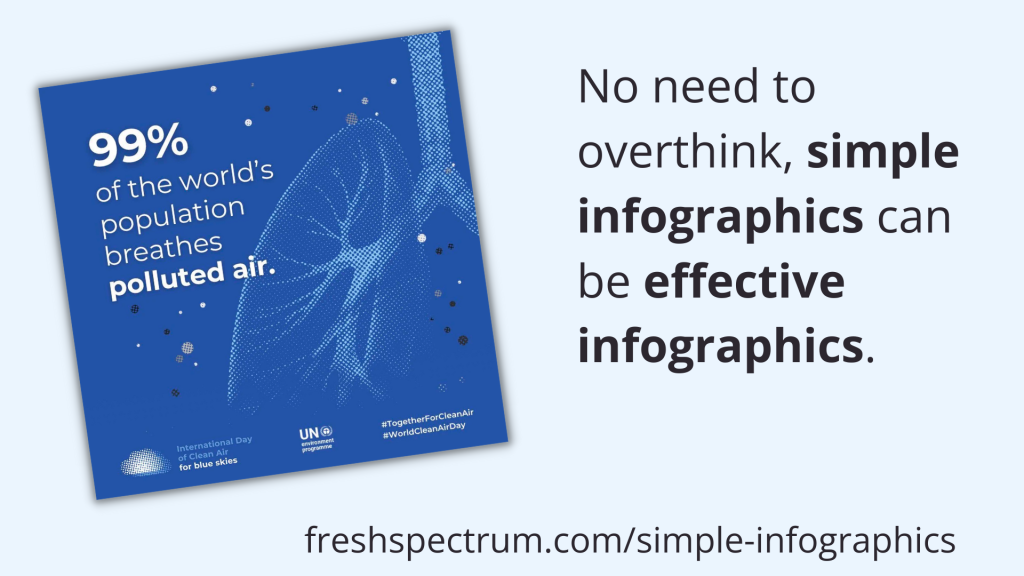
But let’s just look at an example. Take the following shared on UNICEF’s twitter account.
Clearly, there is not much to soak in here. There is a factoid, “99% of the world’s population breathes polluted air” with simple colors and basic illustration of a lung. It also shows a few social media hashtags and names the source program.
There is NOTHING deep about this micrographic.
But it serves a purpose as a transition tool. One goal of this image is to share a fact, but the bigger goal is to engage the reader into digging deeper.
Creating Simple Infographics in Canva.
Canva is by far my favorite tool for creating micrographics. It’s just so darn simple.
I created a sample set of templates as examples for the tips in this blog post. Just to note, I did use Canva pro when making these templates. So there may be a few elements you would need to swap out if you wanted to use any of these in the free version.
But the techniques are so simple, it’s probably easier to just create your own.

7 Tips for Creating Simple Infographics
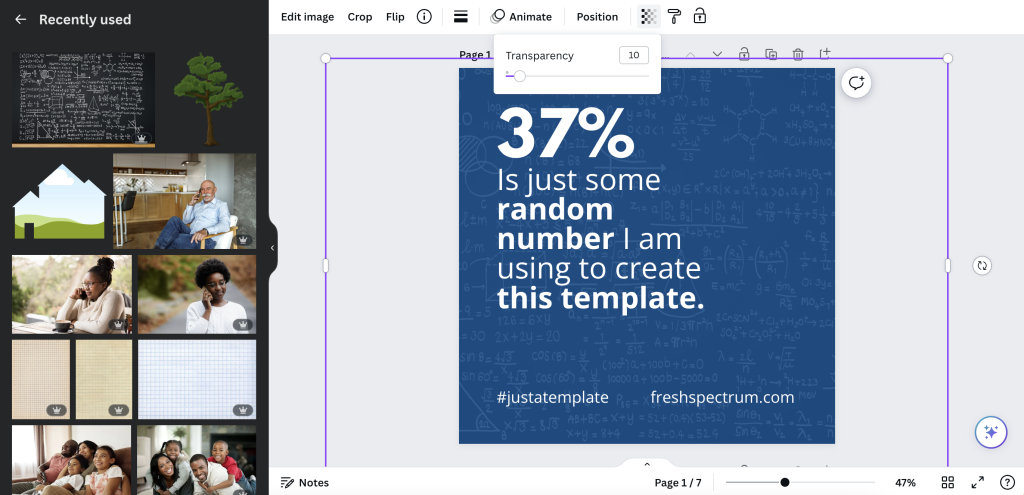
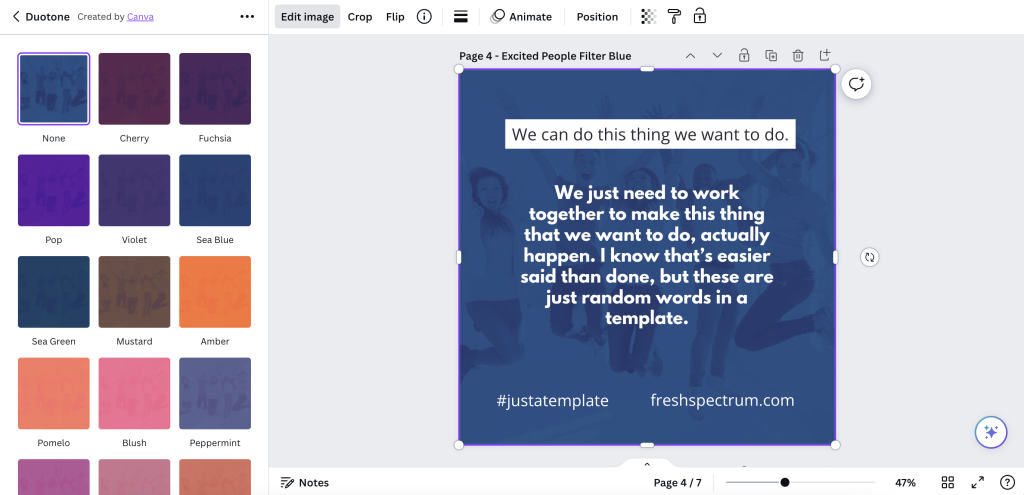
Tip 1. Add a photo in the background but make it transparent.
One of the easiest ways to use a photo, but stay on brand colors, is to start with the background in a color of your choosing. Then add a photo on top, turning down the transparency. This will let the color shine through.
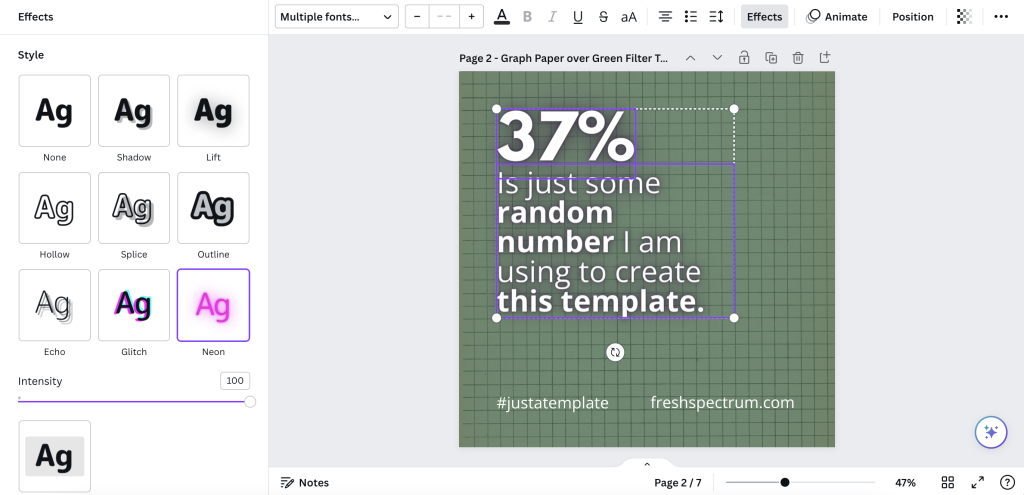
Tip 2. Add some text effects.
Sometimes the text just doesn’t pop, or the backdrop isn’t interesting enough to draw attention. Using a text effect might help a little. I like using “Lift” or “Neon” effects in Canva to help text stand out a little, especially when the background isn’t light or dark enough to provide good contrast.
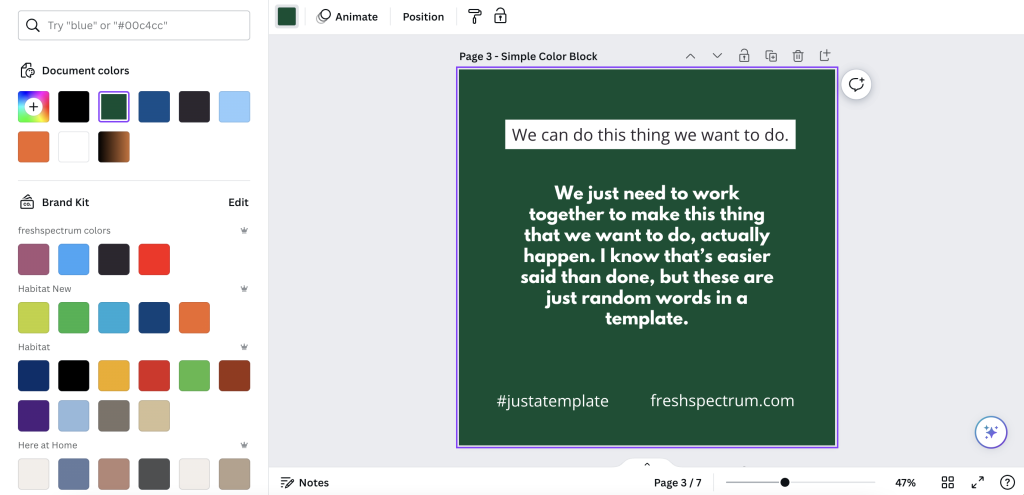
Tip 3. Sometimes a block of color is enough.
Not everything has to be fancy. A solid block of color in the background might be enough to have your micrographic stand out in a social media feed. And the lack of extra flair can help your audience retain focus on the text.
Tip 4. Photo effects can be used as well.
With a micrographic you really want there to be enough contrast between the text and background. So using photos can be complicated. I showed one way to filter up top, but the simple way is just to use one of Canva’s photo filters.
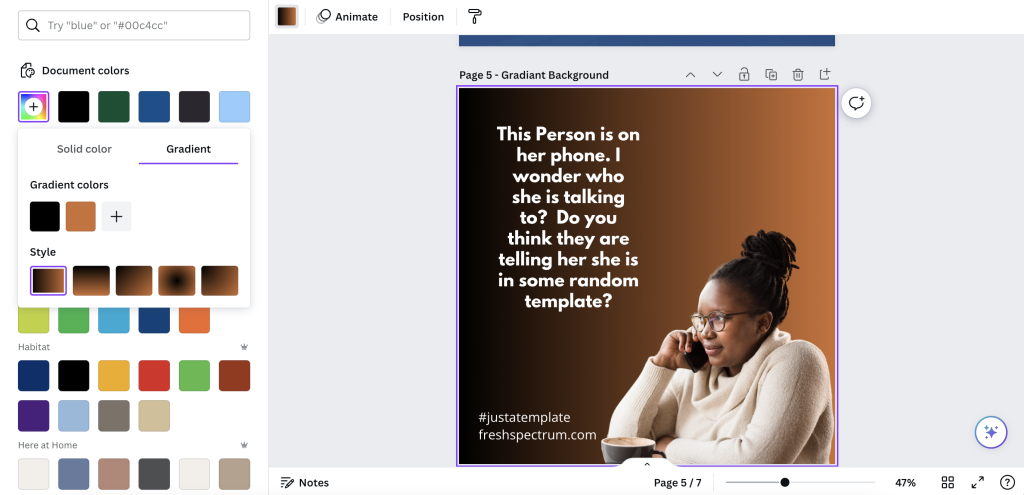
Tip 5. Use gradients
A gradient will just merge two different colors in your background. You just choose the colors and style in Canva’s color menu.
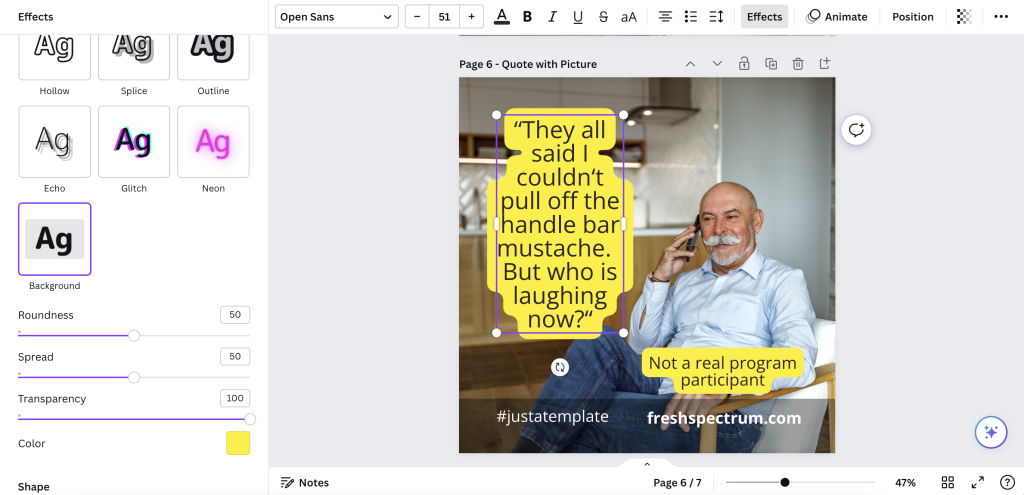
Tip 6. Simple quote with a solid background.
When using images that don’t give sufficient contrast, one simple way to adapt is to just give the text some background. You can do this manually with shapes or use the Canva Background text effect.
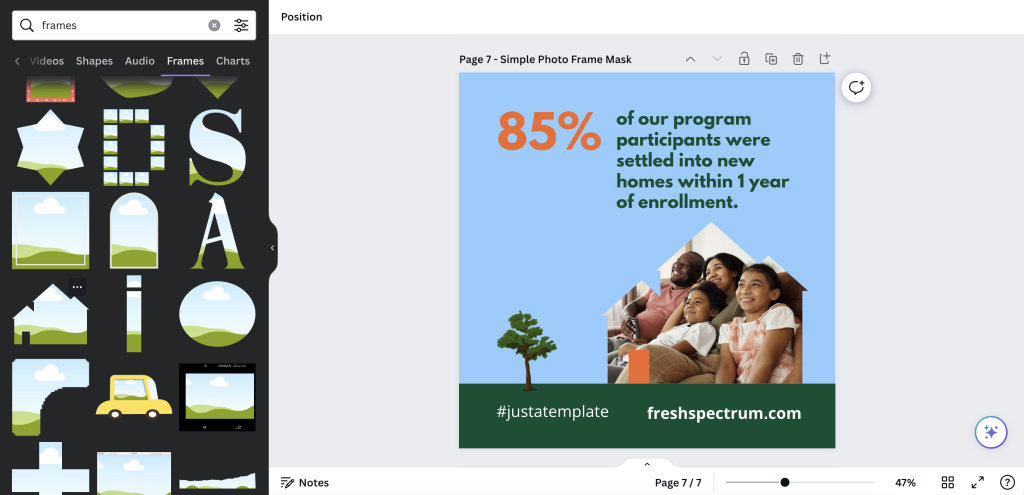
Tip 7. Simple photo masks using Canva frames
One of Canva’s basic tools is a type of photo mask they call Frames. A simple frame let’s you use photos without taking over the space needed for the text.
Just have fun with it.
Evaluators and researchers are notorious for overthinking creative work. Whether it’s from a lack of practice or just an underdeveloped creative confidence, it’s something I see all the time.
Over and over again I hear stories where an evaluator spend weeks working on a long infographic, data dashboard, or report only to get crickets in response.
But then they end up working on some other kind of passion project or side work and just spend a little time creating something fun. And it’s the fun thing, that took very little time, that people love.
It’s okay to have fun when designing.
And if anyone complains, you can tell them I said it was okay.