• Skip to main content
  • Skip to footer
  • Home

The May 13 Group

the next day for evaluation

  • Get Involved
  • Our Work
  • About Us
You are here: Home / Archives for cplysy

cplysy

Dec 28 2022

New Template: Interview Tracking Log

This article is rated as:

I'm new to eval EA Traffic Light.jpg

I do some eval EA Traffic Light.jpg

Eval is my main role EA Traffic Light.jpg


Eval Academy just released a new template, “Interview Tracking Log”

This template is available as a Word document as well as an Excel file.

Who’s it for?

This Interview Tracking Log can be used by anyone who will be completing interviews to collect qualitative data.
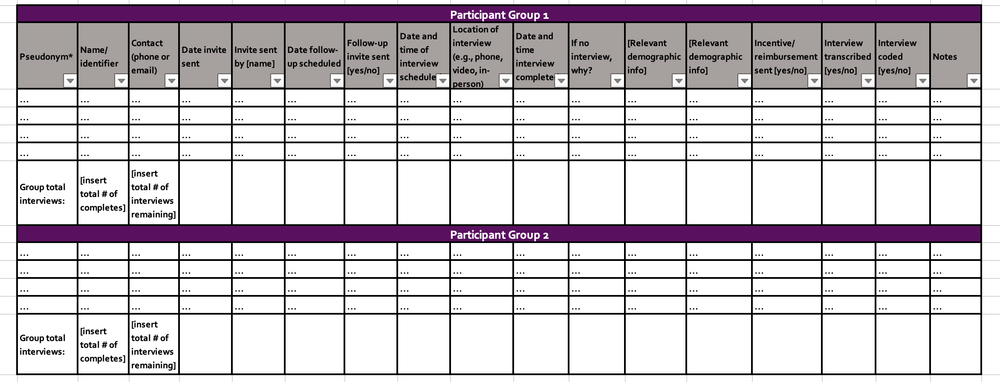
What’s the purpose?

The Interview Tracking Log is a tool to use when collecting data through interviews to keep track of participant recruitment. It can help you to reach your interview targets by tracking relevant information such as participant demographics and when to send interview invites to potential participants. The tracking log should be modified to capture project-specific information such as relevant participant demographics and it should be continuously updated throughout the recruitment and interviewing process.

What’s included?

Whether you prefer to work in Word or Excel, this tracking log provides you with key points to follow in the recruitment and interview process, as well as a matrix with relevant columns and space to track the information you need.


Download Word Document


Download excel file


Learn more: related articles and links

You can learn more about collecting data through interviews on Eval Academy through the following links:

  • How to Conduct Interviews

  • How to use Calendly to schedule interviews like a pro

  • Consent Part 1: What is informed consent?

  • Consent Part 2: Do I need to get consent, how do I do that?


Some helpful Eval Academy resources to support your qualitative data collection include:

  • Standard Interview Guide Template

  • Standard Interview Information Letter Template

  • Standard Interview Consent Form Template

  • Standard Interview Templates Bundle


What do you think of our new template? Let us know in the comments below!

Written by cplysy · Categorized: evalacademy

Dec 28 2022

New Infographic: 10 Reasons to Evaluate!

This article is rated as:

I'm new to eval EA Traffic Light.jpg

I do some eval EA Traffic Light.jpg


Eval Academy just released a new infographic, “10 Reasons to Evaluate” 

Who’s it for?

This infographic is for Program Managers and Program Leaders who are thinking about implementing an evaluation and are looking for a little inspiration as to why evaluating this year is a good idea!

What’s the purpose?

This infographic lists 10 reasons to evaluate such as supporting a program’s resource allocation and for program improvement.

What’s included?

A printable 1-page infographic that identifies 10 reasons to get evaluating!


Download the Infographic


Learn more: related articles and links

You can learn more about starting an evaluation on Eval Academy through the following links:

  • What is evaluation? A review of AEA’s recent post

  • What conversations do you need to have at the start of an evaluation?

  • What program managers need to share with their new evaluators

  • How to kick off your evaluation kick-off meeting

  • Scoping an evaluation: Begin with the purpose

  • How to plan your evaluation timelines: 5 simple tips

Some helpful Eval Academy resources to kick off your 2023 evaluation include:

  • Evaluation RFP Checklist

  • Evaluation Kick-Off Meeting Agenda Template

  • Evaluation Plan Template

  • Program Evaluation Scoping Guide


What do you think of our new infographic? Let us know in the comments below!

Written by cplysy · Categorized: evalacademy

Dec 28 2022

Common Evaluation FAQs

This article is rated as:

I'm new to eval EA Traffic Light.jpg


In this article, we provide the answers to some of your FAQs about evaluation including:

  • Why do people conduct evaluations?

  • Where can I find an evaluator?

  • What makes a good evaluator?

  • How can I get training in evaluation?

  • What is the difference between research and evaluation?

  • How much does an evaluation cost?


Why do people conduct evaluations?

The “why” for an evaluation depends on the “who.” Generally, an evaluation is conducted because a person or group of people (i.e., stakeholder(s)) need to systematically answer questions about a project, program, initiative, and/or system. The information discovered through an evaluation can be used for different purposes depending on the stakeholders involved, but may include:

  • Assessing merit/worth (i.e., judgement)

  • Improvement (i.e., learning)

  • Demonstrating resources are well spent (i.e., accountability)

  • Early identification of problems (i.e., monitoring)

  • Adapting and informing design of the initiative (i.e., development)


Where can I find an evaluator?

Recommendations from colleagues and business contacts who have used an evaluator in the past is always the best place to start. If you’ve asked around and still can’t find anyone, then you can search the online directories. Evaluation is a distinct discipline and profession, which means there are professional associations all over the world.

The Canadian Evaluation Society, the American Evaluation Association, the European Evaluation Society, the Australian Evaluation Society and African Evaluation Association all have directories of evaluators you can search for according to geography.

If you’ve found some names on the directories, it’s a good idea to do some background research on that person or firm. LinkedIn is a good place to find out about their qualifications.


What makes a good evaluator?

In our article The Six C’s of a Good Evaluator, we list credibility, curiosity, communication, creativity, and common-sense orientation as five important skills and traits to look for in an evaluator. All of these are important in determining the sixth “C” which is competency. A competent evaluator will demonstrate all these traits and will sometimes even have a professional designation that shows they have the requisite skills, knowledge, and practical experience. For example, the Canadian Evaluation Society has a Credentialed Evaluator designation and a listing of those people on their site.

Of course, “good” is a value-based term that ultimately will be determined by who is interpreting it. If one person values one particular skill, trait, method, approach, or type of evaluation over another, then it is best to find an evaluator who is competent in that area and prioritize that over other areas to best meet your need. 


How can I get training in evaluation?

If you are looking for formal education in evaluation, several universities offer high-quality, graduate-level education in evaluation. In Canada, The Consortium of Universities for Evaluation Education (CUEE) lists courses and programs. The American Evaluation Association also has a listing of university programs all over the world.

If you are not looking for formal education, but self-directed learning then there are a number of online courses, webinars, articles, and podcasts you can start with. Eval Academy is a great place to start. Check out our available courses. The professional associations mentioned above also have listings of courses.

Of course, some of the best learning and training occur by doing. Do you know someone who is an evaluator? Are they willing to mentor you? Do you work in an organization that contracts evaluators? Can you find a way to learn from them? Most of us learn by doing, so the best training is some formal learning with a lot of real-world applications.


What’s the difference between research and evaluation?

Research and evaluation share methods but differ in their purpose. Research is curiosity-driven and often aims to generalize or develop theories that apply broadly. Evaluation is utilization driven and focuses on understanding a particular project, program, initiative, etc. While research aims to control settings and often uses an experimental design to support that (e.g., Randomized Control Trials); evaluation occurs in real-world settings which often inhibits the use of experimental design.


How can I become an evaluator?

There are many paths to becoming an evaluator. Although such programs exist, you do not need a degree in evaluation to be an evaluator. In Canada, The Consortium of Universities for Evaluation Education (CUEE) lists courses and programs. The American Evaluation Association also has a listing of university programs all over the world.

Having a thesis-based graduate degree may help an evaluator’s technical practice (i.e., competencies related to methodological decision-making). Many evaluators have degrees in social sciences, education, healthcare, or statistics that are complimented with shorter, targeted training courses.


How much does an evaluation cost?

Asking how much an evaluation costs is like asking how much a house costs. When you buy a house there are lots of factors that determine cost – location, size, level of finishing in the house, lot size, etc. The same applies to an evaluation. How many evaluation questions do you have? How many stakeholder groups? How often do they want to be involved? How do they want to be involved? How do they want the findings reported? Presentation? Video? Report? How many reports? What length is the report? And this doesn’t even get into the questions around methodology and evaluation approach!

If you need to fill in a line item on your budget, then some common rules of thumb are 5% – 20% of an initiative’s overall budget; however, your best bet is to go to a credible evaluator with as many details regarding your initiative and evaluation so they can provide you with an informed quote.


Do you have other evaluation questions you want answered? Drop them in the comments below or connect with us over Twitter!

Written by cplysy · Categorized: evalacademy

Dec 28 2022

Chart Templates: The Time Saver You Should Be Using

This article is rated as:

Eval is my main role EA Traffic Light.jpg

I do some eval EA Traffic Light.jpg


Creating clean and consistent charts does not need to be complicated or time-consuming. With some forethought and a style guide, you can draft templates for all your charting needs. Chart templates will alleviate the pains of trying to reformat every new chart from scratch. From adjusting text size and font to formatting bar width and colour, a template will save you a significant amount of time in drafting your next evaluation report.

Investing in creating chart templates for your next report will:

  • Save you hours in your reporting. While you will spend time upfront to draft your templates, it will save you time in the long run when formatting your other charts.

  • Apply “most” chart formatting to all charts of the same type (i.e., a bar chart template will apply best to other bar charts).

    Note: I say most and not all because you may have some manual formatting (e.g., a custom title) that will not always apply to subsequent charts.

  • Give you peace of mind knowing that your charts are consistent and professional looking. This will allow you to focus on better telling the story of the data and not worrying about minor formatting issues.

Learning to create chart templates is best done by doing. And we want to go beyond generic Excel chart templates and create something visually engaging for our evaluations. Therefore, here I will walk through how to format an appealing and impactful chart to use as the backbone for your first chart template.


Creating a Chart Template

Sometimes the best data visualizations are the simplest (here are some tips to help improve your data visualizations), and few charts are as simple and effective at presenting data as the bar chart. And creating a standard template for your bar charts will speed up the reporting process.


The Excel Default

1. Highlight the data from which you want to draft a bar chart. In this example, we will plot the top ten coffee-consuming countries.

2. Navigate to Insert > Charts > Clustered Bar Chart


 Drafting a Better Template

1. Trim the fat by removing unnecessary labels and gridlines.

  • Click on the data labels along the horizontal axis and hit Delete.

  • Click on the vertical gridlines and hit Delete.

2. Change the font to your style of preference.

  • Select the chart and navigate to the Theme Fonts and chose your favourite font (here I will use Tw Cen MT).

  • Change the Font Colour to black. While font colours can be adjusted, using a standard black font is often best for the readability of your chart.

  • Adjust the Font Size to your preferred size (here I adjusted the font to size 11).

3. Draw attention to the bars by increasing their width and changing their colour.

  • Right-click any bar > Format Data Series…

  • Adjust the Gap Width to 30%

    Note: a smaller percentage decreases the gap between bars and increases the overall size of each bar.

  • Change the Fill to the colour of your choice.

    • For extra emphasis, you can mute most bars to focus on your key findings (e.g., highlight the top three in a Dark Blue and mute the remaining in a Light Grey).

    • If opting to mute some colours and emphasize others, you will need to manually click on the bars you want to change the colour of one-by-one, and change their colour by right-clicking or using the Format option for the chart.

4. Add in data labels.

  • Click on any bar to highlight them all > Right-click > Add Data Labels OR

  • Click on the + symbol at the top right of your chart (when highlighted) > Toggle on Data Labels

5. Sort the data in descending order (largest to smallest).

  • Data are often entered or sorted from largest to smallest value. However, by default, Excel will plot bar charts with the top value in a table as the bottom bar and the bottom value in a table as the top bar.

  • To correct this, right-click on the vertical axis labels > Format Axis > Categories in reverse order

6. Make final touches to the bar chart template by removing the border and improving the title.

  • Right-click on the chart > Outline > No Outline

  • Click on the title and write a title that tells the story of the data being presented. Bold the import pieces and increase the font relative to the rest of the chart to draw attention to the title.


Saving and Applying a Chart Template

Once you’ve put in the effort to format a single chart to your desired preferences, it is only a matter of saving the template and applying the template to other charts without having to go through all the previous steps.

1. Right-click on the chart created in the ‘Drafting a Better Template’ section > Save as Template…

2. Next, create another default Excel bar chart with new data (see ‘The Excel Default’ section).

3. In the unformatted bar chart, right-click > Format Chart Type… > Templates > Select your bar chart template.

4. While the template will transfer over, you will need to make minor edits to the chart title (e.g., to highlight to top three tea consuming countries) but all other formatting will be done automatically.


A Quick Hack for Copying Over a Chart Template

Saving and applying your chart templates is always recommended. But sometimes you need to apply the same template to multiple, consecutive charts. You could follow the above process and upload your chart template to each chart individually, but there is a faster approach and one that I use often.

Note that in the following example I use a slightly modified template, in that I no longer highlight the top three countries and I did not modify the title. However, this approach works with any formatting or template previously created.

1. Create all the default Excel charts for the charts to which you want to apply a chart template.

2. Format a single chart to your preferred style or apply a saved chart template.

3. Next click on the formatted chart and copy (CTRL + C or Right-click > Copy) the chart.

4. Click on the next unformatted chart and on the Home tab select Paste > Paste Special… > Formats (or use the keystrokes ALT + E, S, T and Enter); this will copy the chart format to the unformatted chart.

5. Follow the same Paste Special… process or keyboard shortcut for the next chart, or simply press F4 after the initial format has been pasted over once. F4 will redo the previous command, which will allow you to simply click on each subsequent unformatted chart and format it with the press of a single key.


You can create templates for all chart types, and it will save you an inordinate amount of time in your future evaluations. Even creating a basic template to build off will save you time in the long run.

Not all charts need to be identical, but a framework with consistent fonts, bar widths, etc. will improve the look and readability of your report charts. Add in your personal touches and experiment with colour, size, and labelling to create charts to wow both your employer and clients.

Do you use chart templates in your evaluation work? Let us know in the comments!

Written by cplysy · Categorized: evalacademy

Dec 23 2022

Designing Powerful Gatherings for Impact

There is an art to creating a great gathering. There is also a science of sorts. We create great gatherings by design — meaning we take the principles of great service design and apply them to an event.

Whether it is a board retreat, an annual general meeting, or maybe a think tank, a great event starts with a good design. By good design, we mean applying what we know of the art and science of Design to gathering. It’s about creating experiences that meet a need and add value beyond what could be done independently.

That’s one of the reasons we gather.

Events As Services

A service has the following qualities:

  1. A purpose
  2. A set of resources designed to achieve that purpose
  3. A setting
  4. An interaction between a service-seeker and the service provider

An event is a type of service. The service-seeker (participant in the event) brings with her some expectations and is seeking to join the event for a purpose. Our job as a designer is to determine what their purpose(s) might be. That might be to learn something, to meet people, to create opportunities for business or partnerships, or to simply escape their usual day-to-day. It might be any or all of these.

Organizers have a purpose, too. They want to promote something, connect people, elicit ideas or feedback, work through problems, or make decisions. There are myriad reasons why we gather and why organizers want to host events.

As a designer, we look to how we can create value through an event for everyone — the service provider (the host) and the service seeker (the participants). This means designing for many different needs, wants, preferences and capacities and aligning them.

Next, we look at what resources we have available to achieve our goals. This is our space, time, people, and budget to ensure we achieve something worthy of the time, care, and attention of those who attend.

Why? Because our time and attention are more valuable than anything involved in an encounter.

Using tools like storyboards or attractor maps, we can map out the journeys of participants through the event toward a destination. When doing this, we consider both physical and virtual spaces involved and plan out the event from the very moment that someone encounters an event promotional message to the time they leave and beyond.

Events As Transformation

It’s our human-to-human links that make the most meaningful moments of our lives.

Joshua Cooper Ramo

The COVID-19 pandemic and everything tied to it reminded us of the role of gathering in our lives. We’ve learned that we can do things online that we never envisioned. We can work together more effectively using remote digital tools than before. We also see the value of real, in-person face-time.

We’ve come to learn how valuable our time is and what the value is in gathering.

If we are to spend the time and energy gathering, we need to make it pay. Pay means showing value — it has to be worth our time, care, and attention. When done well, our gatherings should transform. To use our key indicator of design: they must inspire.

A successful event must be designed for transformation. A powerful event takes us from here to there. That is a journey. It means we need to engage people, enlighten them, and ensure that those who attend engage with each other. It’s the reason why a single person attending a remote webinar, not engaging with others, rarely achieves transformative change.

A journey means knowing where we are when we begin, who is involved, what pathways we want people to travel (there may be many), and where we want them to go after their journey. This involves combining journey map-style methods with a theory of change. None of these need to be elaborate; rather they simply must be intentional. We have to be clear about what we want, otherwise, the event isn’t going to be designed properly.

Events as Process

How often have we been to events that were a bust because they weren’t fit for purpose? We’ve been to educational events that could have done a better job of teaching, networking events that gave few means for people to connect, and think tanks that provided little space to think and reflect. It happens all the time.

Good events come by design. Transformation comes from intention.

To achieve impact, we consider the event beyond the boundaries of the time and space allocated. A great, transformative event should linger. For example, we want people to learn by reflecting on what they encountered and using it long after they attend an event. So why end our interaction when people leave? Follow-up. We have the tools to do it.

This means designing the event as a process. You can design your event from the moment you share the first word about it to the last goodbye and follow-up. This is what makes the event memorable, and it’s those memories that form the fabric of our lives. It’s why we gather and connect.

Put thought together about what you want and what you want to happen, and then apply some service design thinking, and you will have something more than a gathering; it’s transformation.

Please contact us if you’re looking at hosting a strategic gathering to achieve impact and transformation. We design, facilitate, and evaluate them for impact.

The post Designing Powerful Gatherings for Impact appeared first on Cense Ltd. .

Written by cplysy · Categorized: cameronnorman

  • « Go to Previous Page
  • Go to page 1
  • Interim pages omitted …
  • Go to page 106
  • Go to page 107
  • Go to page 108
  • Go to page 109
  • Go to page 110
  • Interim pages omitted …
  • Go to page 304
  • Go to Next Page »

Footer

Follow our Work

The easiest way to stay connected to our work is to join our newsletter. You’ll get updates on projects, learn about new events, and hear stories from those evaluators whom the field continues to actively exclude and erase.

Get Updates

Want to take further action or join a pod? Click here to learn more.

Copyright © 2026 · The May 13 Group · Log in

en English
af Afrikaanssq Shqipam አማርኛar العربيةhy Հայերենaz Azərbaycan dilieu Euskarabe Беларуская моваbn বাংলাbs Bosanskibg Българскиca Catalàceb Cebuanony Chichewazh-CN 简体中文zh-TW 繁體中文co Corsuhr Hrvatskics Čeština‎da Dansknl Nederlandsen Englisheo Esperantoet Eestitl Filipinofi Suomifr Françaisfy Fryskgl Galegoka ქართულიde Deutschel Ελληνικάgu ગુજરાતીht Kreyol ayisyenha Harshen Hausahaw Ōlelo Hawaiʻiiw עִבְרִיתhi हिन्दीhmn Hmonghu Magyaris Íslenskaig Igboid Bahasa Indonesiaga Gaeilgeit Italianoja 日本語jw Basa Jawakn ಕನ್ನಡkk Қазақ тіліkm ភាសាខ្មែរko 한국어ku كوردی‎ky Кыргызчаlo ພາສາລາວla Latinlv Latviešu valodalt Lietuvių kalbalb Lëtzebuergeschmk Македонски јазикmg Malagasyms Bahasa Melayuml മലയാളംmt Maltesemi Te Reo Māorimr मराठीmn Монголmy ဗမာစာne नेपालीno Norsk bokmålps پښتوfa فارسیpl Polskipt Portuguêspa ਪੰਜਾਬੀro Românăru Русскийsm Samoangd Gàidhligsr Српски језикst Sesothosn Shonasd سنڌيsi සිංහලsk Slovenčinasl Slovenščinaso Afsoomaalies Españolsu Basa Sundasw Kiswahilisv Svenskatg Тоҷикӣta தமிழ்te తెలుగుth ไทยtr Türkçeuk Українськаur اردوuz O‘zbekchavi Tiếng Việtcy Cymraegxh isiXhosayi יידישyo Yorùbázu Zulu