• Skip to main content
  • Skip to footer
  • Home

The May 13 Group

the next day for evaluation

  • Get Involved
  • Our Work
  • About Us
You are here: Home / Archives for cplysy

cplysy

Dec 20 2022

Evaluation Christmas Cartoons 2022

Every holiday season I try to draw a set of Christmas comics. For whatever reason, it was harder this year.

SIMON: Do you still pick up the pen?

SPIEGELMAN: I pick it up, but it’s a very heavy instrument right now. And I’ve got little notes and little doodles and drawings. I have no idea what they can come to, and I’m hoping that the pen gets lighter if I get to use it every day and build up my finger muscles, you know?

Art Spiegelman on the re-issue of his book ‘Breakdowns’

I think in the new year I need to find some other way to pursue inspiration. And I have an idea, but will talk about that in January.

For now, I hope you’ll find at least a chuckle or two in this year’s set.
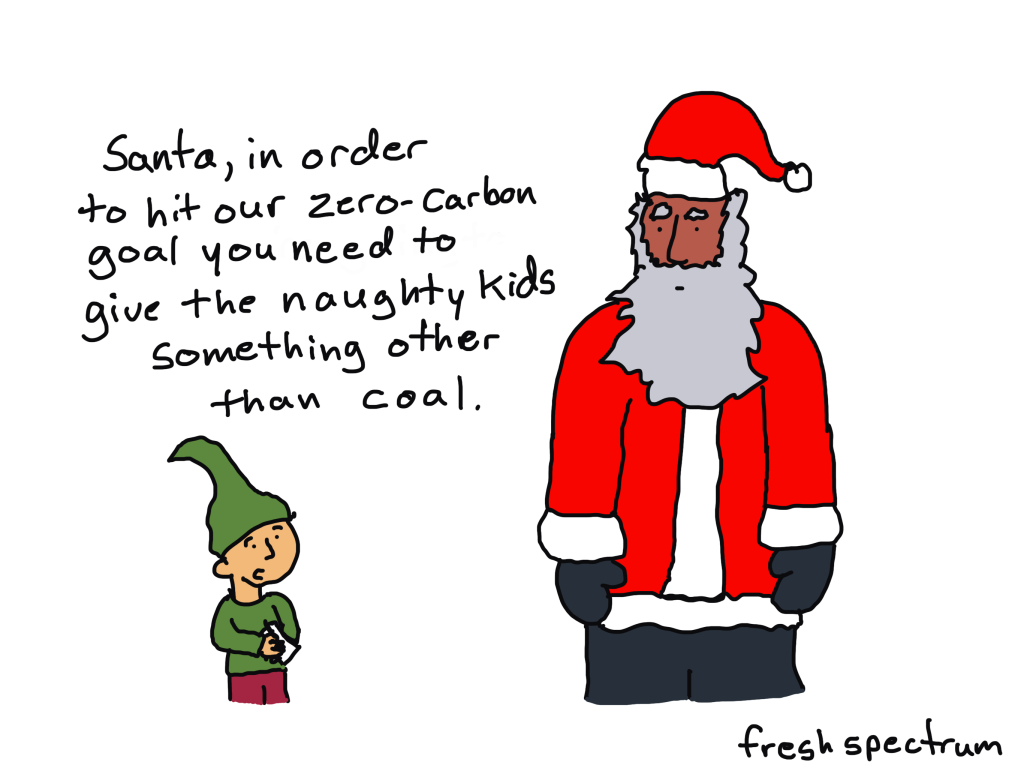
Zero Carbon Santa

I wonder what Santa could use instead of coal.
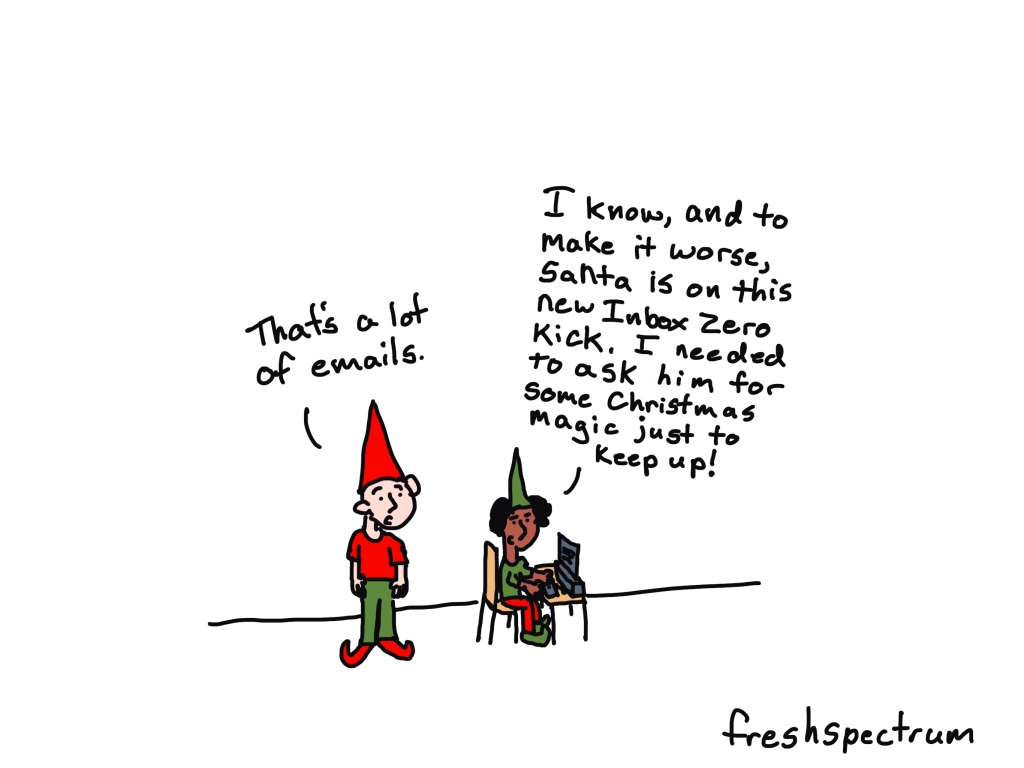
Inbox Zero

Santa probably gets a lot of emails. But I doubt he’s the one reading them all. Some elf probably has that responsibility…

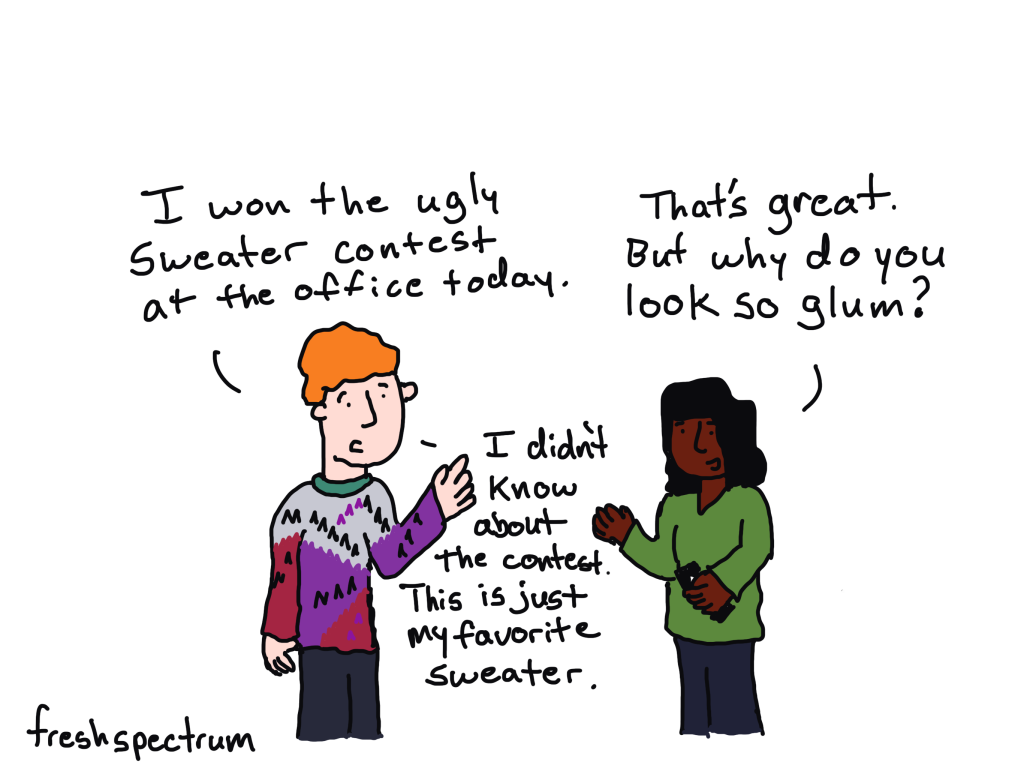
Ugly Sweater Contest

There was an ugly sweater contest at my office last week. I forgot about it but went to work wearing a sweater. The sweater wasn’t ugly, but it did inspire this cartoon.
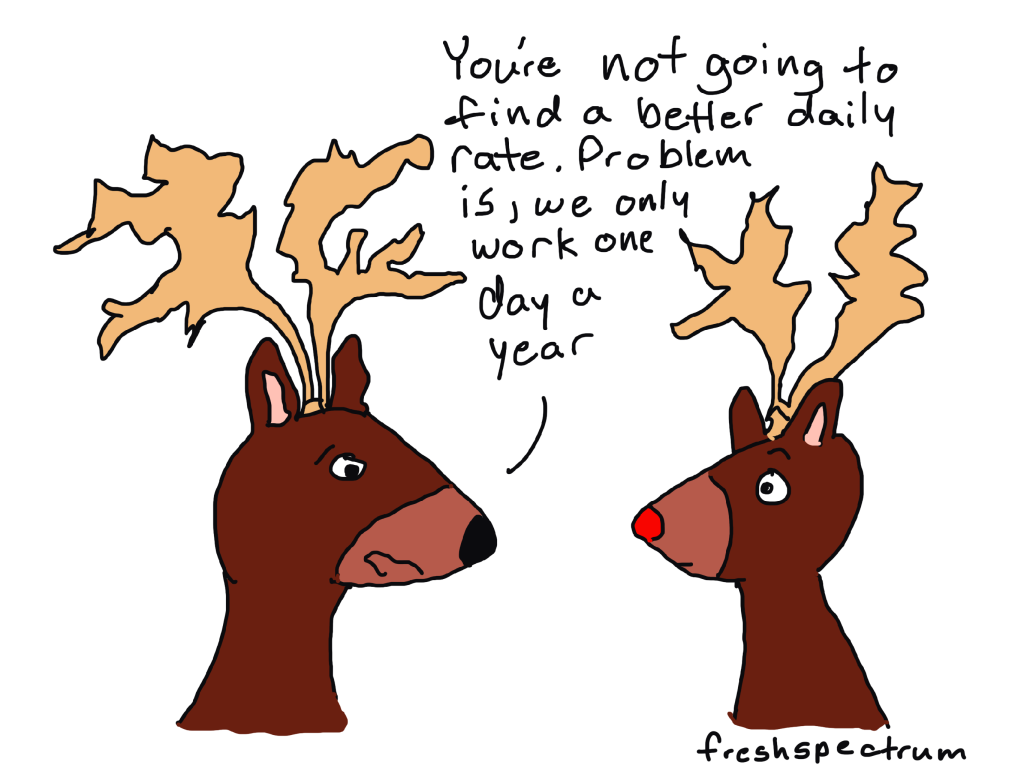
Day Rate

When I talk to other indie consultants, especially new ones, my key piece of advice is that your hourly or daily rate doesn’t really matter. Budgets matter a lot more.

Take reindeer for example, they only one day a year. They might get a really good rate for that one day, but is it enough to keep them in reindeer food and shelter for the remaining 364.

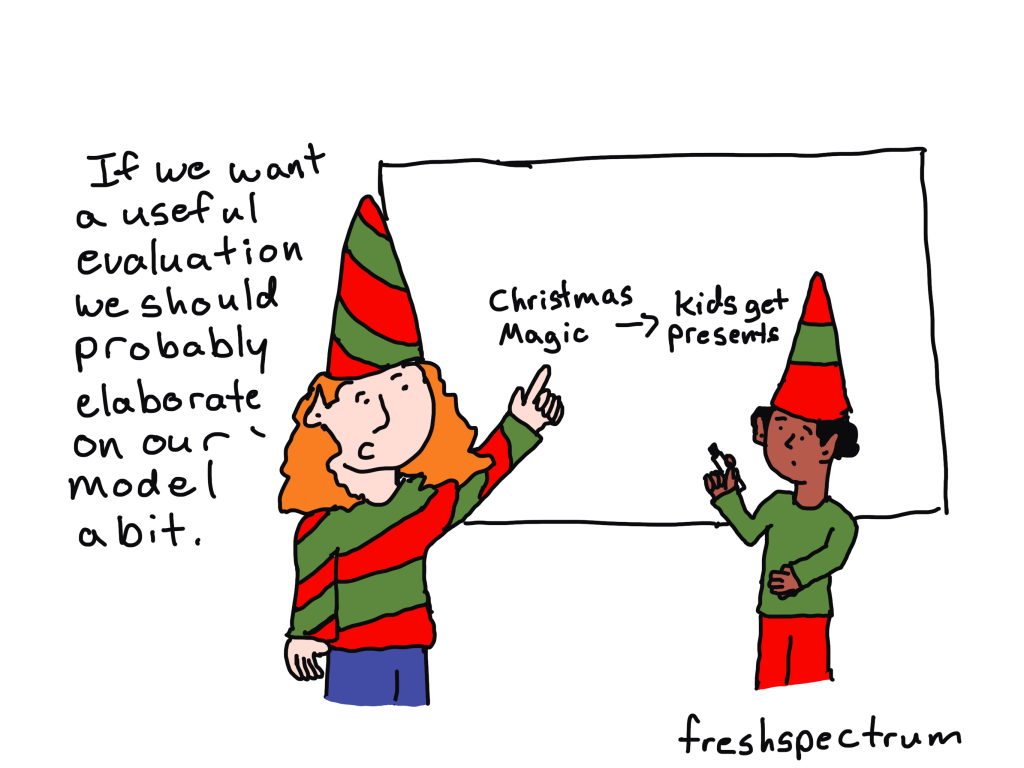
Logic model is a little too simple.

Trying to think of evaluation stuff I haven’t talked about during past holidays. This one is based on the idea that a lame logic model can lead to a lame evaluation. Also, these are elves, but I think we’re a little too zoomed in for that to be noticeable.
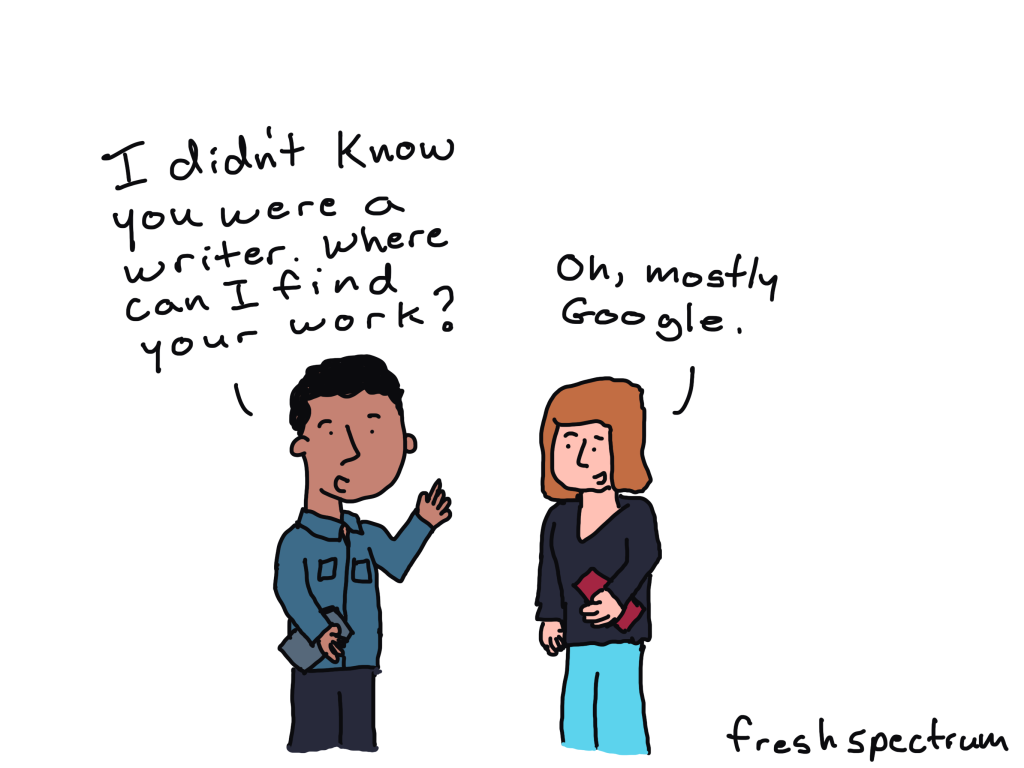
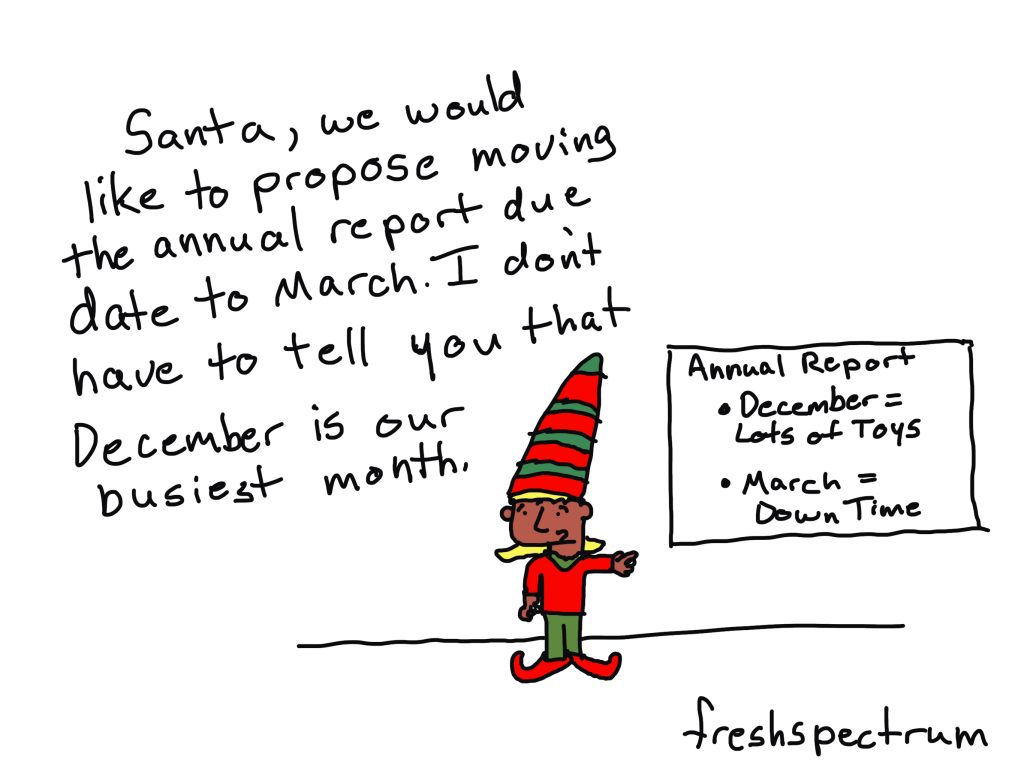
Annual Reports

Do you think Santa makes the elves deliver a year end annual report? Seems like it would be a little bit of stressful deadline to me.

I hope you have a fantastic holiday!

Whatever holiday you celebrate, I hope it is a good one. See ya next week 🙂

Written by cplysy · Categorized: freshspectrum

Dec 19 2022

Top 22 Dataviz Resources of 2022

7,700 total participants in my dataviz courses so far.

29 new blog posts: 20 from me, and 9 from guest authors.

6 YouTube videos: 4 on my channel, and 2 made for colleagues’ channels.

Just 1 podcast interview this year.

3 months off.

What a year. 

Top 22 Dataviz Resources of 2022 

Want to do some year-end learning as 2022 winds down? 

Here are my favorite data visualization resources from the past year. 

  1. Are Viewers Expecting a Story? I’ve talked about data storytelling a bajillion times, and this video encapsulates some of those key points. This is a great resource to share with your colleagues who are just getting started with dataviz and data storytelling.
  2. What Makes a Useful Data Story? 5 Questions to Ask: If you’ve been analyzing data for decades, then you already know how to spot useful nuggets that deserve to get graphed. But if you’re newer to data analysis, then you’ll appreciate this beginner-level post.
  3. Dashboard Don’ts: My 10 Worst Mistakes from Past Projects: A great self-assessment to see whether your dashboards are as sophisticated as you think–or not.
  4. How to Plan for Your Next Dashboard [Lea Pica’s Present Beyond Measure Podcast]: I spoke on dozens of podcasts in previous years, but had to scale that back in 2022 to make space for a 3-month summer vacation. Lea Pica’s podcast made me rethink this approach though. What a skilled host!!! She made my job as the guest so easy.
  5. What Type of Dashboard Do We Need? 4 Types to Consider + Diagram to Download: A required prerequisite before your spend thousands of dollars developing a dashboard.
  6. Creating Reports for Grant Deliverables Using Excel Dashboards: Josephine Engels’ guest post, which showcases some of her organizations’ real dashboards. A great case study!
  7. How to Visualize Margin of Error Data in Excel with “Slider Plots”: Lauren Fox’s guest post on visualizing nuances in our datasets, like margins of error. Includes a spreadsheet you can download.
  8. How to Avoid Death by PowerPoint by Differentiating Between Slidedocs and Slidedecks: I have an entire course on this topic, but this is a great starting point for organizations with so-so presentation quality.
  9. How to Present Dense Data Visualizations (Without Losing Your Audience): This technique is obvious and straightforward–yet I rarely see it done well. Let’s change that!!!
  10. Using Dashboards to Make a Family Trivia Event Even Better: Emily Ross’ guest blog post on how she adapted her Dashboard Design skills in her personal life.
  11. Change Takes Time: How to Practice Patience in Report Redesign Processes: Abby Henderson’s candid reflections on the not-overnight culture change that’s necessary to apply what you learn from me.
  12. Humanity in Data Visualization: Designing a One-Pager for My Grandma’s Caregivers: A fan favorite! This blog post got the most replies and kudos of everything published all year. I got chills when I read Mieko Yeh’s draft.
  13. How to Hack Excel — and Add Totals to the Tops of Stacked Column Charts: Anat Zohar’s practical post on using invisible “helper data” inside our stacked charts.
  14. When a Course is More Than a Course: 3 Ways “Great Graphs in Excel” Was Beyond Graphs: Sue Griffey’s guest post about how she applied her course knowledge to her work life.
  15. How to Make a Not-So-Scary Starter Dashboard in Excel: One of my favorite beginner-level resources for getting started with Excel dashboards. Just 5 minutes, and includes a free download. I was pleasantly surprised when this video got 8,000 views within the first couple days.
  16. Do You Need a Single Map, or Several Maps? Every time I do a private client training, I try to find case studies that I can anonymize and turn into later blog posts. And every time, I run out of time. Until now!! I finally made time to turn this specific map lesson from a client training into a blog post to help more people.
  17. How to Write about Research Methods Like a Human (and Not a Textbook): Even though I focus on graphs… I have to edit paragraphs a lot. This post has plenty of before/after examples to get you started on editing your own writing.
  18. Stop Using Tiny, Grainy Photos in PowerPoint!!! Another anonymized example from a client training. This technique is obvious, but not widely used. Let’s change that, too!
  19. “Big A Accessibility” and “little a accessibility” Tips for Data Visualization: A mostly-complete checklist of everything we need to edit to ensure that our visualizations are accessible.
  20. How to Use Repeating Diagrams to Visualize Qualitative Concepts: My personal favorite from 2022.
  21. How to Use Gray Dashes Instead of Zeros in Tables: Includes an Excel tutorial and a spreadsheet to download.
  22. How I Took 3 Months Off Work: A behind-the-scenes look at my part-time schedule, which I’ve been building 1% at a time since 2014. I didn’t take off 3 months because I was burned out. I simply have a long list of life goals that I’m trying to accomplish alongside my work goals. I had to take time off work to make space for those life goals.

Your Turn

What types of tutorials should I create in 2023?

Comment below with your requests.

Written by cplysy · Categorized: depictdatastudio

Dec 17 2022

De lo individual a lo colectivo

Fuente

Fuente

Dicen que se puede desarrollar una cultura de colaboración masiva, simplemente dándo a nuestros departamentos/silos organizacionales, desafíos colectivos que cada grupo/silo no podría resolver por sí mismos. Me contaron un paso simple, con un resultado masivamente poderoso. La forma de romper los silos es dar desafíos que ningún silo puede lograr por sí solo. Cuentan las leyendas que podemos pasar entonces de mecanismo para compartir conocimientos a  mecanismos para la colaboración.

Claves para el cambio de nuestra cultura de Gestión del Conocimiento: este cambio pasa por el cambio cultural de lo «individual a lo colectivo»:

  • De «lo sé» a «lo sabemos»
  • De «El conocimiento es mío» a «El conocimiento es nuestro«
  • De «El conocimiento es mi propiedad» a «El conocimiento es compartido«
  • De «El conocimiento es mi propiedad personal» a «El conocimiento es propiedad colectiva / comunitaria«
  • De «El conocimiento es mi ventaja personal» a «El conocimientoes ventaja de la organización«
  • De «El conocimiento es personal» a «El conocimiento es interpersonal«
  • De «Defiendo lo que sé» a «Estoy abierto a un mejor conocimiento«
  • De «no inventado aquí (es decir, por mí)» a «inventado en mi comunidad«
  • Desde «El nuevo conocimiento compite con mi conocimiento personal» hasta «el nuevo conocimiento mejora mi conocimiento personal»
  • Desde «el conocimiento de otras personas es una amenaza para mí» hasta «nuestro conocimiento compartido me ayuda«
  • Desde «Admitir que no sé es debilidad» hasta «Admitir que no sé es el primer paso para aprender«

Ese cambio de «Yo sé» a «sabemos» – de «El conocimiento es mío» a «El conocimiento es nuestro» es enorme y contracultural para muchos de nosotros.

Podemos encontrarlo aterrador pero dicen que, si lo logramos, es como vivir en un mundo diferente y mucho mejor.

Written by cplysy · Categorized: TripleAD

Dec 15 2022

No More Writing for Google

In today’s post I talk about an upcoming change to how I blog and why writing for Google works, but for me, shouldn’t be the point.

Cartoon - 
Person 1 - I didn't know you were a writer. Where can I find your work?
Person 2 - Oh, mostly Google.

It works. But that’s the problem.

There is pretty simple logic behind writing for Google.

People use Google to find information, often in pursuit of answers to their questions. If you can do an adequate job of answering those specific questions, you will likely start showing up as results in the search engine.

For instance, if you search for Canva Accessibility, you’re likely going to find a blog post by me ranked fairly high on the Google search page.

Screenshot of Google search for Canva Accessibility

Same thing happens if you search for how to convert Canva Reports to Word.

Screenshot of Google search for Convert canva reports to word

Now I’ve been doing this strategically over the past year (answering questions people have so that they rank high on Google). As such, I’ve had a big increase in my website traffic. My website has become a resource for people looking to improve their design skills.

As an independent consultant I had convinced myself that this was a good thing. If I could be a design resource it would lead more people to my workshop or towards hiring me for gigs as a web, graphic, and data designer.

But the more I reflect, the more I think it’s flawed logic.

I have fallen into a trap.

When you write for Google, you write for discoverability. You write to offer out resources into the world that can help people in need of those resources.

But here is the problem. Resource articles that do well on Google might be useful to the people with those questions, but they’re often pretty boring. They serve mostly an audience of strangers. But for the people who don’t care about the specific question, they offer nothing.

I’ve been playing the Google game successfully, and my Google score has been going up. But I’m not sure that makes sense for me and for this particular site.

Cartoon
If we show up first in Google, but nobody searches for that term, is it still good SEO practice?

Why not write for the people who already know I exist?

Most of the people who become my workshop participants or clients knew me first as a cartoonist. Or they saw a presentation I delivered at a conference or on a webinar. They didn’t discover me through Google.

And by THEY I also mean YOU. There are plenty of exceptions, but YOU likely “met” me first as an evaluation cartoonist.

Now that doesn’t mean you are only interested in the cartoons. The comics are really just reflections of the important but sometimes absolutely ridiculous things that we see in our field. The blog posts that do best for my existing audience are the ones that dig deeper into my life and reflections as an evaluator and designer in the 21st century. And then go deeper into what you yourself might be able to draw from these lessons.

But these posts don’t do well on Google. Because nobody is actively searching on Google for my cartoon illustrated reflections on the modern data world.

Cartoon
Person at computer thinking - "I want to read something that will help me reflect on my profession and think about our role in our modern digital society.  Now who do I put into Google."

More like a columnist, less like tech support.

So what does this all mean?

Well, I made a decision. I’m going to stop writing for Google and focus more on writing for you (and me). This space is going to be a blog again.

In other words less tutorials, more essays.

I’ll still teach design, but intentionally through my workshop not here on the blog.

Have any thoughts?

I am curious about what you think. This will likely be the way I move forward for the next few months regardless of feedback, but any feedback I’m given is always appreciated and considered.

Thanks for hanging out with me, -Chris.

Written by cplysy · Categorized: freshspectrum

Dec 13 2022

Eval Academy’s Top 10 Posts of 2022

To celebrate the end of the year, we thought we’d highlight Eval Academy’s top ten posts from 2022.

What posts or resources would you like to see in 2023? Comment below, tweet us @EvalAcademy or connect with us on LinkedIn!

10. Differences between Theory of Change, Log Frames, Results Frameworks and Logic Models – what are they and when to use them

 Noticed how there seem to be lots of evaluation tools doing very similar things? This article selects a few of our favourite tools to compare and contrast.


9. Finding the Right Sample Size (the Hard Way)

For quantitative data collection, this article helps you to calculate sample sizes by hand and understand the math behind sample size calculations.

8. How to “Quantify” Qualitative Data

This framework for quantifying qualitative data is one you’ll want to bookmark!


7. Evaluation Question Examples by Type of Evaluation

This article looks at how using different evaluation strategies or frameworks like Formative Evaluation and Developmental Evaluation can help you to craft those perfect evaluation questions.


6. Reflexivity in Evaluation

We’ve all heard of reflective evaluation practice, but what is reflexive evaluation practice? This article breaks it down for you and outlines tools and ideas for reflexion.


5. Everything You Need to Know about Likert Scales

The Likert Scale is one of the more commonly used rating scales in surveys. As evaluators, we should know a thing or two about it, and how to navigate some of the decisions involved in using a Likert Scale, and this article does exactly that!


4. But really, how do I use the RE-AIM Framework?

Ever heard of the RE-AIM Framework? This article provides an account of what it is and how to use the framework in your evaluation planning, implementation, and reporting.


3. Evaluation Questions Examples

At number 10 last year and moving up through the ranks, this article provides you with some examples of evaluation questions to inspire your own.


2. How to Write Good Evaluation Questions

Last year’s top post has moved into second place! This article outlines what an evaluation question is and points to consider when drafting your evaluation question. An ongoing top contender!

1. Interpreting themes from qualitative data: thematic analysis

Our top post for 2022 supports evaluators who are new to qualitative data analysis. We start by defining thematic analysis, then give you a 5-step process to complete your own analysis. We end the article by highlighting some common challenges with thematic analysis. It’s not one to miss!

Written by cplysy · Categorized: evalacademy

  • « Go to Previous Page
  • Go to page 1
  • Interim pages omitted …
  • Go to page 107
  • Go to page 108
  • Go to page 109
  • Go to page 110
  • Go to page 111
  • Interim pages omitted …
  • Go to page 304
  • Go to Next Page »

Footer

Follow our Work

The easiest way to stay connected to our work is to join our newsletter. You’ll get updates on projects, learn about new events, and hear stories from those evaluators whom the field continues to actively exclude and erase.

Get Updates

Want to take further action or join a pod? Click here to learn more.

Copyright © 2026 · The May 13 Group · Log in

en English
af Afrikaanssq Shqipam አማርኛar العربيةhy Հայերենaz Azərbaycan dilieu Euskarabe Беларуская моваbn বাংলাbs Bosanskibg Българскиca Catalàceb Cebuanony Chichewazh-CN 简体中文zh-TW 繁體中文co Corsuhr Hrvatskics Čeština‎da Dansknl Nederlandsen Englisheo Esperantoet Eestitl Filipinofi Suomifr Françaisfy Fryskgl Galegoka ქართულიde Deutschel Ελληνικάgu ગુજરાતીht Kreyol ayisyenha Harshen Hausahaw Ōlelo Hawaiʻiiw עִבְרִיתhi हिन्दीhmn Hmonghu Magyaris Íslenskaig Igboid Bahasa Indonesiaga Gaeilgeit Italianoja 日本語jw Basa Jawakn ಕನ್ನಡkk Қазақ тіліkm ភាសាខ្មែរko 한국어ku كوردی‎ky Кыргызчаlo ພາສາລາວla Latinlv Latviešu valodalt Lietuvių kalbalb Lëtzebuergeschmk Македонски јазикmg Malagasyms Bahasa Melayuml മലയാളംmt Maltesemi Te Reo Māorimr मराठीmn Монголmy ဗမာစာne नेपालीno Norsk bokmålps پښتوfa فارسیpl Polskipt Portuguêspa ਪੰਜਾਬੀro Românăru Русскийsm Samoangd Gàidhligsr Српски језикst Sesothosn Shonasd سنڌيsi සිංහලsk Slovenčinasl Slovenščinaso Afsoomaalies Españolsu Basa Sundasw Kiswahilisv Svenskatg Тоҷикӣta தமிழ்te తెలుగుth ไทยtr Türkçeuk Українськаur اردوuz O‘zbekchavi Tiếng Việtcy Cymraegxh isiXhosayi יידישyo Yorùbázu Zulu