• Skip to main content
  • Skip to footer
  • Home

The May 13 Group

the next day for evaluation

  • Get Involved
  • Our Work
  • About Us
You are here: Home / Archives for cplysy

cplysy

Nov 27 2022

Sampling bias: identifying and avoiding bias in data collection

This article is rated as:

Eval is my main role EA Traffic Light.jpg

I do some eval EA Traffic Light.jpg


Bias in evaluation is inevitable. Reflection helps us to identify our bias and when we do, it is necessary to identify sources of bias in our processes, eliminate which bias we can, and acknowledge which bias we cannot.

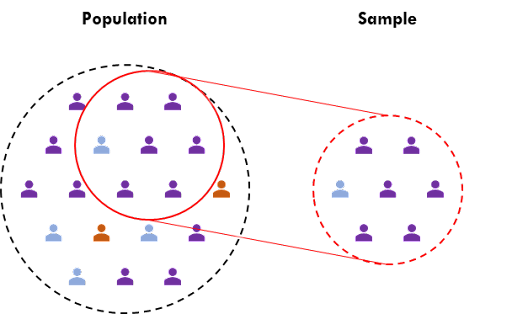
For simplicity, I will focus on the data collection process and the associated sampling bias: ‘Bias that results from certain outcomes or responses being favoured over others.’ Sampling bias results from groups of individuals being over- or under-represented during the data collection process. This results in weak, or incorrect, conclusions being drawn from the data. Incomplete data lead to incomplete results.


Identifying sampling biases

Sampling bias encompasses any biases that originate during the data collection process. Here we’ll focus on a few common sources of bias in data collection.

1. Undercoverage

Commonly specific groups of individuals are underrepresented in our data; this is undercoverage. Often minority or marginalized groups are absent from collected data or these groups are poorly represented so that their responses are diluted. This leads to poor conclusions about specific populations, as groups underrepresented may provide insights not captured by the majority.

Key points:

  • A segment of the population of interest in not represented (or underrepresented)

  • People captured in the data differ systematically from those not captured (e.g., demographic, social, or cultural differences)

Example: You want to understand how newcomers to Canada navigate the Canadian healthcare system by conducting English-language interviews. However, this will result in undercoverage as newcomers to Canada may be less than confident in their English fluency or may not speak English at all. The resulting data will skew towards English-speaking newcomers only and will not properly represent all newcomers’ thoughts and opinions on navigating the Canadian healthcare system. Conclusions drawn from these results may not generalize to or represent the underrepresented population, thereby reinforcing barriers and continuing to marginalize these groups.

2. Non-response bias

Inevitably some individuals will not respond to a survey or will back out of a scheduled interview last minute. Like undercoverage, non-response bias may result in some groups being underrepresented, but non-respondents opt not to respond, whereas in undercoverage, specific groups are missed and not provided the opportunity to respond. Non-respondents may simply have forgotten to respond or may refuse to respond. If the non-respondents differ from the respondents in some meaningful way, the subsequent results will be inaccurate. 

Key points:

  • Some people may forget to respond or be unwilling to respond to a survey (or participate in an interview)

  • Survey fatigue may result in increasing non-responses for latter survey questions

  • Technology is convenient but has limitations (e.g., some people do not have access to an email account or, if they do, emails are too often redirected to the spam folder)

Example: You are evaluating patient satisfaction using a survey following visits with a family medical doctor. Surveys are emailed to patients, and they are asked to complete the survey at their convenience. Guaranteed, there will be several non-responses as surveys are lost (email addresses are incorrect; email sent to spam), or patients forget to respond. Non-respondents may represent a specific group, such as single parents with limited time to complete the survey or elderly people that are less likely to access email. And again, conclusions drawn from these results would not necessarily generalize to the population of interest as non-respondents may differ in some meaningful way relative to respondents.

3. Voluntary response bias

This is where specific individuals volunteer to participate in a survey or interview. These individuals usually have a strong interest in the survey/ interview topic, either positive or negative. This results in a biased data sample that is crucially missing people of middling opinions.

Key points:

  • Participants self-select to complete a survey or interview

  • Strong opinions, positive or negative, are disproportionately represented in the data

Example: You want to receive feedback on ways to improve your organization by providing an anonymous survey link to all employees in your organization. Most responses will be from people that are completely satisfied with the organization or people that are completely dissatisfied with the organization. Responses will skew to the extreme and valuable information in the middle will be lost, which could result in changes to the program or organization that may be unwarranted if most staff feel neutral.

4. Survivorship bias

Survivorship bias results when we consider only surviving (i.e., existing) observations and fail to consider all other potential observations. This may result from focusing in on only the successes of an evaluation but ignoring the failures or roadblocks that built the foundation for said success. That is, we may be prone to focus on people that start and finish a program, but neglect information from those that did not start or complete a program. Results would therefore reflect the thoughts and opinions of those completing a program, and potentially miss critical information on why people did not complete a program. 

Key points:

  • Reliance on existing data, “the survivors”, at the expense of other data (e.g., historical data, attrition data, etc.)

  • Generally, overemphasizes positive outcomes over negative or null outcomes

Example: You could administer a survey to participants of a physical fitness and healthy eating program to gauge their engagement and satisfaction with the program. You may find that these participants are engaged and satisfied with the program, but the data fails to capture the participants that started and did not complete the program. There may be underlying reasons as to why they did not complete the program, which could provide insight into how to improve the program to reach more people in the future.

5. Recall bias

Our recollection of past experiences diminishes over time. This results in inaccuracies when recalling past experiences. The longer the time between an experience and when an individual is asked about said experience, the more likely those recollections will be inaccurate, influenced by current events and experiences.

Key points:

  • Everyone forgets details of past experiences over time

  • Longer durations between experiences and recollection, the greater the likelihood to misremember specific details

Example: You wrap with a mental health initiative for seniors with mild depression and conduct follow-up interviews with the participants. Immediately after the program conclusion, participants provide more detailed accounts of their experiences. However, six-months down the road, you interview these same participants. They may have vague impressions of the program but are no longer able to provide concrete details of their experience of the program.


Avoiding sampling biases

Sampling biases will always be present during the data collection process and, oftentimes, multiple biases will be present. The goal is to eliminate which bias we can and reduce the rest. Here are a few steps to reduce bias in your next evaluation:

  • If in doubt, try to sample more people than you think you need. For minimum estimates, consider using a sample size calculator.

  • Use random sampling protocols. Random samples improve the likelihood of capturing a sample representative of your population of interest.

    • You may also consider maximum variation sampling to avoid sampling the same homogenous groups and better capture underrepresented or marginalized groups.

  • Keep your surveys and interviews concise and accessible. People are more likely to participate if the barrier for participation is low.

  • Follow up with non-responders to increase the robustness of your data. If you are still having trouble getting responses, consider providing incentives for non-respondents.

Written by cplysy · Categorized: evalacademy

Nov 27 2022

Developing a Logic Model – Check out our templates!

This article is rated as:

Eval is my main role EA Traffic Light.jpg

I do some eval EA Traffic Light.jpg

I'm new to eval EA Traffic Light.jpg


New Template: Developing a Logic Model

Eval Academy has just released a new template, “Developing a Logic Model”.

  • Who’s it for?

    • Whether you’re new to evaluation or if evaluation is your main role, this template is for anyone who wants to develop a Logic Model.

  • What’s the purpose?

    • This template can be used to develop and create your own Logic Model for any type of intervention.

  • What’s included?

    • The template offers an overview of what a Logic Model is and provides a step-by-step process using facilitating questions for developing your own.

    • It also includes a blank, colour-coded template that can be personalized and modified to your needs.


Learn more: related articles and links

You can learn more about Logic Models on Eval Academy through the following links:

  • The definition of Logic Models

  • Differences between Theory of Change, Log Frames, Results Frameworks and Logic Models – what are they and when to use them

  • Improve Your Logic Model Using 3 Simple Design Principles

You can also find many other templates in our list of resources to support you in planning and implementing an evaluation. Some of our most popular templates include:

  • Theory of Change Template

  • Evaluation Plan Template

  • Evaluation Kick-Off Meeting Template


Have you used any of our templates? Let us know what you think, and which one is your favourite!

Written by cplysy · Categorized: evalacademy

Nov 27 2022

How evaluation has changed the world

This article is rated as:

Eval is my main role EA Traffic Light.jpg

I do some eval EA Traffic Light.jpg

I'm new to eval EA Traffic Light.jpg


As an evaluator, I’m passionate about making sure evaluation results actually get used. Too many times have I seen evaluations take place as just a tick-box activity or to meet a funding requirement.

Whether it’s by building capacity through the evaluation process or by developing realistic, actionable recommendations, evaluation plays an important part in making a difference on both a small and a grand scale! We see evaluation changing the world by providing direction for program or organizational improvement (e.g., by showing success and failure), demonstrating value and need, and by uncovering credible, reliable knowledge of how change happens to support learning and decision-making.

Through our sister company, Three Hive Consulting, we support healthcare and non-profit organizations to achieve their mission by uncovering insights that drive impact through our three-staged evaluation approach. 

  1. Understand: we collaboratively define who needs to know what, when, and how we will collect, analyze, and report on the necessary information

  2. Uncover: guided by the evaluation plan developed in step 1, we collect data to provide answers to the evaluation questions

  3. Utilize: we put the information to work by presenting the data in ways most useful and appropriate for our clients and their audiences

Through these steps, here are just a few ways evaluation has helped change the world.


Human trafficking:

Human trafficking is a serious and complex crime that exploits people of all ages and genders. Data are difficult to report in human trafficking because it is a hidden crime –victims often don’t realize they are being trafficked and/or are afraid to report their traffickers. Despite this, human trafficking is one of the fastest-growing crimes in Canada, and reports are rising in Alberta.

In 2021, Three Hive began an ongoing evaluation to understand the impact of Alberta’s regionalized approach to combat human trafficking and provide support to victims. By comparing the two different models used in Northern and Southern Alberta, the evaluation helped to uncover enablers and barriers, and reviewed the role of the Safety Network Coordinator (SNC) in responding appropriately and promptly to the needs of victims. The evaluation included interviews with team members, pulse surveys with advisory circles and the core project team, and a document review.

The evaluation found that after a year of the SNC being operationalized, 90 victims of human trafficking have been supported. The evaluation work was able to highlight the success of this role while describing critical success factors and areas for improvement. Overall, ensuring that the SNC role continues is an important goal for Northern and Southern Alberta teams. Both teams identified several opportunities to improve supports provided to victims of human trafficking, including mental health supports that specialize in trauma, housing availability with wrap-around services, and making further inroads into rural Alberta.

On October 2, 2022, it was announced that the Alberta government is committing $20.8 million in new funds over the next four years to implement the Alberta Human Trafficking Task Force’s five recommendations to step up the fight against human trafficking. 

The funding will:

  • Establish and implement an Office to Combat Trafficking in Persons and a centre of excellence for research and data collection.

  • Support a new grant for coordinated community support and Indigenous-led and culturally appropriate services.

  • Fund civilian positions through the Alberta Law Enforcement Response Teams whose roles would be focused on supporting victims and survivors throughout the investigation process.

  • Collaboratively implement other related task force recommendations.

The third point about a “civilian position” indicates that the SNC role will be sustained.

You can read more about this story here!


Communities United

Communities United (CU) was a collaborative, community development initiative in Northeast Edmonton with an overt poverty reduction message. It was a multiyear initiative with a broad mandate, pulling together community stakeholders to collaboratively support and build initiatives and make the most of each partner’s strengths and resources. 

In 2019-2020, CU worked with Three Hive on an evaluation report. As a result of a recommendation from a Three Hive evaluation, CU created an impact and lessons learned report, as well as a Theory of Change. These outputs are an attempt to mobilize knowledge and share what was achieved, highlight what was learned, and inspire others to utilize some of the strategies and approaches listed to contribute to the reduction of poverty. 

You can read more about this here!


EndPovertyEdmonton

EndPovertyEdmonton (EPE) is a broker organization that brings together existing charities, social services, the private sector, and government agencies to identify how different groups can work together to tackle broader social problems. In 2016, Edmonton City Council approved funding for the launch of EndPovertyEdmonton to steward the vision of eliminating poverty in a generation. To achieve this vision, EPE adopted a modified Collective Impact approach to address the complex challenge of ending poverty and guide how EPE partners work together.  

Following on from a previous evaluation by the City of Edmonton in 2018, Three Hive completed an evaluation in 2022 to measure the advancement of EPE on the Collective Impact conditions, as well as equity. The evaluation included a Group member online survey, interviews, focus group discussions, and document review. The evaluation found that EPE has achieved many successes in the past three years and has made progress in some aspects of Collective Impact efforts. However, some issues have persisted such as employees’ lack of understanding of EPE’s overall goals and how their work fits in, as well as concerns around governance and leadership. EPE’s long-term systemic goal of ending poverty in a generation is also difficult to measure.

A story about EPE appeared in the online edition of the Edmonton Journal on September 21, 2022, regarding a review of EPE’s funding by the Edmonton City Council. Council increased funding for the agency in the fall of 2021 but withheld $600,000 pending a review set for the end of September 2022. The Edmonton Journal article discusses the 2018 evaluation, as well as the Three Hive evaluation, and how evidence from these evaluations will help to guide the discussion around EPE’s strengths and limitations, and fundamentally help to determine whether withheld funds will be released. 

You can read more about this story here!


Do you have an example of how evaluation has helped to change the world? Let us know in the comments!

Written by cplysy · Categorized: evalacademy

Nov 27 2022

The people who saved evaluation comics.

Since 2011 I have drawn thousands of comics. But over the last 11 years there were a few times when I almost quit. What saved the cartoons? Scratch that, who saved them? Read on to find out.

You’ll find my comics scattered across the web, on office bulletin boards, in university lecture slides, at conference presentations, and even within a handful of prominent textbooks. While I make most of my income as a graphic, web, and data designer these days, most evaluators know me first and foremost as “the evaluation cartoonist.”

But even with all the positive feedback there were quite a few times when I almost quit cartooning entirely.

Times when I almost quit cartooning.

1. When I started teaching data visualization design.

Back in the middle part of the 2010s I was a full time employee, a father to a preschooler, a blogger, and a cartoonist. Then I decided to start teaching an online data visualization design workshop. Something was going to have to give.

From my post, “What is diydatadeisgn?”

2. When I started my indie business.

It was 2016 when I started this business the first time. Were the cartoons essential to starting my consulting practice?

Drew this one as part of The Gig Economy Business Plan

3. During my family’s hell year.

At the beginning of 2017 we lost my healthy father-in-law out of the blue to a rare condition called CJD. At the end of 2017 we lost my not-nearly-as-healthy father to a sudden heart attack. Both events took a heavy toll on myself and my family. Honestly, I’m still recovering.

A cartoon I drew as part of my cartoon obituary for my father.

4. When my business collapsed.

In early 2018 I “closed” my blog. I came back months later. And then in late 2018, I took a new full time job.

From the post, “A few lessons learned as I close down my business.“

5. When I lost my job.

I was laid off in the middle of 2019. I saw it coming but it still felt like a punch in the gut. This was the moment that I lost all faith in the idea that a traditional full time position offered the stability I didn’t have when I was indie.

From the I lost my job blog post I wrote.

6. All those times in between, when I was just too overwhelmed.

I am an introvert with ADHD who faces regular bouts of depression and anxiety. Consistency is my struggle as my brain often pulls me in different directions or simply decides to shut down.

So why do I still cartoon?

I love that people read this blog. I enjoy when people like or comment on my social media posts. I like hearing from fans of my work or seeing the cartoons in prominent places.

But that wouldn’t be enough to keep me going.

In fact, I am almost certain that if not for this one thing the comics would have stopped years ago.

My Patrons Saved My Evaluation Comics

If you like my comics and have used any over the years in your presentations, lectures, or social media posts you have my patrons to thank.

The Patreon part of my business is not a huge money maker. It’s really just a small part of my income. But there is something behind the idea that people have been contributing real money towards my comics that makes it feel so much larger.

Their support over the years has taken me through every one of those times when everything seemed to be falling apart. All in all, 133 people have supported my comics at one point or another since I joined Patreon in 2014. My current count is 53.

Knowing they are there, supporting my work, brings me back even when times are hard. This post isn’t just a plug for you to join us on Patreon. It’s a time tested truth.

Re-inspired to Create

Back in the early summer I was really trying to post comics continuously, my goal was every single day. But then I burnt out and needed a break.

Over the last few weeks I’ve been cartooning again, although I haven’t shared much. This time I’m setting a personal goal to post 3 new cartoons a week for at least the next 6 months (Mondays, Wednesdays, and Thursdays).

Spinning off my comics to their own site.

Comics will still very much be a part of how I illustrate my blog here at freshspectrum. But I also wanted to create a comics-only place for when you just want to scroll through the cartoons. So that’s where evaluationcomics.com comes in.

All new cartoons I post will end up on the new site.

  • The current year’s cartoons will be freely available for everyone to read.
  • The complete archives will only be available to Patrons.
  • It only takes the minimum Patreon level ($2 a month) to unlock the archives.

So, Join Us!

The freshspectrum patreon community is filled with the kind of people who enjoy evaluation comics. Are you one of us?

If yes, becoming a freshspectrum Patron is the best way for you to support evaluation comics and keep me creating on a regular basis.

Join us on Patreon!

Written by cplysy · Categorized: freshspectrum

Nov 27 2022

The result chain: a beginner’s guide

Monitoring and Evaluation is about measuring and tracking results. That is why it is important to understand what results are, and how to distinguish between different levels of the results chain. In general, a “result” is something that happens or exists because of something else that has happened: the results of a football game the final value of a mathematical calculation, or the outcomes of an election. In development and governance, […]

The post The result chain: a beginner’s guide appeared first on Dr. Thomas Winderl.

Written by cplysy · Categorized: thomaswinderl

  • « Go to Previous Page
  • Go to page 1
  • Interim pages omitted …
  • Go to page 110
  • Go to page 111
  • Go to page 112
  • Go to page 113
  • Go to page 114
  • Interim pages omitted …
  • Go to page 304
  • Go to Next Page »

Footer

Follow our Work

The easiest way to stay connected to our work is to join our newsletter. You’ll get updates on projects, learn about new events, and hear stories from those evaluators whom the field continues to actively exclude and erase.

Get Updates

Want to take further action or join a pod? Click here to learn more.

Copyright © 2026 · The May 13 Group · Log in

en English
af Afrikaanssq Shqipam አማርኛar العربيةhy Հայերենaz Azərbaycan dilieu Euskarabe Беларуская моваbn বাংলাbs Bosanskibg Българскиca Catalàceb Cebuanony Chichewazh-CN 简体中文zh-TW 繁體中文co Corsuhr Hrvatskics Čeština‎da Dansknl Nederlandsen Englisheo Esperantoet Eestitl Filipinofi Suomifr Françaisfy Fryskgl Galegoka ქართულიde Deutschel Ελληνικάgu ગુજરાતીht Kreyol ayisyenha Harshen Hausahaw Ōlelo Hawaiʻiiw עִבְרִיתhi हिन्दीhmn Hmonghu Magyaris Íslenskaig Igboid Bahasa Indonesiaga Gaeilgeit Italianoja 日本語jw Basa Jawakn ಕನ್ನಡkk Қазақ тіліkm ភាសាខ្មែរko 한국어ku كوردی‎ky Кыргызчаlo ພາສາລາວla Latinlv Latviešu valodalt Lietuvių kalbalb Lëtzebuergeschmk Македонски јазикmg Malagasyms Bahasa Melayuml മലയാളംmt Maltesemi Te Reo Māorimr मराठीmn Монголmy ဗမာစာne नेपालीno Norsk bokmålps پښتوfa فارسیpl Polskipt Portuguêspa ਪੰਜਾਬੀro Românăru Русскийsm Samoangd Gàidhligsr Српски језикst Sesothosn Shonasd سنڌيsi සිංහලsk Slovenčinasl Slovenščinaso Afsoomaalies Españolsu Basa Sundasw Kiswahilisv Svenskatg Тоҷикӣta தமிழ்te తెలుగుth ไทยtr Türkçeuk Українськаur اردوuz O‘zbekchavi Tiếng Việtcy Cymraegxh isiXhosayi יידישyo Yorùbázu Zulu