• Skip to main content
  • Skip to footer
  • Home

The May 13 Group

the next day for evaluation

  • Get Involved
  • Our Work
  • About Us
You are here: Home / Archives for cplysy

cplysy

Jan 14 2022

Grab the cake, it’s time for a data party! Benefits of and how to run your own

So you’ve successfully gathered the data you need to evaluate your program. But how do you engage stakeholders and partners to ensure a thorough understanding of the results? A data party could be part of the answer!


What is a data party?

A data party is a gathering that allows stakeholders to increase their understanding of findings and provide input into data sense-making. A data party is a process of participatory data analysis with program stakeholders. During a data party, stakeholders come together to interact with and interpret the data and provide input into final conclusions and recommendations. This process often leads to different views and perspectives of the results to be discussed.  


Why host a data party?

A data party promotes a culture of participation and collaborative data interpretation. Often, evaluators collect, analyze, and interpret evaluation data with minimal program staff and program service recipients’ involvement, which can lead to gaps in the interpretation and a missed opportunity to gain their insights on the main findings. A data party addresses this gap and involves program staff and service recipients in interpretation and sense-making.  

One way of increasing stakeholder and community participation is through collaborative data interpretation. In program evaluation, it is difficult to implement a true participatory method as most projects have a limited timeline and budget for evaluation. A data party provides an opportunity for engagement to groups that are often left out of discussions.  

Engaging stakeholders in data interpretation enhances the acceptance of the evaluation findings and recommendations. It also provides context and expertise that the evaluator may be missing and helps to ensure the evaluator’s interpretation and resulting recommendations are appropriate and feasible. A data party creates a platform to combine specific data points with personal experience and helps to better explain challenges in programs (e.g., where and why programs are falling short). The discussion during the event empowers stakeholders, provides a learning opportunity, and enhances engagement.  


How to successfully throw a data party

Like all other parties, each data party is unique. There are many ways to organize a successful data party depending on the project context, the type of available data and the stakeholder groups. We’ve included a few points below to get you started.

1. Purpose

Clearly stating the objectives of the data party will shape the event and will make planning easier. Identifying the purpose will determine the content of data presented, and the discussion questions.  

2. Invitation

Identify the different stakeholder groups you want to involve and the number of participants from each group. Having a clearly stated purpose can support this. Offer support so that all stakeholder groups, including program service recipients, can attend (e.g., cover travel costs, and if necessary, offer translation services, etc.)  

 3. Venue

Depending on what’s convenient within the project context, it can be organized in person or online. If it is virtual, provide the dataset or summaries in advance to ensure all participants have access.  

4. Timing

The ideal time to organize a data party is after you have collected and analyzed all the evaluation data and before you draft the final report. When scheduling, consider the availability of all participants.  

A data party can take several hours depending on the complexity and size of the evaluation. Since understanding and sense making of the data takes a bit of time, it is important to allocate sufficient time to give participants a chance to review the data completely and get the dialogue flowing across diverse perspectives. In a small project, a data party may be just 1-2 hours. For more complex projects with lots of data, your party may take 3 hours or more. 

5. Mix it up

If you have a large group of participants (more than 8), use break-out rooms to organize them into smaller sub-groups (4-5). Mix stakeholder types in each sub-group to promote the exchange of different perspectives. Have an evaluation team member facilitate the discussion and take notes for each sub-group.    

6. Data

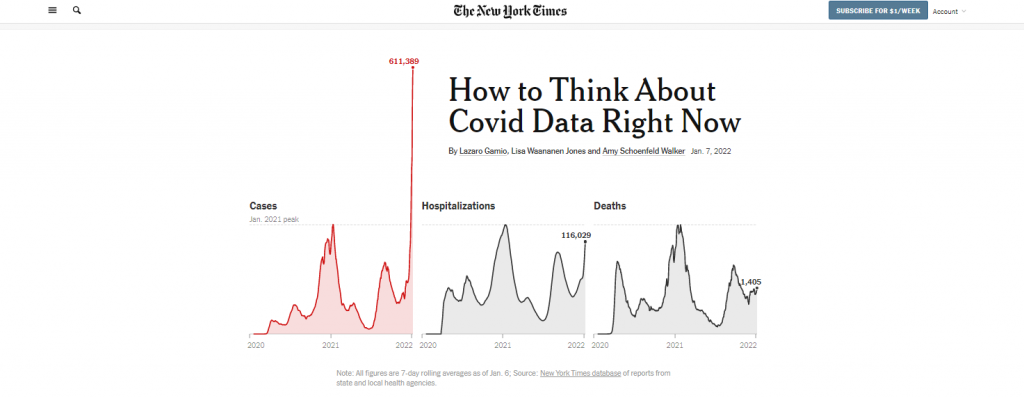
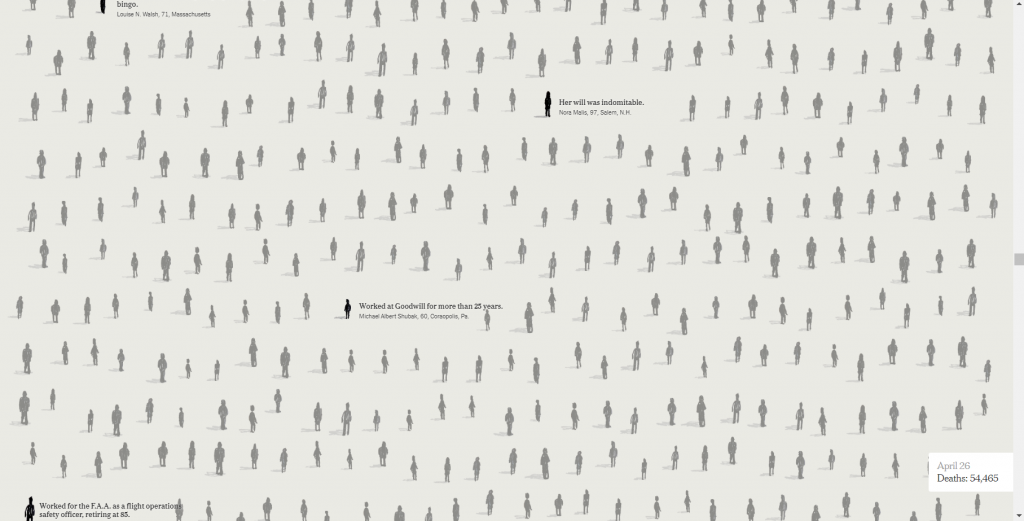
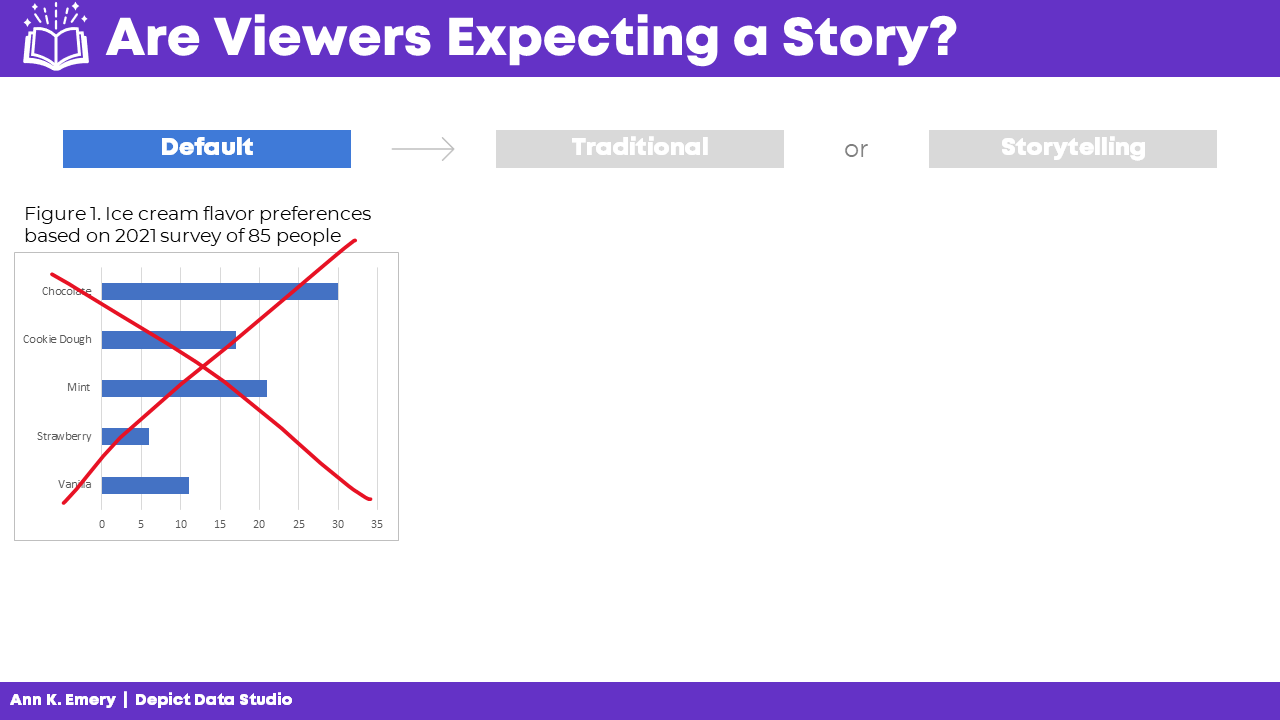
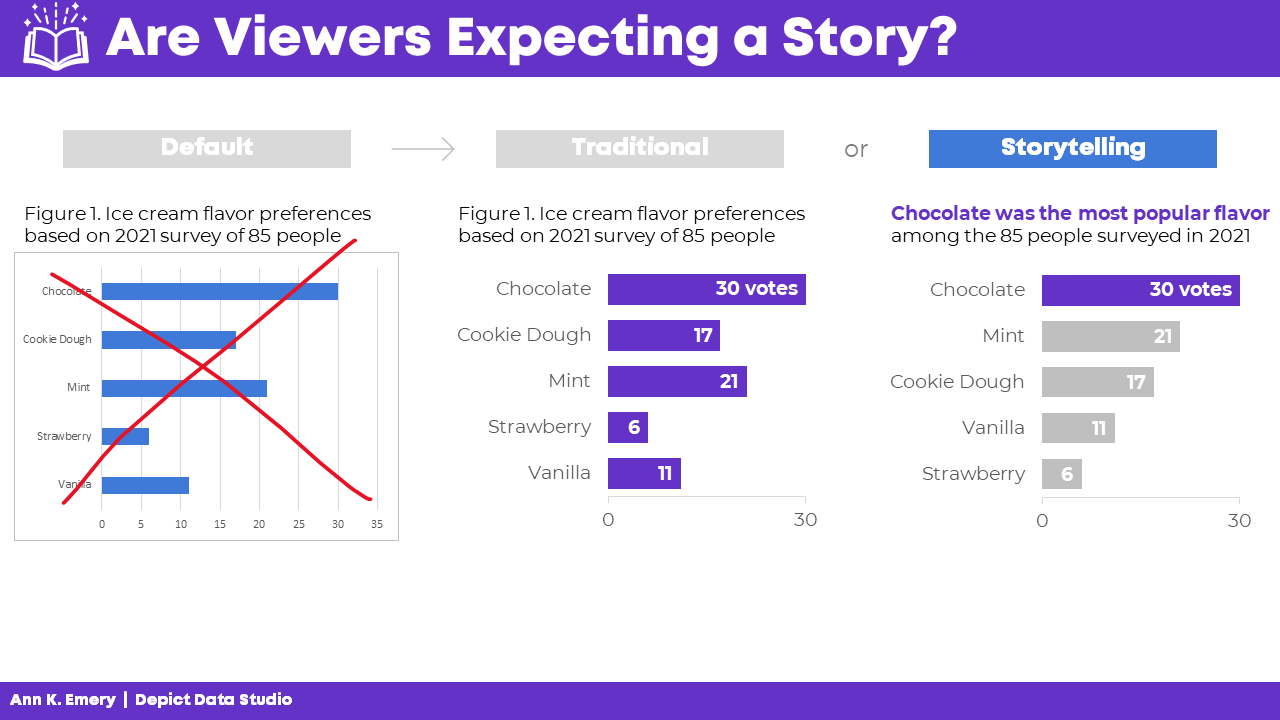
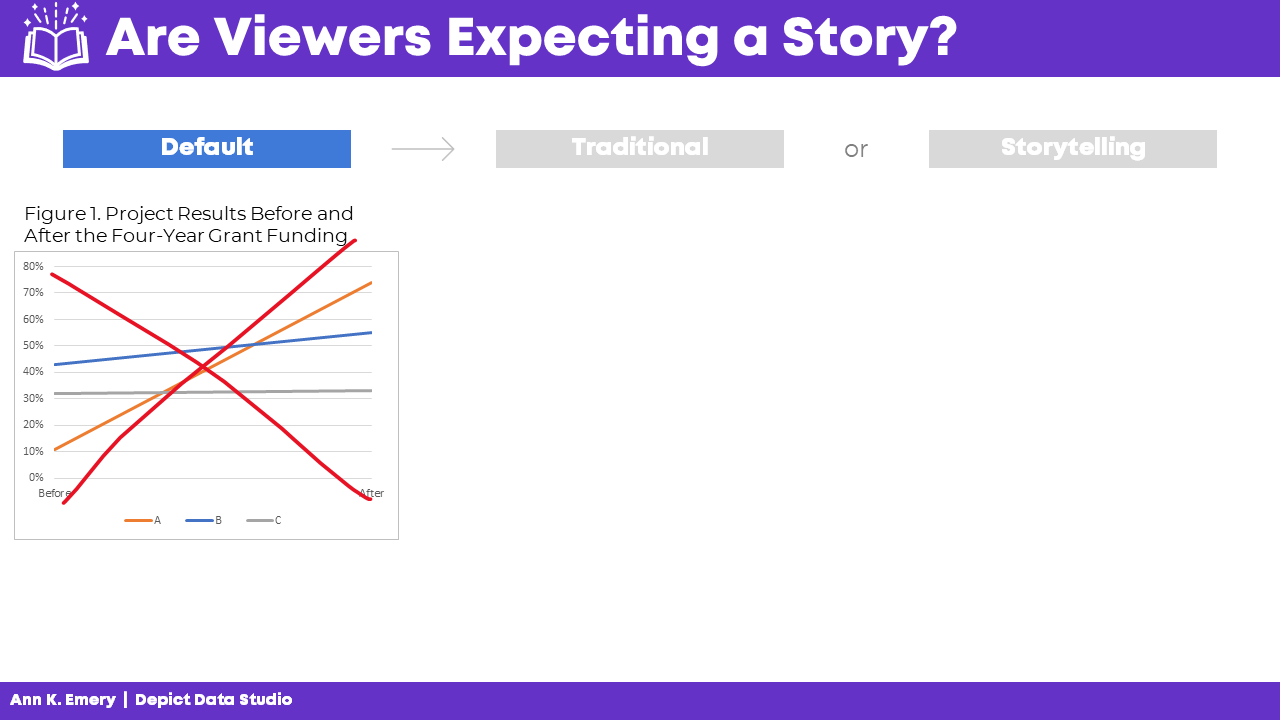
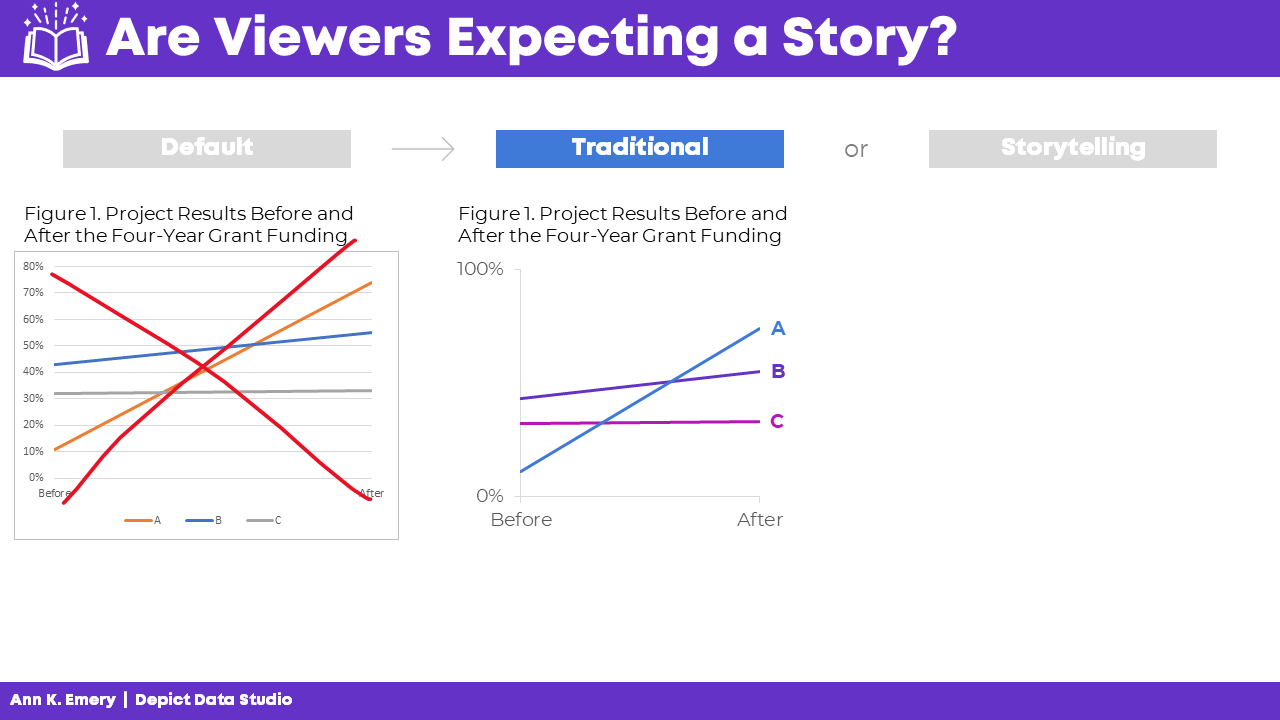
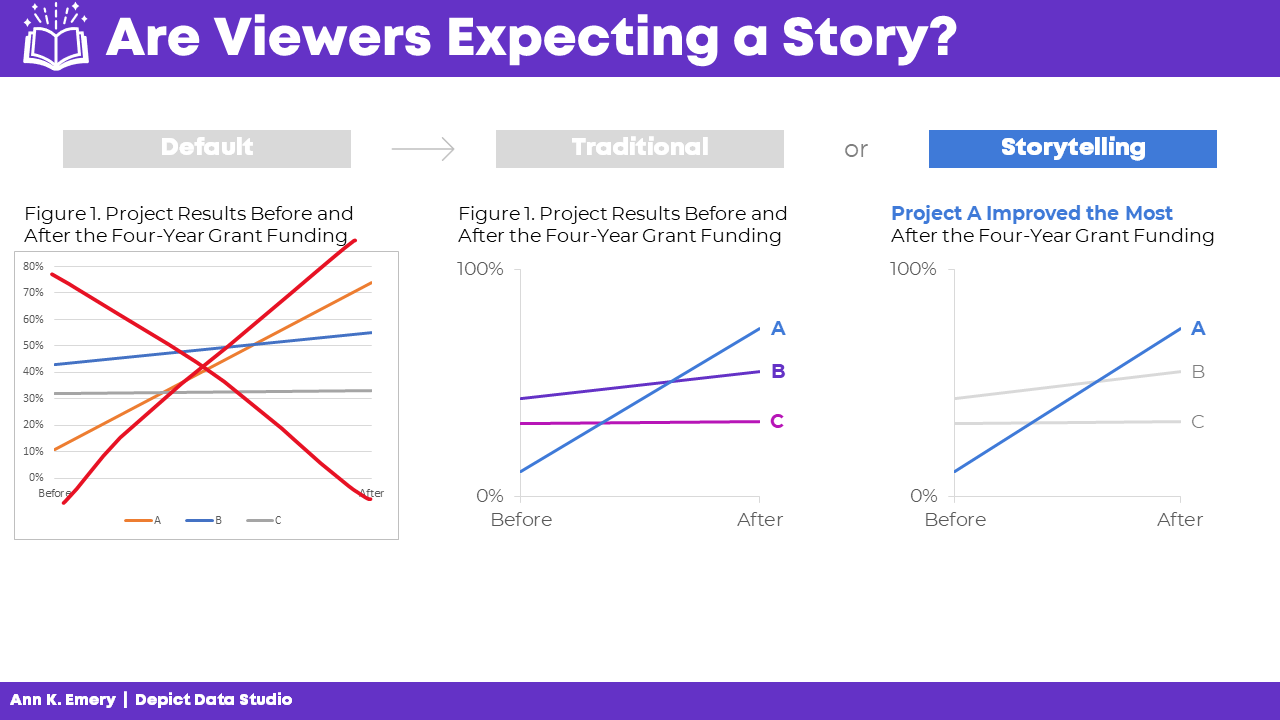
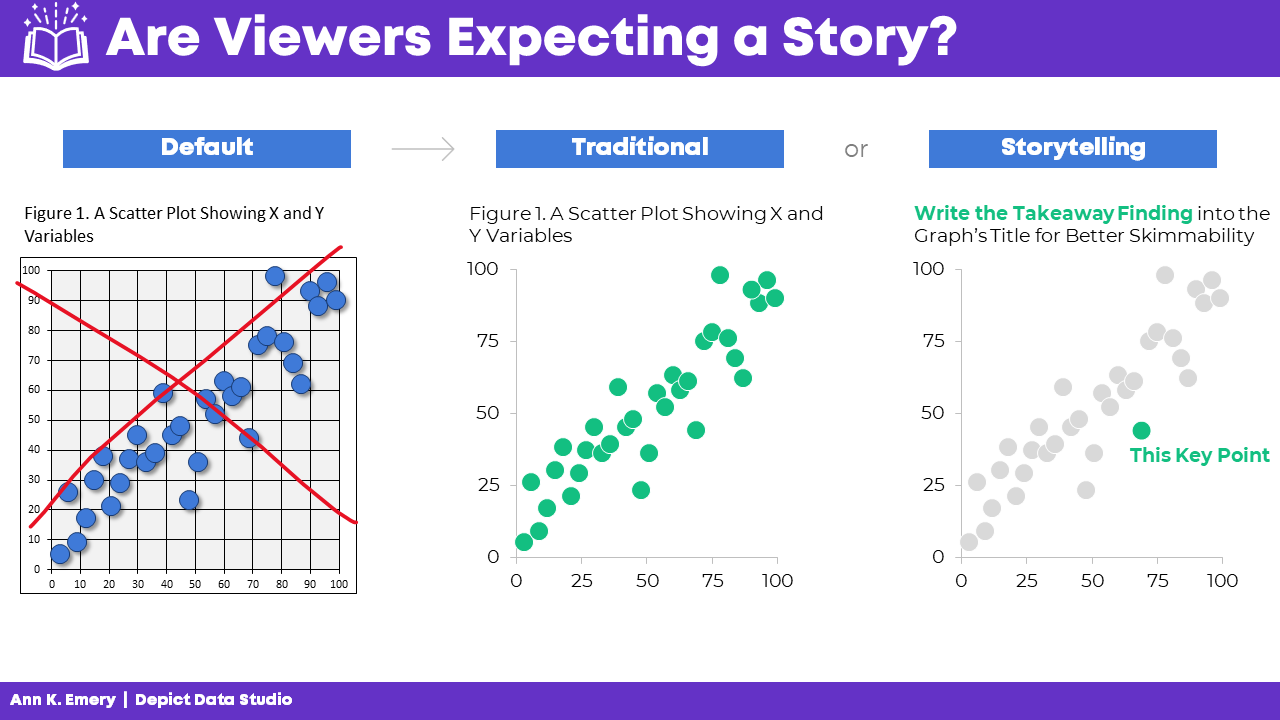
Including the right data is critical for the success of a data party, so select your content carefully while considering the purpose of the event (e.g., data that needs verifying, outliers, etc.). Provide accessible information and prepare the findings in a way that is easily understood by all stakeholder groups for meaningful participation. Use various approaches to share the main findings to keep participants engaged (e.g., posters – where participants walk around the room in groups and look at data; data placemat – a document showing quantitative and qualitative data using visuals, graphs, word clouds etc.).  

7. Probe

If stakeholders disagree, probe and inquire to gather as much context to clarify how they have understood the data and where they are coming from. The purpose is to co-create meaning and explore new ways of looking at things, not to gather support for existing interpretations.  

8. Discussion Questions

Prepare questions in advance and facilitate the discussion within each sub-group. Sample discussion questions include:  

  • What is the data telling you about (insert topic)? 

  • What stands out for you? Are there any surprises? 

  • What would you be interested to explore and/or discuss further?  

  • What is missing in the data that you thought you would see?  

  • What actions would you take as a result of these findings? 

If you have draft recommendations as a result of your analysis you would like to discuss with stakeholders, consider the following questions:  

  • What response do you think is required here?  

  • How viable are these recommendations? 

  • Which feel most doable? 

  • How might we best communicate these findings to decision-makers? 

9. Reporting

Don’t forget to write about your data party in your report – highlight your approach in the methods section, and in the results and recommendation sections don’t forget to credit ideas to stakeholders (you can use call-out boxes to distinguish findings).   

10. Fun

Try to make your data party fun and engaging.  Some ideas include offering food (can we suggest cake?) setting an energetic tone by designing a cool invitation, starting the event with a short but fun icebreaker, and sharing the evaluation findings in a creative way (also maybe with cake!). 


Have you organized a data party? How did it go?  Let us know your experience in the comments.  


Sign up for our newsletter

We’ll let you know about our new content, and curate the best new evaluation resources from around the web!


We respect your privacy.

Thank you!


Written by cplysy · Categorized: evalacademy

Jan 13 2022

Inform, Engage, Inspire, with data visualization.

Are you the kind of person who likes to nitpick other people’s charts?

I’m really not.

I wasn’t there when they decided to use that chart. I don’t know what factored into their decision. As far as their intended audience, I don’t know if anybody actually cares what chart gets chosen. So when a conversation among data folk about a chart pops up on social media, I usually stay out of it (unless it’s funny, or intentionally misleading, or I’m super bored).

Cartoon by Chris Lysy of freshspectrum.com
"How to Identify a data visualization expert."
Person holding up a photo of a 3D pie chart. He asks, "so how does this picture make you feel?"
Two people at the table.
Person one says, "Neutral, it's just a chart. Who really cares?"
Person two says, "I feel really angry and personally attacked right now. 3D, how dare you sir!!"

But last week, right around the time I was posting my blog post on tailoring your reports based on interest level, there was one of those conversations about a chart published by the NY Times.

This week I want to talk about that chart and a few others, not to nitpick, but because they are good examples to highlight the differences between Engage style data visualizations and Inform style data visualizations.

Quick Recap: Inform, Engage, Inspire

Cartoon by Chris Lysy of Freshspectrum.com
Audience Interest Level Spectrum
High Interest, Medium Interest, Low Interest.  
The High Interest person says "Give me ALL the data."
The Medium Interest person says, "Okay, I'm listening, what you got?"
The Low interest person says, "I'm sorry. Did you say something?"

Your audiences’ interest levels in the data that you are sharing vary WIDELY (unless nobody cares, in which case they don’t vary at all).

Some audiences care a lot about the data you are trying to share. For those people, your goal should be to INFORM. When someone is already super engaged and looking for specific answers, they just need the data. Your job is to give them the data and get out of their way.

Some audiences care enough about the topic to be mildly interested in what you have to say. But you have to pique their curiosity to get them to stay with you. In these times your goal should be to ENGAGE.

Finally, some audiences are not even mildly interested. If we have any shot at getting them interested, we need to INSPIRE.

The Spiral Graph

So last week, at the top of a New York Times guest essay there was a spiral graph.

This was an out of the ordinary way to report time series data.

A spiral graph showing Covid-19 cases from January 2020 to January 2022.  Created by the NY Times for the article Here's when we expect Omicron to peak"
Chart from NYTimes -> “Here’s When We Expect Omicron to Peak”

And when something is different in a major publication known for its high quality visualizations, data people talk. Right after it was published I started to see multiple social media conversations and a string of blog posts discussing the merits of this particular chart.

Maybe alluding to seasonality? What are your thoughts? https://t.co/5OSQWJOEMA

— Amanda Makulec MPH (@abmakulec) January 6, 2022

The Spiral Graph is an ENGAGE Chart

If we’re just talking straight up minimalist well designed data communication, the spiral graph is not it.

But let’s talk about context:

  • This chart is just a lead-in illustration to an Opinion piece.
  • It’s not even the only chart in the essay, there is another that plays more of an inform role.
  • The NY Times has created and shared MANY other Coronavirus visualizations over the last couple of years.

What the spiral graph does well is attempt to change the way we look at data we have come to know all too well.

In just about every usual chart we see in the modern digital world, the width of the chart is dependent on the device we are using to read the article. That width stays fixed, as days go and more data gets added, the chart stays the same width.

By spiraling the chart, you get to show something about the length of the pandemic that you wouldn’t be able to show in the standard line graph. You get to make the chart longer, without forcing a scroll by the reader. And ultimately, it’s strange enough to pique curiosity.

Cartoon by Chris Lysy of freshspectrum.com
Person presenting says, "So before we dive in, I thought I would start with a little story."
Someone asks, "Could you move to the side? You're blocking the chart."
Second someone asks, "Did you bring data tables with you?"

For an INFORM graph check out the NY Times Case Count page.

If you want an INFORM style graph head over to the NY Times case count page. This data presentation is phenomenal as a dashboard style information sharing device.

The goal with this kind of graphic is to give the data and get out of the way. I can’t tell you how many times in the last couple of years I have turned to the NY Times to get informed about the current state of the Coronavirus, but it’s been a lot.

New York Times Coronavirus in the US Case Count screen shot.
NY Times Case Count page as seen on January 13, 2022.

The simple line graph delivers the information on case waves almost effortlessly. Add in that it is interactive, provides analysis, and is followed up by collections of supporting graphs that provide other key metrics and break the data down by important categories like age and state.

But no matter how amazing the delivery, if you keep repeating the same graphic it gets stale. And considering this page lives in parallel to the far more short lived opinion essay, you can’t just use the same charts if your goal is entice readers to read on.

Another example of a NY Times ENGAGE graph.

Okay, so there are certainly ways to make an inform style graph a little more engaging without making it really odd.

Check out the leading graph in this piece that was put out on Friday January, 7. The Omicron case wave is so big in the US that it jumps out of the normal bounds of the graphic into the header space.

In a usual NY Times article, the article title would be centered and the chart would not start until after the by line. But in this case, they let the chart extend to the top of the page. And they actually shifted the whole title off to the right of center so that the line could fit.

Why could they do that? Well the Covid wave peaked so much that the chart was naturally unbalanced. So instead of just shifting everything down as normal, they let the wild peak break their formatting structure.

Screenshot of the top of the New York Times article, "How to Think about Covid data right now."
“How to Think About Covid Data Right Now”

Okay, what about an INSPIRE graph?

So we’ll stick with the NY Times because I found a good one.

To INSPIRE with data visualization, we usually have to tell some kind of story. And it needs to be a big story, a major idea or moment in time.

The following is a snapshot from an interactive visualization put out by the NY Times in May of 2020, just as the US reached a COVID death toll of 100,000. For this moment in time the Times was trying to connect the big number to the thing it represented…Human Lives.

So instead of a chart, we have lots of little people silhouettes, some annotated with names and little obituaries. The The page is a scroller, and it takes time to go through. As you scroll down the date changes and the number of deaths increase. Little bits of story also find their way into the visualization.

Screenshot from the New York Times interactive called "An Incalculable Loss"
“An Incalculable Loss” the NY Times interactive when the US Death Toll reached 100,000 at the end of May in 2020

This isn’t the way you simply inform a data hungry audience of the numbers. It’s also not just a simple engaging graphic designed to pique interest that will lead a reader forward.

This is the kind of data visualization that tries to connect with human emotion. To convey a big idea and leave a lasting impression.

So what do you think?

Have you ever created a graph or other visualization just to pique interest?

See any examples from within your own domains of expertise that could fall in any of these three buckets?

If so, would love to hear about them. Write me a comment, I most certainly read the comments and try to respond to every single one.

Written by cplysy · Categorized: freshspectrum

Jan 12 2022

Your Staff Knows Your Programs Better Than You

You know your community better than your funder, and your programs are only successful when staff feel supported and have the capacity to do their jobs. Your staff knows your programs so much in fact, that when you report to your board of directors or engage new funders, you rely heavily on them to provide […]

The post Your Staff Knows Your Programs Better Than You appeared first on Nicole Clark Consulting.

Written by cplysy · Categorized: nicoleclark

Jan 12 2022

Reflecting and Imagining: What’s Ahead in 2022

Read reflections from 2021 and learn what’s ahead for Elizabeth Grim Consulting, LLC in 2022 with evaluation and data coaching, training, and speaking.

The post Reflecting and Imagining: What’s Ahead in 2022 appeared first on Elizabeth Grim Consulting, LLC.

Written by cplysy · Categorized: elizabethgrim

Jan 11 2022

Are Viewers Expecting a Story? Lightning Talk from the DATAcated Expo

Never, ever keep the default settings.

That was the overarching theme of my Lightning Talk at the DATAcated Expo, which was held virtually in October 2021.

You’re not going to keep the ugly, outdated defaults. Great!

But what should you do instead?

And how do you modify a graph so that it’s just right for your audience?

Surely a group of scientists will need something different from a group of policymakers.

Some audiences adore data. Others don’t.

Some audiences have plenty of time. Others don’t.

In this blog post, you’ll learn about:

  • the differences between default, traditional, and storytelling graphs;
  • which techniques can help you tell a story with data (e.g., dark colors); and
  • when to use each type of graph.

Watch the DATAcated Expo Lighting Talk

Missed the live event?

Watch the Lightning Talk here.

This is a 17-minute video. If you’re short on time, just watch a 10-minute segment — minutes 2 through 12 of the video.

Here’s a summary of what’s inside.

Defining the Term “Data Storytelling”

This is a tricky term with lots of definitions.

Some people love this term.

Others hate it.

In the recording, you’ll see me ask the attendees to share what “data storytelling” means to them.

You might define data storytelling as:

  • “What does data really mean, and what do you want it to tell.” — an Expo attendee
  • “Translating data for non-data centric users.” — an Expo attendee

And data storytelling is NOT:

  • Fiction
  • Making things up
  • Biasing our audience
  • Fudging the numbers

Data Storytelling in a Bar Chart

In the Lightning Talk, I showed attendees three versions of the same graph: default, traditional, and storytelling.

We’ll look at each of these side by side, so that you can see how they’re similar and how they’re different.

At the end, I’ll ask you to comment and share which style you think each of your audiences need.

The Default Bar Chart

We never, ever keep the default settings.

The Traditional Bar Chart

Instead, at a bare minimum, we need to design a traditional graph.

We would:

  • Enlarge the font
  • Enlarge the bars (by decreasing the gap width)
  • Remove the border
  • Add labels (optional—if we think our audiences would want specificity)
  • Adjust the scale
  • Use brand colors
  • Use brand fonts

It’s up to the viewers to read the chart and figure out the “so what?” for themselves.

The Storytelling Bar Chart

Sometimes, our audiences prefer storytelling graphs.

You already spent 60 seconds cleaning up the default settings.

In another 60 seconds of editing, we would:

  • Sort the bars (e.g., greatest to least)
  • Gray everything out
  • Highlight one takeaway finding with a dark color
  • Add the takeaway finding to the graph title
  • Bold a few key words to make the title even more skimmable

Data Storytelling in a Slope Chart

You can apply these principles to any and all chart types.

Here’s what the three different styles look like in a slope chart.

(A slope chart is just a fancy name for a line chart that has exactly two points in time.)

The Default Slope Chart

Defaults are for 2005.

We know better.

C’mon, Excel. And Tableau. And PowerBI. And and and.

The Traditional Slope Chart

At a bare minimum, we need to:

  • Enlarge the fonts
  • Adjust the scale
  • Remove the border
  • Add brand colors
  • Add brand fonts
  • Remove the legend and directly label the data

(Direct labels have three key advantages: They’re faster to read; they’re better for people who are colorblind; and they print better in grayscale.)

The Storytelling Slope Chart

Take the edited graph you just made, and keep going!

In a storytelling slope chart, we would:

  • Gray everything out
  • Highlight one thing at a time
  • Re-write the title and put the takeaway message in the title
  • Bonus points: Bold a few key words to make it even more skimmable

Which finding will you highlight in a darker color?

You might highlight:

  • The Success Story (Project A)
  • The Debbie Downer Story (Project C)

Be careful with red; in Western cultures, red means caution! warning! But colors are culturally-specific; in Eastern cultures, red doesn’t necessarily mean anything bad.

Data Storytelling in a Scatter Plot

We didn’t have time to discuss scatter plots at the DATAcated Expo, but I’d still like to share this example with you.

Here’s how data storytelling would be applied to a scatter plot.

Never keep the default settings!!!!!!!!!!

Traditional graphs are all one color and they have topical titles.

Storytelling graphs have a dark-light contrast and takeaway titles. For bonus points, you could label a few key points.

Data Storytelling in a Map

Finally, here’s how data storytelling would be applied to a choropleth map.

Never keep the default settings!!!!!!!!!!

In traditional maps, none of the colors stand out, and they have topical titles.

In storytelling maps, we’d add an intentional dark-light contrast and takeaway title. For bonus points, you could label a few key points.

When Should You Use Data Storytelling?

Comment below: When would you use each style?

Which of your audiences prefer traditional graphs?

Which of your audiences prefer storytelling graphs?

In the video, you’ll also hear the conference attendees share their perspectives, and you’ll hear from me, too.

Written by cplysy · Categorized: depictdatastudio

  • « Go to Previous Page
  • Go to page 1
  • Interim pages omitted …
  • Go to page 144
  • Go to page 145
  • Go to page 146
  • Go to page 147
  • Go to page 148
  • Interim pages omitted …
  • Go to page 304
  • Go to Next Page »

Footer

Follow our Work

The easiest way to stay connected to our work is to join our newsletter. You’ll get updates on projects, learn about new events, and hear stories from those evaluators whom the field continues to actively exclude and erase.

Get Updates

Want to take further action or join a pod? Click here to learn more.

Copyright © 2026 · The May 13 Group · Log in

en English
af Afrikaanssq Shqipam አማርኛar العربيةhy Հայերենaz Azərbaycan dilieu Euskarabe Беларуская моваbn বাংলাbs Bosanskibg Българскиca Catalàceb Cebuanony Chichewazh-CN 简体中文zh-TW 繁體中文co Corsuhr Hrvatskics Čeština‎da Dansknl Nederlandsen Englisheo Esperantoet Eestitl Filipinofi Suomifr Françaisfy Fryskgl Galegoka ქართულიde Deutschel Ελληνικάgu ગુજરાતીht Kreyol ayisyenha Harshen Hausahaw Ōlelo Hawaiʻiiw עִבְרִיתhi हिन्दीhmn Hmonghu Magyaris Íslenskaig Igboid Bahasa Indonesiaga Gaeilgeit Italianoja 日本語jw Basa Jawakn ಕನ್ನಡkk Қазақ тіліkm ភាសាខ្មែរko 한국어ku كوردی‎ky Кыргызчаlo ພາສາລາວla Latinlv Latviešu valodalt Lietuvių kalbalb Lëtzebuergeschmk Македонски јазикmg Malagasyms Bahasa Melayuml മലയാളംmt Maltesemi Te Reo Māorimr मराठीmn Монголmy ဗမာစာne नेपालीno Norsk bokmålps پښتوfa فارسیpl Polskipt Portuguêspa ਪੰਜਾਬੀro Românăru Русскийsm Samoangd Gàidhligsr Српски језикst Sesothosn Shonasd سنڌيsi සිංහලsk Slovenčinasl Slovenščinaso Afsoomaalies Españolsu Basa Sundasw Kiswahilisv Svenskatg Тоҷикӣta தமிழ்te తెలుగుth ไทยtr Türkçeuk Українськаur اردوuz O‘zbekchavi Tiếng Việtcy Cymraegxh isiXhosayi יידישyo Yorùbázu Zulu