This article is part of a series: How To Enter Survey Data
Part 1: Three Steps for Painless Survey Data Entry
Part 2: Preventing Mistakes in Survey Data Entry
Part 3: Common Issues with Survey Data Entry (and How to Solve Them)
In a previous article, Three Steps for Painless Survey Data Entry, I shared my system for entering data from paper surveys into a spreadsheet like Microsoft Excel. Here, I share solutions to two challenges you are likely to come across while entering survey data: 1) coding complex question types and 2) dealing with unclear responses. Addressing these challenges will require some advanced coding that I did not cover in my first article.
Entering data from complex survey questions
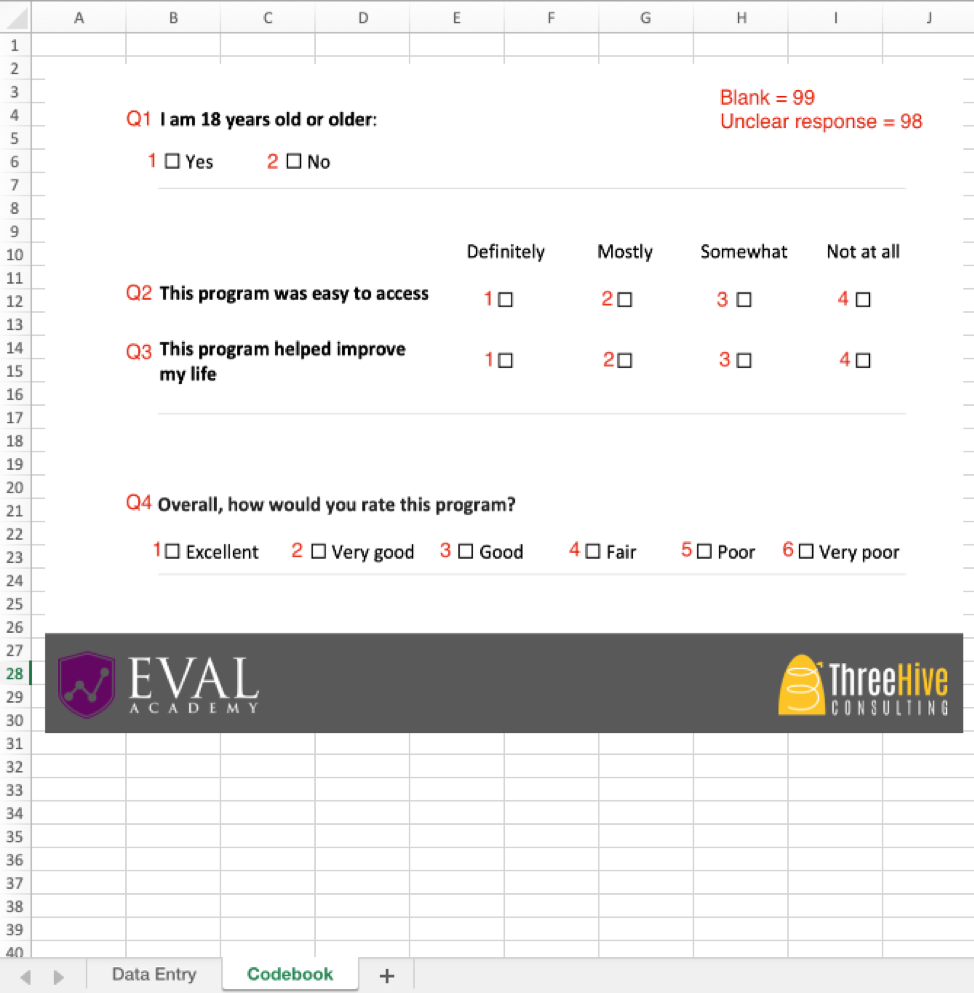
I recommend setting up the survey codebook in a systematic way because it increases data entry accuracy and speed. As a reminder, your codebook should look something like this:
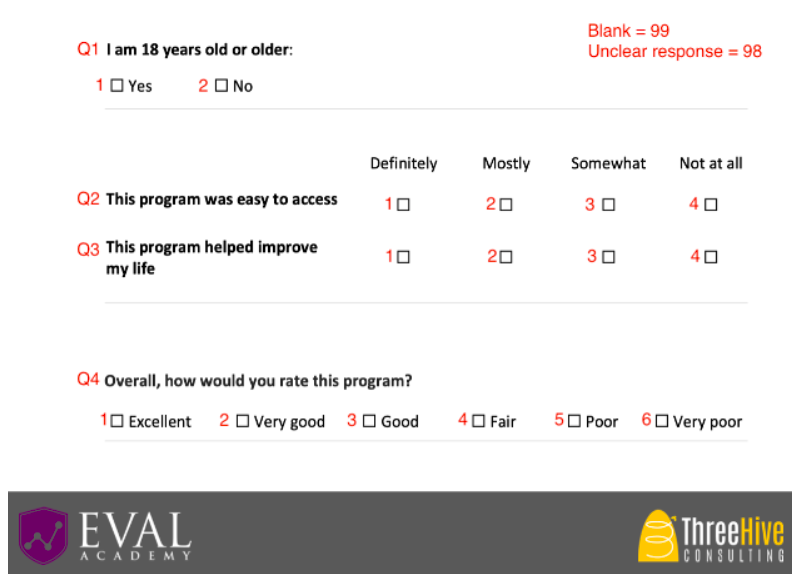
Example survey codebook
Moving top to bottom and left to right, simply number the responses sequentially starting at 1. This works when you expect exactly one response to the question (e.g., Yes OR No). However, your survey won’t always be this simple. Below are some examples of how to set up a codebook for more complex questions:
Issue #1: Responses are already numbered
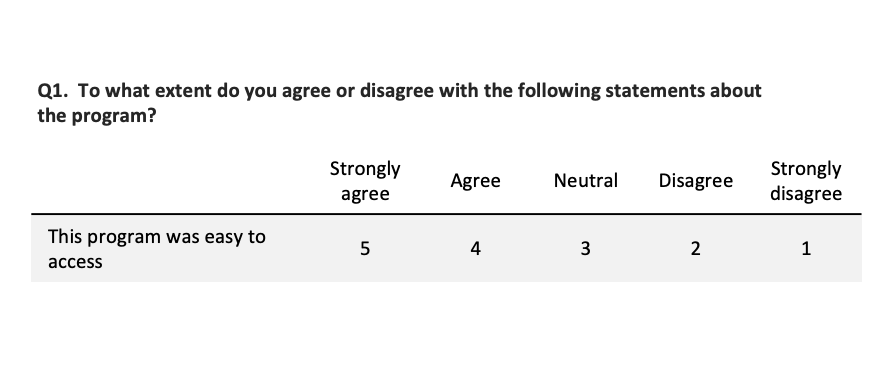
The question options may already be numbered on the survey, and respondents circle the number that applies (like in the image below). In this case, I would recommend following whatever numbering scheme is on the survey for data entry rather than re-numbering the responses. If someone circles 5, enter 5. Simple.
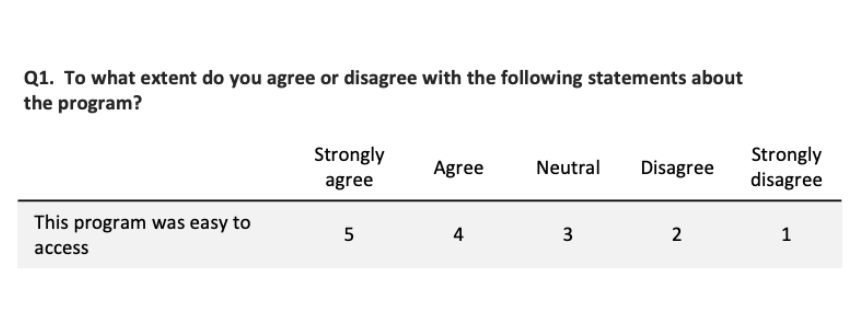
Example survey question: “To what extent do you agree or disagree with the following statements about the program? This program was easy to access.” Responses: Strongly agree (5), Agree (4), Neutral (3), Disagree (2), Strongly disagree (1).
Issue #2: Table or matrix of questions
When you have multi-part questions (like the question matrix below), label each part of the question with lowercase letters starting at “a.” You’ll notice that in this example, there are checkboxes instead of numbers, so I added numbers in red to the codebook from left to right, starting at 1.
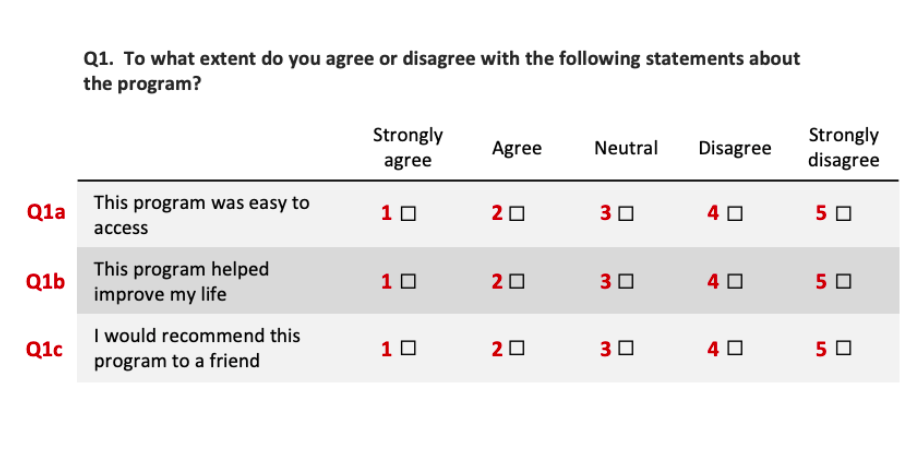
Question 1: To what extent do you agree or disagree with the following statements about the program? This program was easy to access. This program helped improve my life. I would recommend this program to a friend. Responses: Strongly agree (1), Agree (2), Neutral (3), Disagree (4), Strongly disagree (5).
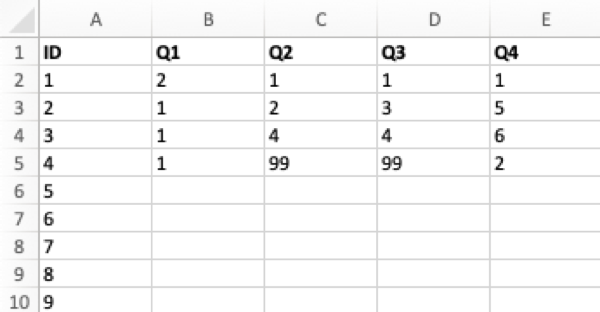
For this question, your data entry spreadsheet would be set up like this:
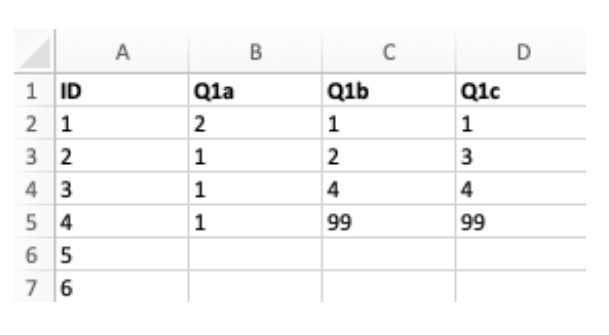
Example data entry spreadsheet
Issue #3: Select all that apply
A common question type is “select all that apply,” for example:
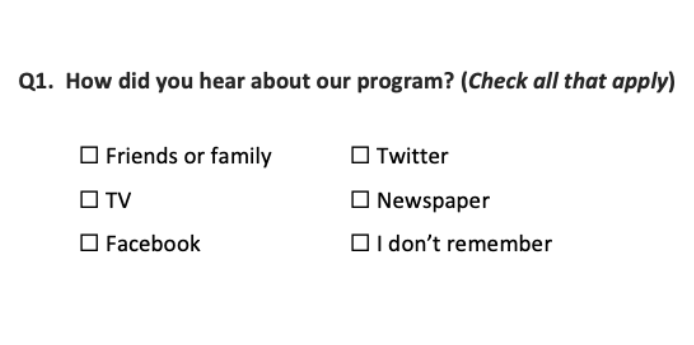
Question: How did you hear about our program? (Check all that apply). Responses: Friends or family, TV, Facebook, Twitter, Newspaper, I don’t remember.
People can check as many options as they like, so the usual system of numbering sequentially will not work. Instead, we treat this question like a question matrix, where each response item is its own “question,” with possible responses being “checked” and “not checked.” The codebook would look like this:
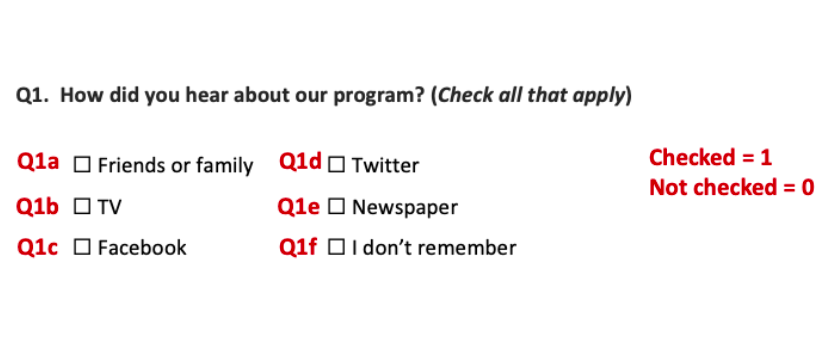
Codebook for question: How did you hear about our program? (Check all that apply). Responses: Friends or family, TV, Facebook, Twitter, Newspaper, I don’t remember.
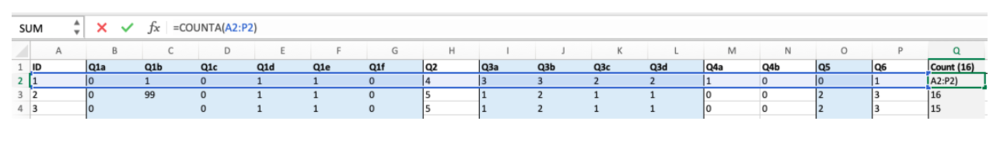
This will make more sense with an example. If our survey comes back like this:
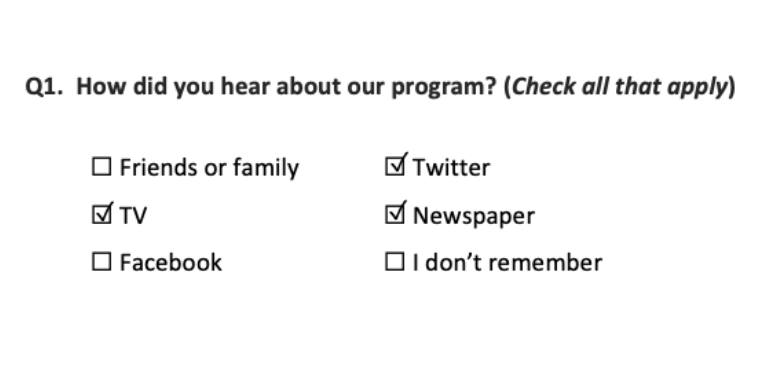
Example of answer to question: How did you hear about our program? (Check all that apply). Responses: Friends or family, TV, Facebook, Twitter, Newspaper, I don’t remember.
Reading through the responses in order (from top to bottom, left to right), we get:
-
Friends or family = not checked
-
TV = checked
-
Facebook = not checked
-
Twitter = checked
-
Newspaper = checked
-
I don’t remember = not checked
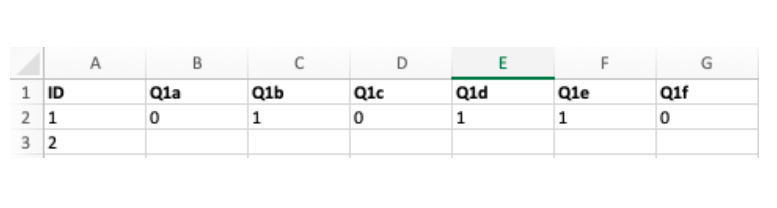
Using the codebook, these responses translate to:
-
Q1a = 0
-
Q1b = 1
-
Q1c = 0
-
Q1d = 1
-
Q1e = 1
-
Q1f = 0
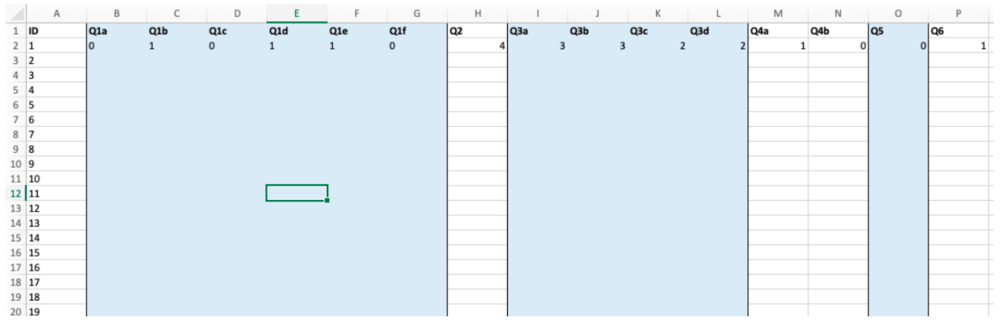
So the data would be entered like this:
Example codebook
Dealing with unclear responses
If you’ve ever conducted a survey before, you’ve certainly seen some wonky responses. People will circle more than one option when you want them to select only one, they’ll skip questions or even entire pages, they’ll write comments beside their answers, they’ll create new answers and circle those instead… So we need a way to deal with these unclear answers that don’t fit into our nice neat data entry sheet. The key to dealing with wonky responses is to decide on a rule, document it, and apply it consistently.
Issue #4: Circled too many answers
When a respondent selects more than one answer (like checking “Very good” and “Good”), you have a few options:
-
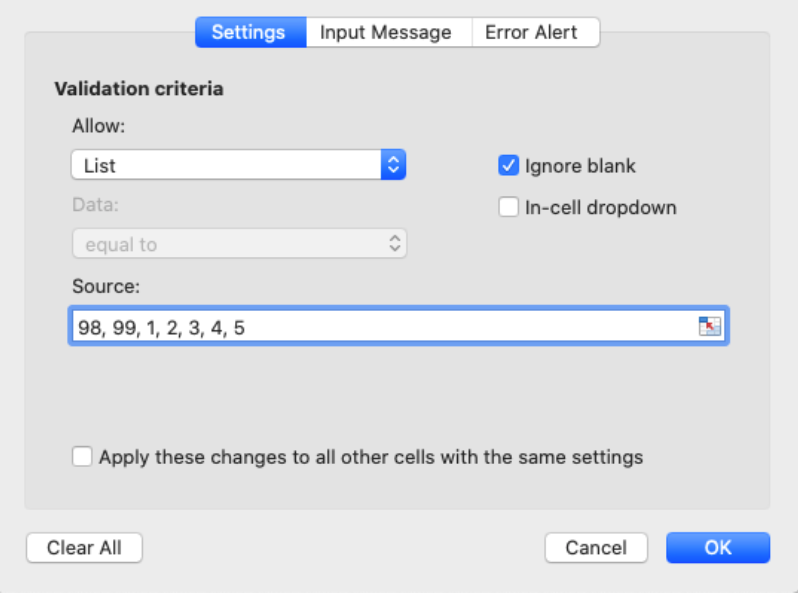
Code as “unclear” by entering 98. The advantage of doing this is that you do not make any guesses about what the respondent meant. Instead, you mark it as “unclear” and it is excluded from analysis; or
-
Randomly pick one of the selected answers. You can do this by using a random number generator, or just type “flip a coin” into Google. The advantage of doing this is that you do not exclude as many responses (which may be important if you have a small sample size).
Issue #5: Made up their own answer
Sometimes people will write in their own answer (even when there is not an open-ended question). For example, you might see something like this:
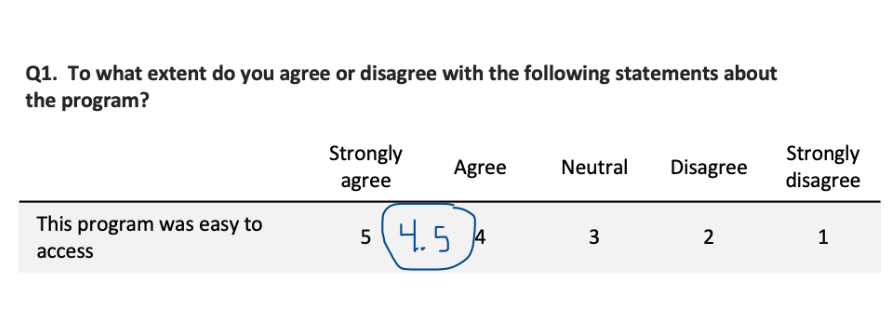
Example of question where the respondent added a new option between “5” and “4” called “4.5” and circled that instead of one of the given responses.
The respondent created their own option (“4.5”) between Strongly agree and Agree (you’d be surprised how common this is). You can’t simply enter 4.5 into the data entry, because that is not one of the allowable responses in the codebook. Instead, you can treat this as if they circled “5” and “4,” and then carry on with the same procedure as when a respondent circles more than one answer. Your options are:
-
Code as “unclear” by entering 98; or
-
Randomly pick one of the selected answers (e.g., flip a coin to decide whether to enter “5” or “4”).
Another example of a respondent creating their own answer is:
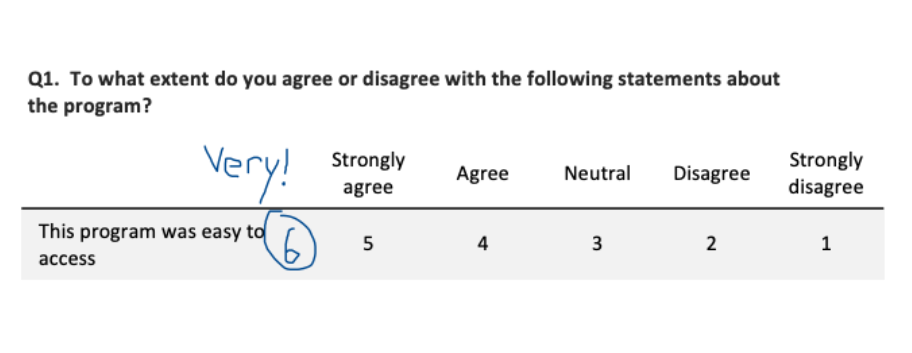
Example of a question where the respondent added a new response after “5” called “6” and wrote “Very!” beside it.
Here, the respondent made an option even higher than “Strongly agree”, which they wrote in as “6” and labeled with “Very!” Your options for data entry are:
-
Code as “unclear” by entering 98; or
-
Assume the respondent would “strongly agree” with the statement and enter “5” since it is the next closest response to their answer.
There are a few considerations when choosing an option for this scenario. On the one hand, we want to be careful to maintain the integrity of the original data – “6” is not the same thing as “Strongly agree,” so you may not want to assume that’s what the respondent meant. On the other hand, we might be fairly sure the respondent meant to indicate their agreement – should we try to capture the spirit of their response in the way we code the data? Either way of treating the data could be justified, so it’s important to decide what makes sense for your survey, document the rule, and follow it consistently.
I’ve covered some strategies you can use to overcome common challenges in entering survey data. If you conduct paper surveys, you’re likely to come across complex question types and unclear responses, but with some forethought and planning, you can make sure you’re prepared to deal with these challenges in a consistent way that makes sense for your data. However you choose to deal with complex questions or unclear responses on your survey, the key is to decide on a rule, document your decision (so it can be discussed later in the methods section), and follow it consistently.
Sign up for our newsletter
We’ll let you know about our new content, and curate the best new evaluation resources from around the web!
We respect your privacy.
Thank you!


 (@annkemery)