Welcome to episode 001 of my new cartoon Q&A series. I started this video series because the thing that gets me most inspired to draw cartoons is having casual conversations with evaluators, researchers, data designers, and all sorts of creative professionals.
In today’s conversation I chat with Nick Visscher, who is an evaluator and also the creator of the Spotlight Impact Data Design YouTube channel.
Among other things, we talk about YouTube, data design in PowerPoint, and if it makes sense to just keep your side hustle as a side hustle. It was a fun conversation that inspired a set of 8 new comics, which you’ll see appear throughout the video.
The Comics from the Q&A
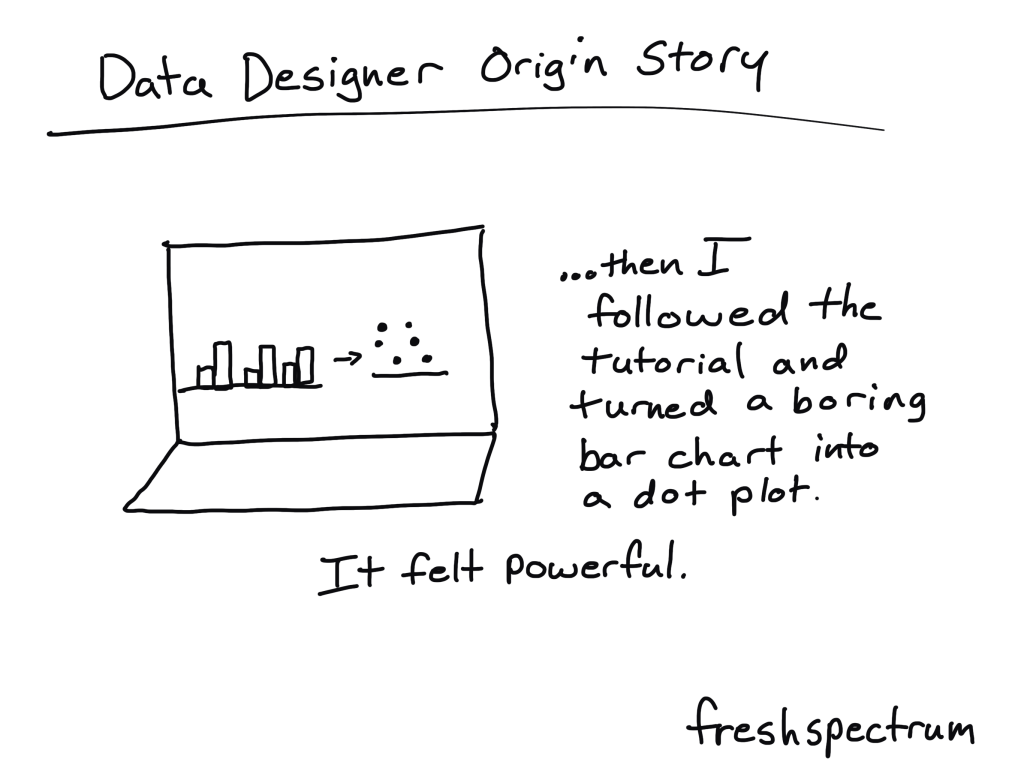
Data Designer Origin Story
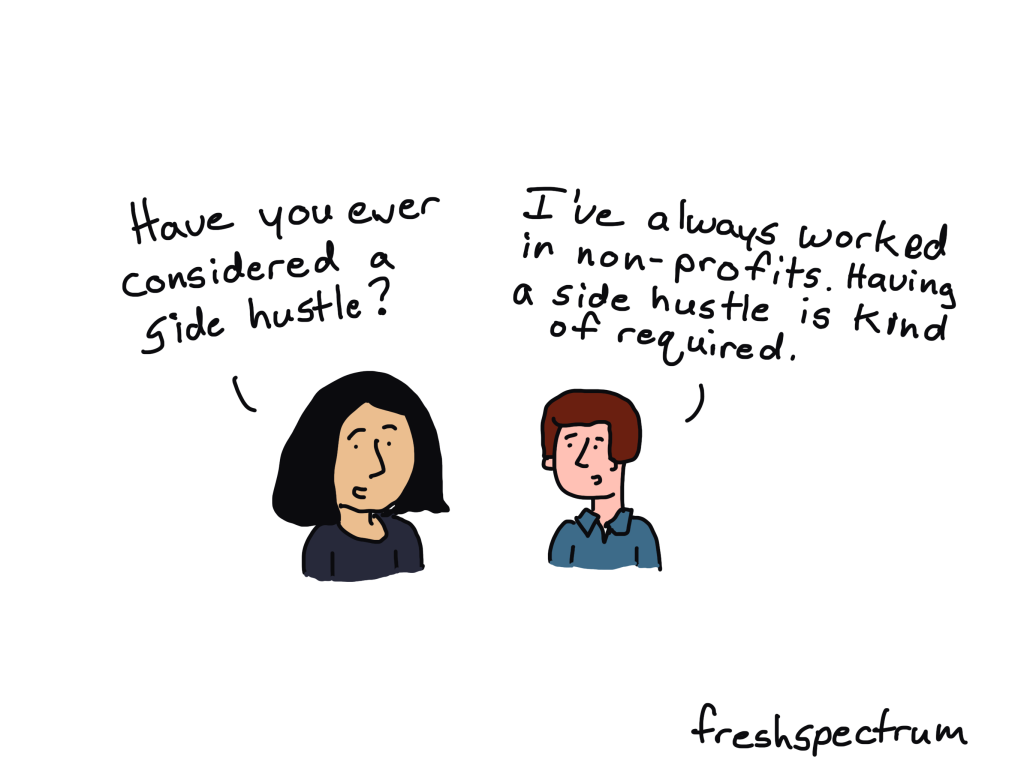
Side Hustle Required
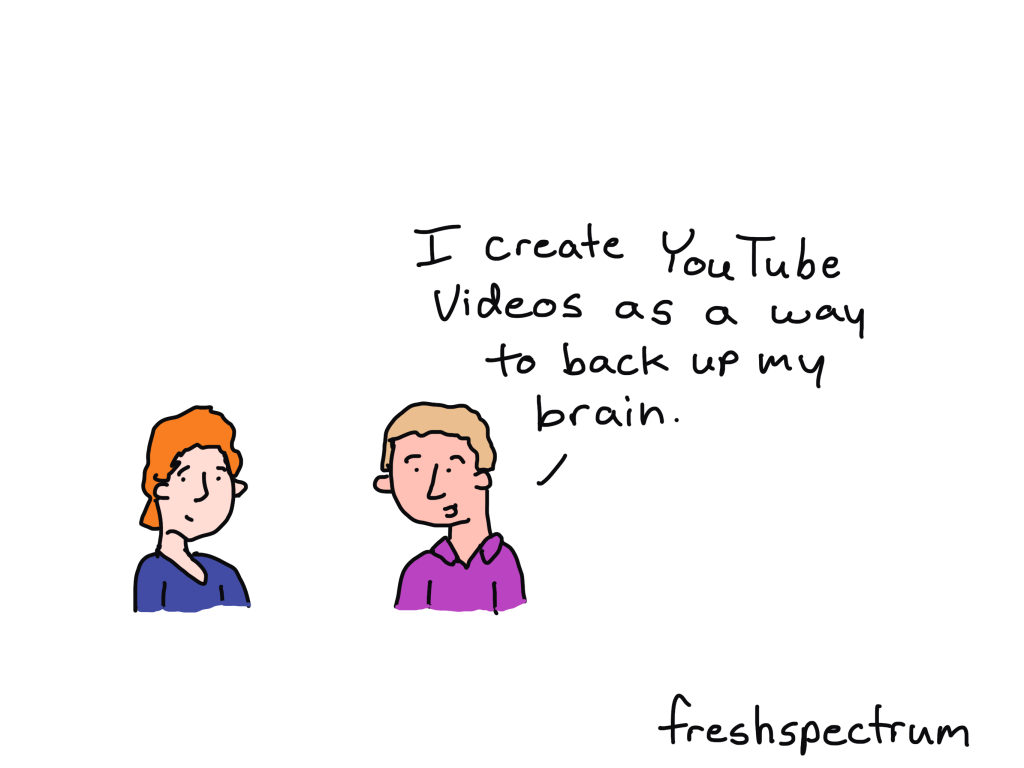
Brain Backup
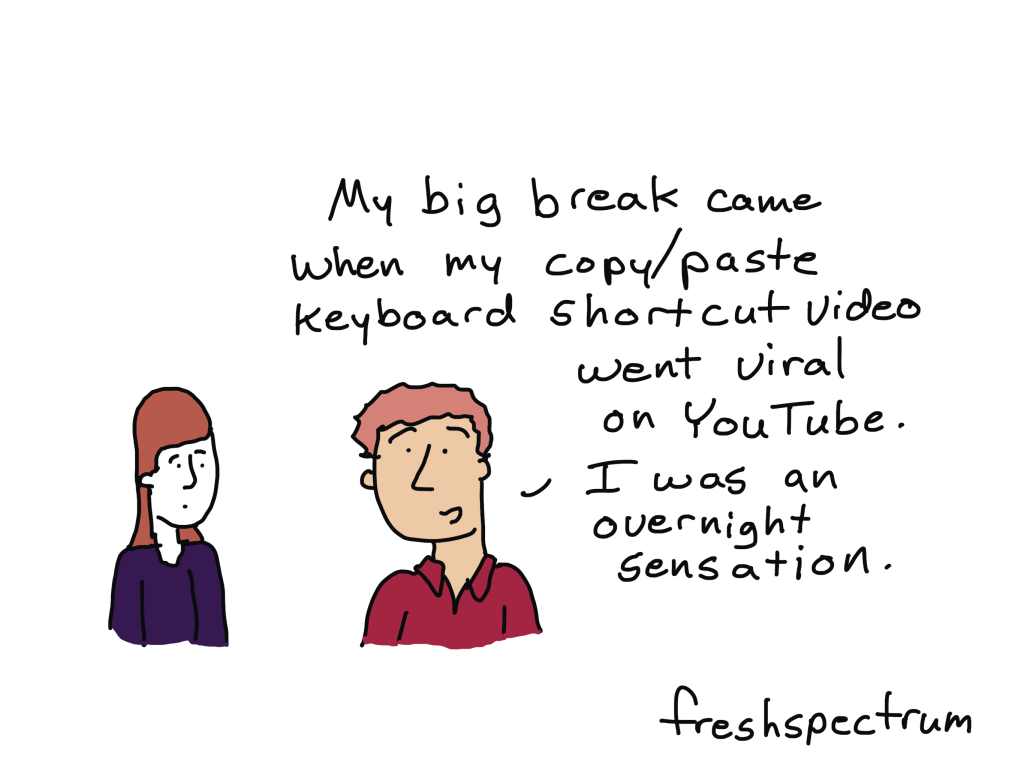
Copy Paste Big Break
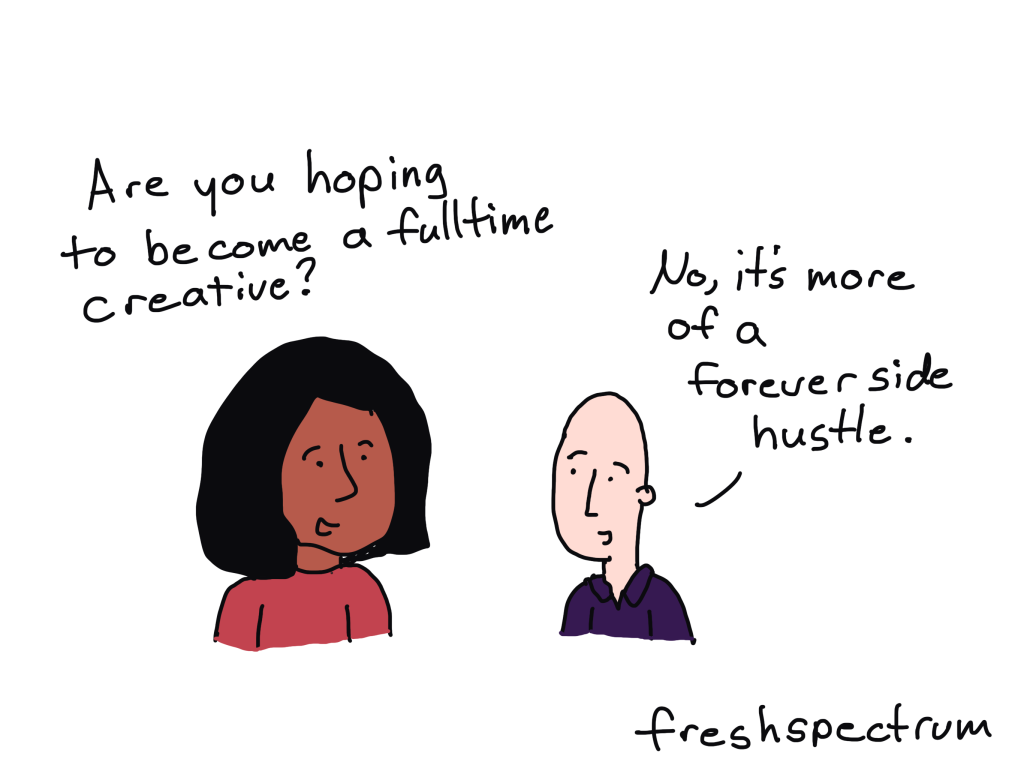
Forever Side Hustle
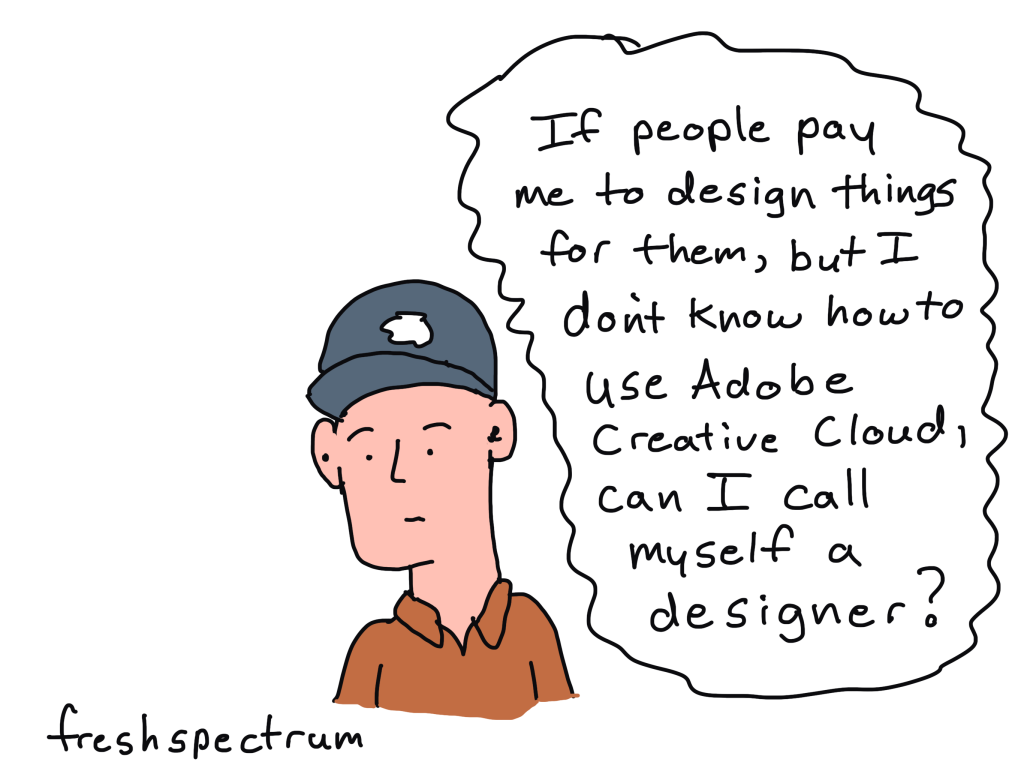
No Adobe Designer
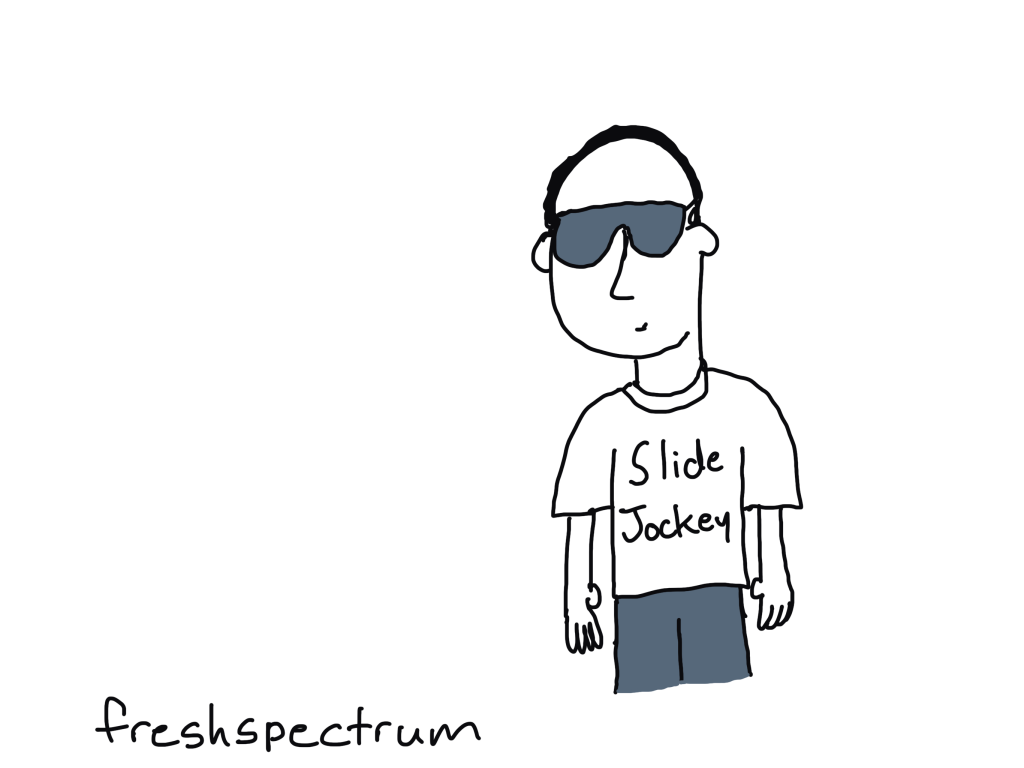
Slide Jockey
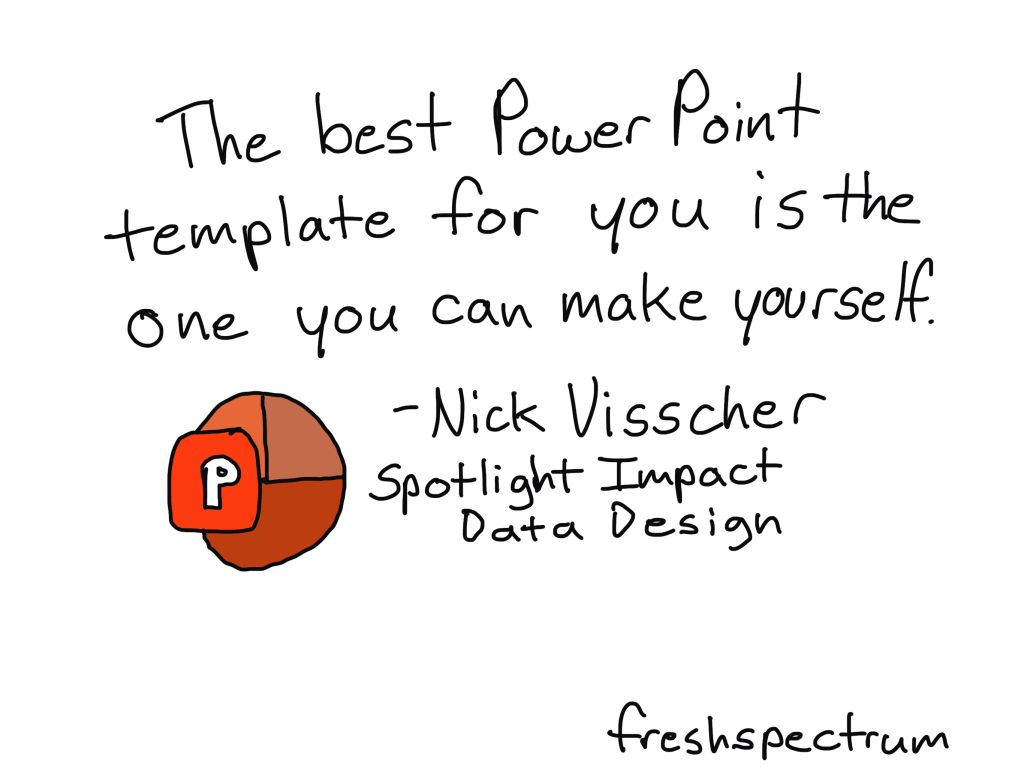
The best PowerPoint template.
What do you think?
This is a new YouTube series concept. What do you think about it?