• Skip to main content
  • Skip to footer
  • Home

The May 13 Group

the next day for evaluation

  • Get Involved
  • Our Work
  • About Us
You are here: Home / Archives for allblogs / evalacademy

evalacademy

Jun 01 2020

Evaluation Roundup – May 2020


Welcome to our monthly roundup of new and noteworthy evaluation news and resources – here is the latest.

Have something you’d like to see here? Tweet us @EvalAcademy or connect on LinkedIn!


New and Noteworthy — Reads


One-Way Street of Knowledge Production and Sharing in The Evaluation Field

With the protests that are unfolding in Minneapolis, and now the rest of the world, it is worth reading (or re-reading) Khalil Bitar’s blog post from May 11. In the post he talks about how the evaluation community is not immune to prejudice, discrimination and racism, and is in fact practicing it by primarily producing and sharing evaluation knowledge by white men from the Global North. As he says, the evaluation community is not immune to racism and has an ethical responsibility to be more mindful, inclusive and open:

“The evaluation field should be among the leading fields in combating these convictions and practices. It is time for the field to systematically embrace and nourish views, thoughts, and experiences that have long been neglected.”

— Khalil Bitar

Good Practices for Evaluation During COVID-19

Recently OECD/DAC Network on Development Evaluation (EvalNet) and the Independent Evaluation Office of UNDP jointly prepared a guidance document that captures good practices for evaluations during COVID-19. In the document they provide insights, suggestions and practical examples for how to adapt evaluation work. These include:

  1. Do no harm,

  2. Take care of staff,

  3. Re-think evaluation plans,

  4. Adapt evaluation methods and approaches,

  5. Use information technologies and remote data solutions,

  6. Build on and support local capacities and

  7. Prepare for future evaluations.


Zenda Ofir – Transforming Evaluations Part 5. COVID-Safe, COVID-Ready and COVID-Informed Evaluation

The guidance document produced by the OECD/DAC and UNDP-IEO (referenced above) is a good illustration of a COVID-Safe evaluation – it focuses on details of what to do and how to  adjust our evaluations in a crisis situation. In this blog post, @ZendaOfir also explores COVID-Ready and COVID-Informed evaluation. She goes on to explain that many believe that we might have to live with COVID if a vaccine or cure is not found. Therefore, COVID-Ready evaluation focuses on what should be evaluated in the event of an ongoing crisis that will help people and societies cope. Yet, Ofir goes on to say that COVID-Ready evaluation is not enough since it focuses on recovery and preparedness “more or less within the status quo and in the short to medium term.” COVID-Informed evaluation, she says, has a long-term perspective that focuses on preparing humanity for sustainable development and resilient societies.  


Zenda Ofir – A Beautiful Practice for our time

Looking for some more insights by @ZendaOfir? She wrote a blog post that seemed to create a bit of chatter on Twitter. Some agreed with @ZendaOfir and her thoughts on if/how evaluation contributes to beauty in this world, while others did not. In this post, Zenda Ofir offers that “evaluation as practice is intrinsically beautiful – but how it is practiced, frequently not.” She goes on to outline seven reasons for why she considers evaluation as something “beautiful”. What do you think? Do you agree?


New and Noteworthy — Tools


Quick reference guides evaluators can’t live without

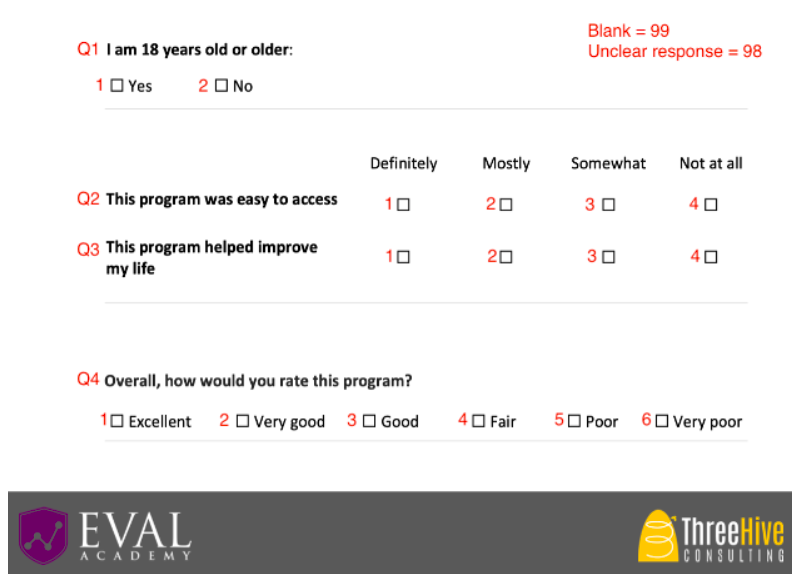
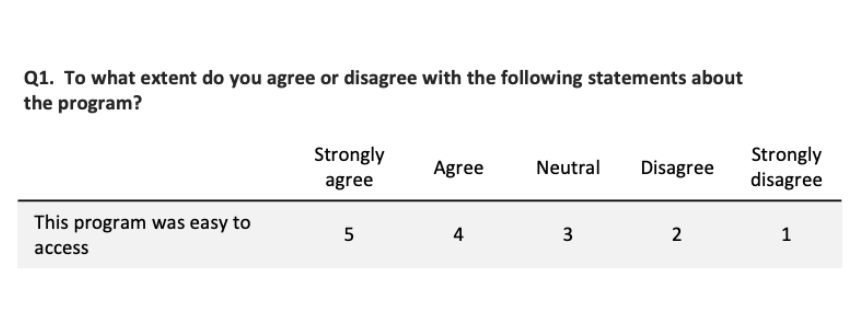
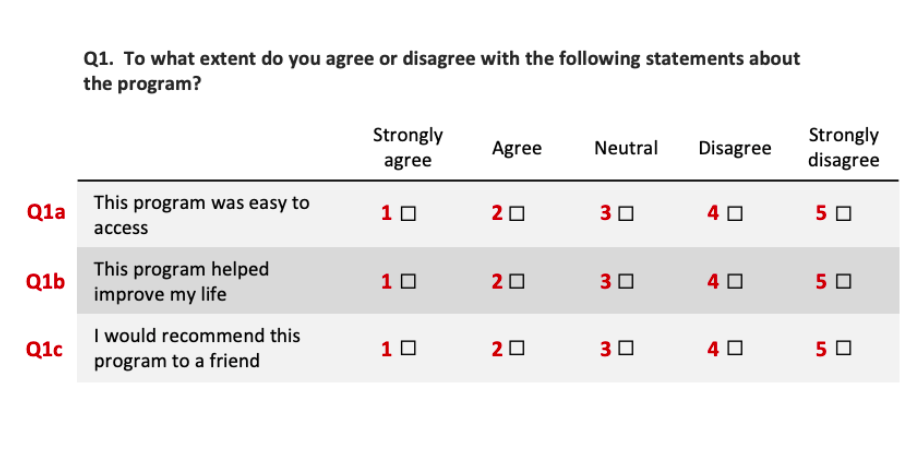
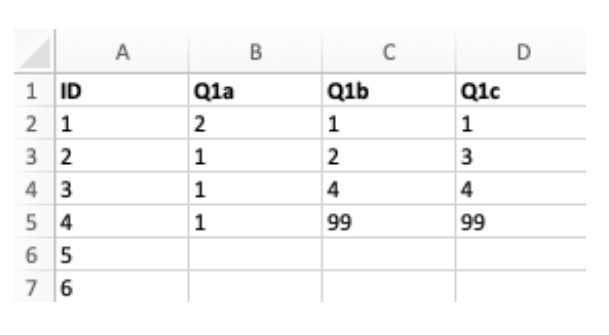
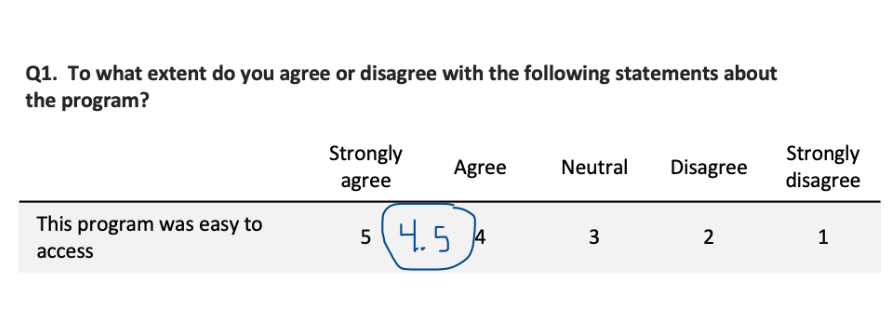
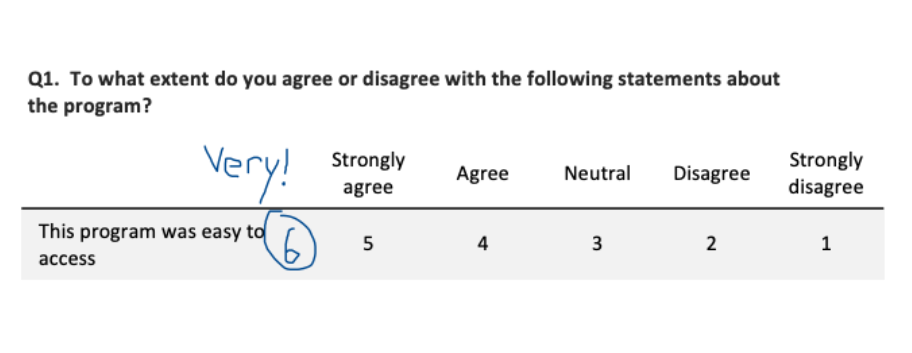
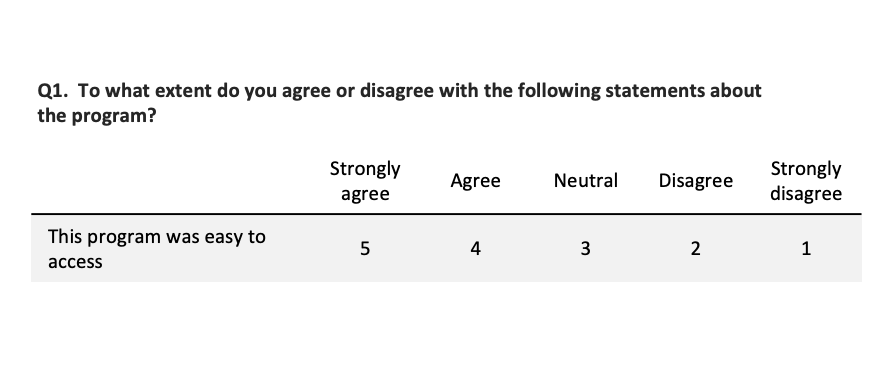
Kudos to Kelly Robertson from EvaluATE for pulling together so many checklists, guides and other resources. These are organized according to evaluation activity and can be found here on EvaluATE’s website. I have to say, the Likert-Type Scale Response Anchors developed by Vagias and Wade is one I reference frequently!


New and Noteworthy — Courses, Events and Webinars


June 2020

  1. gLOCAL Evaluation Week (June 1- 5, 2020) – Online, free events

    • Host: Centers for Learning on Evaluation and Results

  2. Rewiring Evaluation Approaches at the Intersection of Data Science and Evaluation – Webinar

    • Host: World Bank – Independent Evaluation Group

  3. Feminist Evaluation: Not your standard gender-responsive approach! – Online Course

    • Instructor: Donna Podems (@DonnaPodems)

  4. Transformative Mixed-Methods Evaluation – Online Course


July 2020

  1. Results-based Management & Theory of Change Workshop during and after COVID-19

    • Instructor: Mosaic.net International Inc.


We have a free guide:

Applying the JCSEE Evaluation Standards in Practice

Whether you’ve read The Program Evaluation Standards cover to cover or not, you may be wondering how to ensure you’re applying them to your evaluation practice. This free digital download will give you the reflective prompts you need to ensure your next evaluation project incorporates all 30 Standards.


Subscribe to Our Newsletter

Sign up with your email address to receive news and updates from Eval Academy every month.


We respect your privacy.

Thank you!


Written by cplysy · Categorized: evalacademy

May 26 2020

Common Issues When Entering Survey Data (and How to Solve Them)


This article is part of a series: How To Enter Survey Data

Part 1: Three Steps for Painless Survey Data Entry
Part 2: Preventing Mistakes in Survey Data Entry
Part 3: Common Issues with Survey Data Entry (and How to Solve Them)

In a previous article, Three Steps for Painless Survey Data Entry, I shared my system for entering data from paper surveys into a spreadsheet like Microsoft Excel. Here, I share solutions to two challenges you are likely to come across while entering survey data: 1) coding complex question types and 2) dealing with unclear responses. Addressing these challenges will require some advanced coding that I did not cover in my first article.


Entering data from complex survey questions

I recommend setting up the survey codebook in a systematic way because it increases data entry accuracy and speed. As a reminder, your codebook should look something like this:

Example survey codebook

Example survey codebook

Moving top to bottom and left to right, simply number the responses sequentially starting at 1. This works when you expect exactly one response to the question (e.g., Yes OR No). However, your survey won’t always be this simple. Below are some examples of how to set up a codebook for more complex questions:


Issue #1: Responses are already numbered

The question options may already be numbered on the survey, and respondents circle the number that applies (like in the image below). In this case, I would recommend following whatever numbering scheme is on the survey for data entry rather than re-numbering the responses. If someone circles 5, enter 5. Simple.

Example survey question: “To what extent do you agree or disagree with the following statements about the program? This program was easy to access.” Responses: Strongly agree (5), Agree (4), Neutral (3), Disagree (2), Strongly disagree (1).

Example survey question: “To what extent do you agree or disagree with the following statements about the program? This program was easy to access.” Responses: Strongly agree (5), Agree (4), Neutral (3), Disagree (2), Strongly disagree (1).

Issue #2: Table or matrix of questions

When you have multi-part questions (like the question matrix below), label each part of the question with lowercase letters starting at “a.” You’ll notice that in this example, there are checkboxes instead of numbers, so I added numbers in red to the codebook from left to right, starting at 1.

Question 1: To what extent do you agree or disagree with the following statements about the program? This program was easy to access. This program helped improve my life. I would recommend this program to a friend. Responses: Strongly agree (1), Agree (2), Neutral (3), Disagree (4), Strongly disagree (5).

Question 1: To what extent do you agree or disagree with the following statements about the program? This program was easy to access. This program helped improve my life. I would recommend this program to a friend. Responses: Strongly agree (1), Agree (2), Neutral (3), Disagree (4), Strongly disagree (5).

For this question, your data entry spreadsheet would be set up like this:

Example data entry spreadsheet

Example data entry spreadsheet


Issue #3: Select all that apply

A common question type is “select all that apply,” for example:

Question: How did you hear about our program? (Check all that apply). Responses: Friends or family, TV, Facebook, Twitter, Newspaper, I don’t remember.

Question: How did you hear about our program? (Check all that apply). Responses: Friends or family, TV, Facebook, Twitter, Newspaper, I don’t remember.

People can check as many options as they like, so the usual system of numbering sequentially will not work. Instead, we treat this question like a question matrix, where each response item is its own “question,” with possible responses being “checked” and “not checked.” The codebook would look like this:

Codebook for question: How did you hear about our program? (Check all that apply). Responses: Friends or family, TV, Facebook, Twitter, Newspaper, I don’t remember.

Codebook for question: How did you hear about our program? (Check all that apply). Responses: Friends or family, TV, Facebook, Twitter, Newspaper, I don’t remember.

This will make more sense with an example. If our survey comes back like this:

Example of answer to question: How did you hear about our program? (Check all that apply). Responses: Friends or family, TV, Facebook, Twitter, Newspaper, I don’t remember.

Example of answer to question: How did you hear about our program? (Check all that apply). Responses: Friends or family, TV, Facebook, Twitter, Newspaper, I don’t remember.

Reading through the responses in order (from top to bottom, left to right), we get:

  • Friends or family = not checked

  • TV = checked

  • Facebook = not checked

  • Twitter = checked

  • Newspaper = checked

  • I don’t remember = not checked


Using the codebook, these responses translate to:

  • Q1a = 0

  • Q1b = 1

  • Q1c = 0

  • Q1d = 1

  • Q1e = 1

  • Q1f = 0


So the data would be entered like this:

Example codebook

Example codebook


Dealing with unclear responses

If you’ve ever conducted a survey before, you’ve certainly seen some wonky responses. People will circle more than one option when you want them to select only one, they’ll skip questions or even entire pages, they’ll write comments beside their answers, they’ll create new answers and circle those instead… So we need a way to deal with these unclear answers that don’t fit into our nice neat data entry sheet. The key to dealing with wonky responses is to decide on a rule, document it, and apply it consistently.


Issue #4: Circled too many answers

When a respondent selects more than one answer (like checking “Very good” and “Good”), you have a few options:

  1. Code as “unclear” by entering 98. The advantage of doing this is that you do not make any guesses about what the respondent meant. Instead, you mark it as “unclear” and it is excluded from analysis; or

  2. Randomly pick one of the selected answers. You can do this by using a random number generator, or just type “flip a coin” into Google. The advantage of doing this is that you do not exclude as many responses (which may be important if you have a small sample size).


Issue #5: Made up their own answer

Sometimes people will write in their own answer (even when there is not an open-ended question). For example, you might see something like this:

Example of question where the respondent added a new option between “5” and “4” called “4.5” and circled that instead of one of the given responses.

Example of question where the respondent added a new option between “5” and “4” called “4.5” and circled that instead of one of the given responses.

The respondent created their own option (“4.5”) between Strongly agree and Agree (you’d be surprised how common this is). You can’t simply enter 4.5 into the data entry, because that is not one of the allowable responses in the codebook. Instead, you can treat this as if they circled “5” and “4,” and then carry on with the same procedure as when a respondent circles more than one answer. Your options are:

  1. Code as “unclear” by entering 98; or

  2. Randomly pick one of the selected answers (e.g., flip a coin to decide whether to enter “5” or “4”). 

Another example of a respondent creating their own answer is:

Example of a question where the respondent added a new response after “5” called “6” and wrote “Very!” beside it.

Example of a question where the respondent added a new response after “5” called “6” and wrote “Very!” beside it.

Here, the respondent made an option even higher than “Strongly agree”, which they wrote in as “6” and labeled with “Very!” Your options for data entry are:

  1. Code as “unclear” by entering 98; or

  2. Assume the respondent would “strongly agree” with the statement and enter “5” since it is the next closest response to their answer.


There are a few considerations when choosing an option for this scenario. On the one hand, we want to be careful to maintain the integrity of the original data – “6” is not the same thing as “Strongly agree,” so you may not want to assume that’s what the respondent meant. On the other hand, we might be fairly sure the respondent meant to indicate their agreement – should we try to capture the spirit of their response in the way we code the data? Either way of treating the data could be justified, so it’s important to decide what makes sense for your survey, document the rule, and follow it consistently.


I’ve covered some strategies you can use to overcome common challenges in entering survey data. If you conduct paper surveys, you’re likely to come across complex question types and unclear responses, but with some forethought and planning, you can make sure you’re prepared to deal with these challenges in a consistent way that makes sense for your data. However you choose to deal with complex questions or unclear responses on your survey, the key is to decide on a rule, document your decision (so it can be discussed later in the methods section), and follow it consistently.


Sign up for our newsletter

We’ll let you know about our new content, and curate the best new evaluation resources from around the web!


We respect your privacy.

Thank you!


Written by cplysy · Categorized: evalacademy

May 26 2020

Preventing Mistakes in Survey Data Entry


This article is part of a series: How To Enter Survey Data

Part 1: Three Steps for Painless Survey Data Entry
Part 2: Preventing Mistakes in Survey Data Entry
Part 3: Common Issues with Survey Data Entry (and How to Solve Them)

When entering survey data, it is important that it is accurate, easy to analyze, and fast. The best way to meet these goals is to set yourself (or your data entry people) up for success from the beginning.

The old cliché “garbage in, garbage out” certainly applies to survey data entry. Our analysis can only be as good as our data, so it’s critical that the survey data is accurately translated from paper to spreadsheet. But being extra careful while entering data can only go so far – we get tired, we forget, and we make mistakes. Here are three tools you can use to prevent errors in survey data entry by making your spreadsheet foolproof: 1) data validation, 2) colour-coding columns, and 3) a “count” formula.

If you haven’t already set up your survey codebook and data entry spreadsheet, check out the previous article in this series for instructions on how to do so.


1. Data validation

Data validation is your first defence against data entry errors, and it is very simple to implement. Data validation just means defining which values are allowed in which cells. After you have made the survey codebook and data entry spreadsheet, you can set the validation on a question-by-question basis. I will use this survey question as an example:

Question: To what extent do you agree or disagree with the following statements about the program?  Statement: This program was easy to access.  Responses: Strongly agree (5), Agree (4), Neutral (3), Disagree (2), Strongly disagree (1)

Question: To what extent do you agree or disagree with the following statements about the program?

Statement: This program was easy to access.

Responses: Strongly agree (5), Agree (4), Neutral (3), Disagree (2), Strongly disagree (1)

In the spreadsheet for Q1, we want to allow only seven different values to be entered (the five responses 1-5, plus 98 and 99 for “unclear” and “missing/ skipped”). To set up Data Validation in Microsoft Excel, the steps are:

  1. Highlight the Q1 column in your data entry spreadsheet

  2. Click the “Data” tab in the Microsoft Excel Ribbon

  3. Click “Data Validation”

  4. Set Allow to “List”

  5. Set Source to a list of the allowed values separated by commas (see image below)

  6. I choose not to use the “in-cell dropdown” feature because I find it slows down my data entry, but this is up to you.

  7. Click “Ok”

How to set up Microsoft Excel Data Validation to accept a list of allowable responses.

How to set up Microsoft Excel Data Validation to accept a list of allowable responses.

Now that data validation is set up, you will receive a pop-up message warning you if you enter a value that isn’t allowed for that question, which will guard against mis-typed data.


2. Colour-code columns

Colour-coding columns is especially helpful for long surveys. I highlight groups of questions in the same colour (e.g., a matrix containing six questions), which gives your eye a visual cue to make sure you’re still entering data in the correct cells of the spreadsheet. In addition to colours, you can also add borders between sections on the survey. For example:

Excel spreadsheet using colours and borders to differentiate survey sections.

Excel spreadsheet using colours and borders to differentiate survey sections.

By grouping questions together using colour and lines, you provide a visual anchor that helps you keep track of where you are in the data entry spreadsheet.


3. Count cells to make sure you didn’t miss any questions

It’s easy to accidentally skip a question, especially when it is at the end of the page (or maybe the respondent skipped it and you left it blank instead of entering 99). By adding a “count” column at the end of your data entry sheet, you can prevent this mistake. Simply add a column with the Excel formula =COUNTA(*specify the entire row*), then fill this formula down the entire column. This formula will count the number of cells in the row that aren’t blank:

Excel spreadsheet using =COUNTA to ensure all questions have been filled with data.

Excel spreadsheet using =COUNTA to ensure all questions have been filled with data.

In the example, the formula for the first row is =COUNTA(A2:P2). As you can see, if every cell is filled in properly (including the ID column), COUNTA will return the value 16 (because there are 16 non-blank cells). I name the count column “Count (16)” so I don’t forget it is supposed to add up to 16. If you accidentally skip a question, like I did on respondent ID#3 Q1b, the COUNTA value will be less than 16. This is a quick way to check when you reach the end of a survey that you didn’t miss any questions.

If your surveys don’t have ID numbers written on them, it can be very difficult or even impossible to go back and find a survey you made a mistake on. For this reason, I recommend checking the Count column at the end of every survey, or at least every few surveys, so it’s easy to flip back in your stack of surveys and find the culprit. Another option is to write the appropriate ID number on the surveys as you go, which gives you the ability to do quality control more easily.


Bonus Tip: Remember to save!

We all know the gut-wrenching feeling of a program crashing and you can’t remember the last time you saved. To avoid this heartbreak, I do a quick CTRL+S or CMD+S (save shortcut) at the end of every page of a survey – if you’re turning the page, save!


Sign up for our newsletter

We’ll let you know about our new content, and curate the best new evaluation resources from around the web!


We respect your privacy.

Thank you!


Written by cplysy · Categorized: evalacademy

May 26 2020

Three Steps for Painless Survey Data Entry


This article is part of a series: How To Enter Survey Data

Part 1: Three Steps for Painless Survey Data Entry
Part 2: Preventing Mistakes in Survey Data Entry
Part 3: Common Issues with Survey Data Entry (and How to Solve Them)

Arguably the most exciting part about conducting a survey is seeing the results – finally your hard work has come to fruition, and you get to hear what everybody had to say about your program or organization! But before you can get to that step, you need to transform the stack of paper surveys on your desk into useable data.

For some, the thought of survey data entry is a mind-numbing task, but I kind of love it… You get to switch the critical thinking part of your brain off and just focus on one simple task, which isn’t an opportunity we often get in this fast-paced world.

I’m going to share my three-step system for making survey data entry as easy and painless as possible, which comes from my experience designing, entering, and analyzing survey data.

Before you get started entering survey data, you should think about your goals. My priorities for survey data entry are that it is:

  • Accurate,

  • Easy to analyze, and

  • Fast.

The most important job of data entry is that it is accurate. If it isn’t accurate, then forget analysis and speed. Accurate data entry means what ends up in the spreadsheet reflects exactly what was on the survey, every single time.

The next priority is that the survey data is easy to analyze. With some forethought, you can save your data analyst (which might also be you!) a lot of time and headache down the road.

Finally, data entry should be as fast as possible – time is money, after all! But never, ever sacrifice accuracy for speed.

Here are the three steps you can follow to set yourself up for painless survey data entry:

1. Review the survey carefully

Familiarize yourself with the questions on the survey, and the available options. Are there fill in the blanks? Multiple choice? Select all that apply? Most likely there are many question types, and understanding all the different questions is critical to steps 2 and 3. If it’s your first time seeing the particular survey, you might want to sit down and fill out a blank copy as if you were a respondent to get a really good feel for the questions.

2. Create the codebook

You should never be typing out the verbatim responses to each question while entering survey data (e.g., “yes” “yes” “no” “yes”). Instead, assign each response a number (e.g., yes = 1, no = 2) and enter those numbers instead of words. This fulfills all of our data entry priorities: it is more accurate, easier to analyze, and faster.

The codebook is your translator between the survey and the data. It tells you (and the analyst) how to turn survey responses into numbers, and back again. A copy of this codebook should live in the same folder as the data entry sheet and be clearly named. For added convenience, I paste a copy of the codebook into the data entry spreadsheet (Step 3) in a tab called Codebook. Here is what a simple codebook looks like:

Example survey codebook

Example survey codebook

The codebook outlines which number should be entered for each response. In this example, if someone answered Yes to Q1, you would enter “1.” If they answered No, enter “2.” You’ll notice I added the question numbers beside the questions – sometimes the paper surveys you receive won’t have the questions numbered, so you should write them into the codebook.

How you assign the response codes is up to you, but I strongly recommend following this system: from left-to-right and top-to-bottom, number the responses sequentially starting from 1. This way, the codes are the same no matter what the question is, which helps you ensure accuracy and speed. By following the same coding system for every question, the data entry person knows that the first response is always “1,” the second is always “2,” and so on. Numbers are faster and more accurate to type than letters because they are all close together on your keyboard’s number pad. Note: there are some exceptions to this rule when it comes to more complex question types, which I will cover in a follow-up article.

When it comes time to analyze the data, you might need to recode the data depending on how it will be analyzed (for example, maybe you want to change all the 1’s back to Yes’s, or change all the 2’s to 0’s). This is quick and easy to do at the analysis stage, and is not very prone to errors as long as you document any changes you make. Trust me, it’s way easier to change all the 1’s to Yes’s at the end than it is to type out “y-e-s” (or even just “y”) during data entry.

You’ll notice that I added “blank = 99 and unclear response = 98.” These are codes you will use when someone skips a question (99) or if they check more boxes than they are supposed to (98). How you deal with missing or unclear responses is up to you – just decide on a rule, document it, and apply it consistently. Entering 99 instead of leaving a blank cell is good practice because then you know for sure that question was skipped by the respondent, and not accidentally missed during data entry. However, do not use 98 and 99 if you are recording a numeric variable like age, because you won’t know if it is supposed to be “99 years old” or “missing data.” In this case, you may want to use 999 for missing data instead. Read more about blanks in data entry in our article “Four Common Data Entry Mistakes (and How to Fix Them)”.

3. Create the data entry spreadsheet

Now that you have the codebook, the data entry spreadsheet is easy to create. Using Microsoft Excel or Google Sheets (or other spreadsheet software) create a new file with one column for each question, plus a column for an identification number (ID#). Each cell will contain one number corresponding to the response to that question. For the above example, the spreadsheet (with some sample data) would look like this:

Example survey data entry spreadsheet

Example survey data entry spreadsheet

In a data entry spreadsheet, each row should always contain all the data for one unique individual. I like to add an ID column and fill the ID numbers all the way down the column before starting data entry. Even if there is no ID number on the survey to begin with, it is a good idea to add it to the spreadsheet because some statistical programs require a unique ID for each respondent. You may also want to manually write the ID numbers on the surveys as you enter them — if you don’t put ID numbers on the surveys, it is very difficult to go back and fix mistakes or do quality control.

When entering data, I keep my right hand on the keyboard’s number pad, and my left hand on the Tab key. Hitting Tab moves you to the right in the spreadsheet (to the next question), and when you get to the end of each survey you hit Enter to move down to the start of the next row. Remember to keep an eye on the screen to make sure you are still entering data in the correct cells.


Now that you’ve familiarized yourself with the survey and set up your codebook and data entry spreadsheet, it’s time to start entering data! This is the part where I turn on a podcast or some music, and let my mind focus solely on the task of data entry. If you follow these steps, you might be surprised at how painless (and even relaxing) data entry can be.

In the next article, I will cover some more advanced survey data entry topics, such as entering complex question types and dealing with unclear responses.


Sign up for our newsletter

We’ll let you know about our new content, and curate the best new evaluation resources from around the web!


We respect your privacy.

Thank you!


Written by cplysy · Categorized: evalacademy

May 21 2020

How Writing an Evaluation Report is like Cooking


The process of writing an evaluation report is like cooking. It can be a joyful and meditative process for some and an annoying necessity for others. Both cooking and report writing take practice; the more you do them, the more you refine your processes and find your own groove. While there is no formula to create a perfect reporting process, there are some key steps that can set you up for success.

Get to know your audience

Pick your recipe

The process of cooking starts long before ingredients hit the pan. For most, cooking starts with picking a recipe. When you are cooking for others it’s important to figure out what they are hungry for. Is your audience hungry for a full meal, or do they only have time for snacks? Are they meat and potatoes kind of people or does risotto and lobster tickle their fancy?

Ideally, your evaluation plan indicates which information your audience needs to know and your evaluation framework closely ties the data sources to the evaluation questions that need to be answered. Knowing what your audience is expecting helps you narrow your focus in the report writing process. In addition, like cooking, reporting writing is influenced by time, budget, quality and availability of data (ingredients), audience preference, and your comfort and skill level. Develop an evaluation plan (recipe) that will optimize these factors and be prepared to make adjustments as you go along.

Get to know your data

Grocery shopping

Getting to know your data is like going grocery shopping. In the data collection period, things don’t always go to plan. The quantity and quality of your data can vary, just like the availability and quality of produce in the grocery store. In some cases, you can even outsource your data collection, just like online grocery shopping. In this case, it’s important to examine the data you received for quality and ensure you have the information you need to answer your evaluation questions. Take some time to understand what ‘ingredients’ you have and how they fit with your original recipe.

Analysis

Prepping your ingredients

Analysis has been referred to as ‘slicing and dicing’ data, a cringe-worthy term that fits delightfully into this report writing metaphor. In cooking, how fine or course your chop up your ingredients is directed by your recipe. How you prepare your ingredients is going to affect the final product. Again, like grocery shopping, prepping your ingredients can be done by a sous chef, but how it’s done will affect how you, as the head chef, produce a final product. The recipe you choose will give you a plan and starting place.

In report writing, your analysis should be guided by your evaluation plan. Your evaluation plan lays out the questions you aim to answer and the indicators you have collected to do so. As you analyze the data, keep in mind how you plan on presenting your data. While a data analyst may be analyzing the data for you, a clear path helps lead to clear results.

Regardless of when you consider your report structure, it’s important to consider how the information fits together as you analyze the data.

Outline, outline, outline

Make a Plan

Next up, make your plan. You have all the ingredients, they are prepped, but what order do you tackle things in? I must confess, this is where the cooking metaphor breaks down a little. In cooking, you aim to have all the components of your dish ready at roughly the same time so that everything is served hot. Because of this, you need to be aware of timings and have a game plan in mind of what to tackle, when. In report writing, the parallel isn’t so strong. The pieces of data don’t all need to come together in a time-ordered way. However, outlining your report (developing your game plan) is a valuable step to help your findings flow together. The processes of outlining your report helps you develop a strong narrative in your writing. A strong outline will help you to remember your guiding questions and key findings as you write.

Key considerations when developing a report outline includes examining how your findings fit together. Does your data flow well together, or do you need a way to cohesively present distinct pieces of information? How will your audience best digest the information? Sketching out the structure of your report provides the structure that allows your audience to follow your logic.

Write

Cook

I’ve spent a long time discussing the cooking steps that don’t involve the actual transformation of ingredients into a dish, and this is on purpose. Preparation is key. Having a recipe, the ingredients to make the recipe, prepping the ingredients, and having a game plan of how they are all going to come together is half the battle. These are all steps you can do in advance to make the cooking process less arduous. The same holds true for writing your evaluation report. Once you understand what your audience wants, what the data shows, and how you are going to piece it all together into a cohesive narrative, writing the sentence and paragraphs is much easier.

Just like everyone’s cooking process is different — some use every pot and pan in the kitchen and leave the cupboards open as they go, while others work meticulously and stepwise — everyone’s writing process is different. There are lots of articles and pieces of advice on how to write; common tips include “eat the frog first”, or “always stop writing for the day when you have more to say.” Engage in your reflexive practice and identify how and where you write best. If you get stuck, got back to your evaluation questions. These are your touchstones.

Cooking can be a constant flow back and forth between prepping your ingredients and cooking. Sometimes you may even find you need to run out to the grocery store for more of something. When you are cooking, it can be helpful to grab a second opinion to taste as you go along. Have you been too heavy-handed with some flavours? Have you drifted too far from the recipe? Is the product well balanced? These principles also apply to evaluation report writing. Sometimes as you write you may notice gaps in the data and need to collect more, or you may find you rely too heavily on one set of findings and neglect to give the other findings time to shine. Getting feedback from peers about what they take away from your report can help you make sure you are getting your key messages across.

Editing

Trim the Fat

Most people tend to dread the editing process. You have poured your energy into crafting the pages in front of you, but that effort won’t necessarily be appreciated as-is. It’s time to trim the fat. Be ruthless. Do you need each sentence, each piece of information? How much can your audience digest? How much detail do they really need? Turn back to your evaluation questions — how does the data you present answer the questions and how much detail does your audience need?

In the world of cooking, consider how hungry your audience is. Are they full and can only handle small tidbits of digestible information? Or are they ravenous and will eat a 7-course meal without complaint? Your evaluation report is no good if you are providing a 7-course meal and your audience is only interested in the main dish.

Visualization

Food Styling

I have left visualization for last, but I don’t believe it comes last, chronologically. Rather, it’s a topic all to itself that many others have touched on and can and should come throughout the process. Sometimes visualizing the data can be just as powerful as writing about it. A good visualization helps you to make your point and a bad one muddies the water and puts your audience to sleep.

At this point, you may be overwhelmed at the number of hats you are supposed to wear—from recipe developer, to shopper, sous chef, head chef, and now food stylist. Don’t be alarmed. You don’t have to be a pro chef to learn some simple tricks that spruce up your presentation, like twirling the plate, not the spaghetti, to create an Instagram-ready plate of spaghetti. There are lots of simple visualization tricks you can employ to make your presentation more appealing (like Evergreen Data and Depict Data Studio). People eat with their eyes first and in the world of evaluation reports, appearance can make a big difference.

Let’s be honest, this part is often a little rushed and is not the time to be developing the stylistic elements of your report. It is, however, the time to be tweaking them. Small things that make a big impact include: using colour selectively, adjusting your heading styles, and adding white space so your words can breathe. Use stylistic elements like colour, icons, and fonts to link ideas and make key points stand out.

The visualizing and stylistic components are the icing on the cake — considered frivolous or extra by some, the thing you usually run out of time for, and something that can take ages if you aren’t careful — but they are essential and what makes people interested in trying what you’ve made. No matter how good your meal tastes, if it doesn’t look good, people aren’t going to want to eat it. No matter how good the findings in your evaluation report are, if they are not presented in a way that’s intuitive to understand and appealing, they are unlikely to gain much traction.


Conclusion

It’s time for an apology. I promised to show you how writing an evaluation report is like cooking, and I spent the majority of the time explaining how to do everything else before and after the writing part. Hopefully you can see that writing evaluation reports is not just about writing the words that make up the report. It’s a process that starts as the evaluation plan is developed and continues as you collect and analyze data. A strong evaluation report starts with a strong evaluation plan. Like cooking, there are steps you can follow to make the report writing process easier. Developing your reporting style and process takes practice. Don’t be afraid to get feedback from your peers and clients and try to have fun with it!


Sign up for our newsletter

We’ll let you know about our new content, and curate the best new evaluation resources from around the web!


We respect your privacy.

Thank you!


Written by cplysy · Categorized: evalacademy

  • « Go to Previous Page
  • Go to page 1
  • Interim pages omitted …
  • Go to page 37
  • Go to page 38
  • Go to page 39
  • Go to page 40
  • Go to page 41
  • Interim pages omitted …
  • Go to page 43
  • Go to Next Page »

Footer

Follow our Work

The easiest way to stay connected to our work is to join our newsletter. You’ll get updates on projects, learn about new events, and hear stories from those evaluators whom the field continues to actively exclude and erase.

Get Updates

Want to take further action or join a pod? Click here to learn more.

Copyright © 2026 · The May 13 Group · Log in

en English
af Afrikaanssq Shqipam አማርኛar العربيةhy Հայերենaz Azərbaycan dilieu Euskarabe Беларуская моваbn বাংলাbs Bosanskibg Българскиca Catalàceb Cebuanony Chichewazh-CN 简体中文zh-TW 繁體中文co Corsuhr Hrvatskics Čeština‎da Dansknl Nederlandsen Englisheo Esperantoet Eestitl Filipinofi Suomifr Françaisfy Fryskgl Galegoka ქართულიde Deutschel Ελληνικάgu ગુજરાતીht Kreyol ayisyenha Harshen Hausahaw Ōlelo Hawaiʻiiw עִבְרִיתhi हिन्दीhmn Hmonghu Magyaris Íslenskaig Igboid Bahasa Indonesiaga Gaeilgeit Italianoja 日本語jw Basa Jawakn ಕನ್ನಡkk Қазақ тіліkm ភាសាខ្មែរko 한국어ku كوردی‎ky Кыргызчаlo ພາສາລາວla Latinlv Latviešu valodalt Lietuvių kalbalb Lëtzebuergeschmk Македонски јазикmg Malagasyms Bahasa Melayuml മലയാളംmt Maltesemi Te Reo Māorimr मराठीmn Монголmy ဗမာစာne नेपालीno Norsk bokmålps پښتوfa فارسیpl Polskipt Portuguêspa ਪੰਜਾਬੀro Românăru Русскийsm Samoangd Gàidhligsr Српски језикst Sesothosn Shonasd سنڌيsi සිංහලsk Slovenčinasl Slovenščinaso Afsoomaalies Españolsu Basa Sundasw Kiswahilisv Svenskatg Тоҷикӣta தமிழ்te తెలుగుth ไทยtr Türkçeuk Українськаur اردوuz O‘zbekchavi Tiếng Việtcy Cymraegxh isiXhosayi יידישyo Yorùbázu Zulu