• Skip to main content
  • Skip to footer
  • Home

The May 13 Group

the next day for evaluation

  • Get Involved
  • Our Work
  • About Us
You are here: Home / Archives for cplysy

cplysy

Apr 23 2020

Repost: Intentional Practice as Self-Care [During Coronavirus]

Updated April 23, 2020: I wrote and shared the following blog post about self-care almost two months ago in late February.  Coronavirus was in Seattle at the time, but I’m in New York, and the virus did not feel like a major threat to me or my work.  What a difference a couple of weeks would make, when on March 13 my world came to a grinding halt.  The allegory I shared in this post two months ago (about riding on an out-of-control horse) no longer feels relevant.  As many have already pointed out, Groundhog Day is a more apt story for the time we live in now.  On top of that, the threat of the pandemic to the museum profession (not to mention to our health and our social wellbeing) presents a new challenge, different from the wild horse, but similarly distressing.  My suggestion before for using Intentional Practice as a form of self-care feels just as, if not more, relevant now. 

If you only have a moment, read the bolded statement and items #1-3 below.  I think we will all have to find ways to ground and focus our work in ways that are less complicated and more purposeful than we were before coronavirus.  Riding a wild horse is not even an option now. 

Sometimes its okay to go slow
Credit: Mollycules


In recent years, self-care has emerged as a compelling idea among museum practitioners.  The sentiment is that, like so many in the not-for-profit world, museum workers are deeply passionate about the work they do and too often, they are overworked and feel underappreciated (and underpaid).  Burnout is high, and the need to take care of oneself—physically, mentally, and spiritually—is imperative, even though doing so may feel out-of-reach.  As a consultant who meets and interacts with many museum professionals across a variety of settings, I can attest to the truth of this. All the time I see museum practitioners who are so busy “doing, doing, doing” that they intermittently and inadvertently lose touch with the spark that drove them to museums in the first place.

I recently read a brief allegory that reminded me of this phenomenon. It goes like this: “I once saw a person riding very fast on a horse. As they rode by me, I yelled, “Where are you going?” The rider turned toward me and yelled, “I don’t know, ask the horse!”   The pace at which museum professionals are often expected to do their work, the number of different audiences they are asked to serve, and the amount of programming they are tasked with creating and providing can leave them feeling like a person riding that wild horse.

What if I told you that your museum work could focus on accomplishing one pursuit, and that one pursuit is something you are passionate about and excel at, and that by doing this work, you would make a positive difference in the lives of the audiences you serve?  This is the essence of Intentional Practice. 

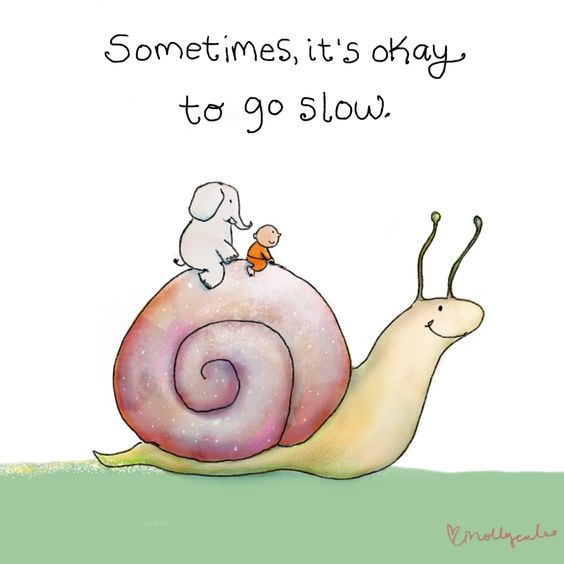
Intentional Practice means that all staff—from up and down and across the organization—take specific actions with the sole purpose of achieving a shared vision of intended impact on the audiences they serve. Transitioning an organization from the status quo to Intentional Practice is slow, as there are many moving parts and often unexpected distractions (insert wrench).  But, the beauty of Intentional Practice is its elegant simplicity, so while it is designed for organizations, individuals can also apply Intentional Practice concepts to their personal museum practice.

To return to the title of this post and the bolded statement above, I want to suggest three ways individual museum professionals can use Intentional Practice as a strategy of self-care.

  1. Prioritize your work to serve two or three audiences (one is even better if you can do that) rather than trying to be all things to all people. Then, focus in on the one specific impact you want to have on those audiences, with “impact” meaning the positive difference you make in the quality of their lives.  Write it all down—the audiences and the impact. Post it on the wall across from your desk.  Use it to continually remind yourself why you are there and to make decisions about where to put your energies and resources.
  2. To help you choose the audiences to prioritize and the particular difference you want to make in their lives, ask yourself “Why is working in this museum important to me?”—then ask, “Why is that important?” again, and again. You can do this alone or with a colleague.  The idea is to dig deep into what drives and excites you, what you care deeply about, and what gives you joy.  Use your passion to make decisions about #1, including helping you say “no” to tasks that move you off course.
  3. Ask yourself, “What am I really good at? What can I offer in my work that no one else can?”—be honest with yourself; do not respond with what you perceive as the “right answer.” Once you have identified what makes you unique in the workplace, draw from that to make decisions about how to serve your prioritized audiences in ways that make a positive difference in their lives.

Maybe this sounds like a pipe dream, like an impossibility.   And I’m not here to tell you it’s easy, especially trying to do it within an organization that has specific ways of functioning and operating.  As a first step, simply allow yourself to imagine a world where these three steps I’ve described can be your reality.  Make it your intention to return to this aspiration often (remember, post it on the wall to stare at as a reminder) and make decisions based on this aspiration.  In this way, you will be practicing self-care, which in turn will bring joy and renewed purpose to your work.

The post Repost: Intentional Practice as Self-Care [During Coronavirus] appeared first on RK&A.

Written by cplysy · Categorized: rka

Apr 23 2020

How much stress can a Lego® Bridge Handle?

https://www.flickr.com/photos/philaaronson/2463699246 licensed under CC BY 2.0

My six-year-old son currently is obsessed with the TV Show Lego Masters. Recently, the competitors had to build a bridge and test its structural integrity. The strongest bridges — of Legos®, mind you — withstood weight of 1000 pounds, and maxed out what the show would allow. The weaker ones only held 125 pounds — but they began to creak and show stressors with less than 40 pounds.

You already know where the cracks are

The teams had television-appropriate, dramatic reactions as they wondered what their bridge would support. But let’s be real: most contestants anticipated what they suspected to be true about their bridges, for better or for worse.

The memory of this episode, and specifically the clutching-at-the-heart-anticipation, came vividly back to me in a conversation with a colleague last week. The sudden switch to remote teaming was exacerbating fissures and stresses that already existed within their team, and that the manager had hoped would resolve.

You can only overlook those cracks for so long

In normal circumstances, those bridges look and often work just fine. We ignore the small fissures and keep working through them and we learn to ignore the occasional creak or crick. But the demand on teams to work under the extreme stressors like the ones we feel right now, much like adding 1000 pounds of weight to a Lego® bridge, can force the team to reckon with these potentially harmful fissures.

With reckoning comes possibility

My recent work with firms navigating this major, stressful change as their teams shift to remote working reveals unsurprising and yet equally powerfully discoveries. What’s unsurprising is the staff’s ability to acknowledge that the sudden shift is in many cases highlighting existing challenges, not introducing new ones; what’s compelling is how staff are demonstrating a willingness to step in, resolve the challenges, and make long-term changes. More than a few staff on teams have said, “This is forcing me to take steps that will ultimately serve my clients better.”

Consider this: right now is an incredibly powerful time to help your team look at its strengths and the fissures that keep them from forging ahead.

Written by cplysy · Categorized: betsyblock

Apr 22 2020

Behind the Scenes with Elissa Schloesser, One of My Favorite Information Designers

“My ultimate goal was to work with organizations to help them communicate those complex things in graphic form,” Elissa Schloesser told me.

Elissa’s one of my favorite information designers.

We’ve partnered on a number of projects over the years, from full-length technical reports to one-page summaries.

I recently interviewed Elissa about her career path. Data visualization is still a fairly new area. So many women working in data, like Elissa, have blazed their own career path. I always love hearing about how others got started and what they’re up to now.

You can listen to our conversation here:

What’s Inside: Elissa’s Career Path as an Information Designer

  • The difference between a “graphic designer” and an “information designer”
  • What Elissa is currently working on
  • How she creates static graphics
  • Elissa’s favorite types of projects–“I like to take really complex, messy things and create graphics for them”
  • The types of clients she works with
  • How long Elissa worked for herself
  • What she did before owning her own company (hint: it wasn’t in design)
  • How a dashboard changed her career trajectory
  • How she went from dashboards to longer term planning projects like logic models
Example of a project from Elissa Schloesser of My Visual Voice.

Elissa’s Tips for Working with Graphic Designers or Information Designers for the First Time

In the interview, we also discussed Elissa’s tips for working with a graphic designer for the first time.

In particular, Elissa “I find that if you spend time up front talking with your designer, you’ll get a much better result,” she said.

“You don’t have to know everything when you come to the table,” Elissa stated about partnering with information designers on data projects.

“It’s really hard for somebody to describe a look and feel… ‘I want an infographic’. What does an infographic mean? It can be playful and cartoony, or much more serious and technical graphic.”

Elissa described the type of examples you can share with an information designer at the beginning of a project and where to find useful examples.

Example of a project from Elissa Schloesser of My Visual Voice.

Connect with Elissa Schloesser

Connect with Elissa:

  • My Visual Voice: Myvisualvoice.biz
  • Twitter: @myvisualvoice  
  • Instagram: @elissavisualvoice
  • LinkedIn: https://www.linkedin.com/in/elissaschloesser/

Learn Even More from Elissa

Elissa’s a guest expert in our Great Graphs: Design Principles online training program, which opens for once-a-year enrollment between Monday, April 27, 2020 and Friday, May 1, 2020.

Written by cplysy · Categorized: depictdatastudio

Apr 21 2020

Four common data entry mistakes (and how to fix them)


You have developed your evaluation plan, written your questions, and deployed your tools. And now, you have just received your raw data. You are excited to jump in and analyze the data.

But wait.

You note several inconsistencies in the raw data. Three different date formats are used within the same column. You take a closer look and several categorical values are spelled and punctuated differently. Also, several cells contain both numerical and text data. And dispersed randomly across the spreadsheet are blank open cells.

These are a few common data inconsistencies we face as evaluators and analysts when receiving a fresh set of raw data. Data cleaning is often the first step, unless receiving the unicorn of all spreadsheets with perfect formatting, consistency, and accuracy. However, more likely than not, you will experience one or several of these data inconsistencies in your raw data.

This article addresses four common mistakes made with data entry and offers suggestions to improve data entry to increase the overall productivity and, let us not forget, happiness of your colleagues, collaborators, and evaluators.

Date Data

Many may think that “a date is a date,” but this is not always the case within a spreadsheet. When several date formats are used (e.g., 2020-04-13; April 13th, 2020; Apr 13, 2020), the spreadsheet, and your evaluator, may be confused trying to make sense of these values. In Excel, dates are stored in each cell as a numerical value and converted to a pre-selected date format. However, if text values are included with your dates, Excel may be unable to accurately interpret each cell entry.

Best case scenario: a few data points are missed when analyzing or visualizing your data.

However, this best case is not ideal when you, as an evaluator, are needing to present accurate results to your clients, such that they can digest and act on the results of your evaluation.

How do we improve date entry?

  • Enter dates in a YYYY-MM-DD format.

  • If you prefer a different date format (see Ablebits article for ideas on date formatting), be consistent. Dates entered consistently, regardless of format, are much easier to work with.

  • Consider using data validation to prevent improperly formatted dates or text from being entered into your spreadsheet.

  • Communicate with data entry personnel and agree on a single date format for data entry.

Text Data

For anyone that works largely with quantitative data, your heart may have just sunk as you read those two words: “Text data.” In this article, we are not talking about open-ended questions for our qualitative analyses (this may be a topic for another article). No, we are referring to text data in the form of Likert scales (e.g., Strongly agree to Strongly disagree) and categorical variables (e.g., gender, ethnicity).

But why does the thought of analyzing text data result in mild anxiety? It boils down to spelling and grammar. When cell entries vary in their spelling and grammar, your spreadsheet software may count each variant of a cell entry as a discrete value. Your five-point Likert scale now becomes a ten-point scale and your categorical response variables now has three unique variants for each potential response.

How do we ensure that text data is entered accurately?

  • Consider converting Likert scale data to numbers (e.g., Strongly agree = 1; Strongly disagree = 5).

  • Similarly, categorical variables can be coded as numbers (e.g., Female = 1; Male = 2).

  • If converting text data to numerical data, provide a guide to data entry personnel to follow (and for you to review when analyzing the data).

  • If you prefer to go the route of using text, consider using data validation. Lock cells to accept only values spelled correctly and avoid misspellings and other errors.

Multiple Values per Cell

It is tempting to include several pieces of related data in a single cell. You have created a spreadsheet and asked the person entering the data to record a few biometrics: height and blood pressure.

You ask that height be measured in centimeters. You receive the data and each result is entered with the unit “cm” at the end of each value. When glancing at the data, it is useful to understand the unit of measurement. However, this creates complications when analyzing the data. Your spreadsheet will read each height measurement as a text value. Try to complete a simple calculation and you will receive an error. Units are important but should be included in the column title rather than included with individual cell values.

Now for blood pressure. You are measuring systolic over diastolic blood pressure. A patient gets a reading of 120/80 and the value is entered under a single column titled “Blood Pressure”. While this may save a few seconds on data entry, this can complicate analysis as two values share a single cell. It is better to split the data into two columns: (1) “Systolic Blood Pressure” and (2) “Diastolic Blood Pressure”. Each cell should contain a single, discrete value. It is better to add an extra column to your spreadsheet than attempt to cram multiple data into a single cell. 

How do we avoid multiple values per cell?

  • Communicate with data entry personnel and explain that each cell should contain a single, discrete data value.

  • If a value has a unit of measurement, include the measurement in the column title and only insert numerical values into your cells.

  • With related data, split the results into two or more columns with each column relating to a single value (see Microsoft Office Support to see how to split delimited data into multiple cells in Excel).

  • Keep notes separate from raw data values. If you need to clarify or explain a value, add a separate column to include your note.

Missing Data

Now to address missing data. Missing data can come in many guises, from blank cells to NA’s to numerical place holders (0’s or 99’s). While each method of dealing with missing data has its merits, consistency in handling missing data is the key to clean data.

Within spreadsheet software, such as Excel, blank cells will not interfere with calculations. Looking to average a column? Excel will skip the blanks and average the present data. However, insert a numerical place holder, such as 0 or 99, and your averages will now be skewed by the presence of these values. It is possible to work around these place holders, but it is easy to forget about these place holders when working with numerical data as they are not immediately identified as missing values.

An alternate is to use NA to fill in the blanks. This makes it immediately clear that data is missing from the cell. However, a hiccup occurs if calculating values in Excel. Your calculations are likely to error out due to the NA’s present in your data. This can be worked around by excluding NA’s in your formulae. An advantage of using NA’s is when exporting your data to statistical software (such as R Statistical software), which are often designed to handle NA’s effectively. If you import your raw data into such software frequently, consider replacing missing data with NA.

How do we handle missing data?

  • Leave no cell blank. While blank cells may work for calculating values in your spreadsheet software, it is unclear whether these cells reflect an absent value (i.e., there is no value available) or that the cell was missed during data entry (i.e., human error).

  • Avoid using numerical place holders to code for missing data. These are easily overlooked and will skew data calculations.

  • Use a code like NA. While you may be required to adjust your formulae in your spreadsheet software, it will be clear that these cells represent missing data.

  • Additionally, NA works well with external statistical software. If you use your spreadsheets for data storage only, use NA as it will work best with your statistical software of choice.

  • Regardless of your choice, be consistent with coding missing data and communicate to data entry personnel on the preferred method. 

Conclusion

It is near impossible to eliminate all data entry mistakes; humans make mistakes. However, it is possible to be aware of common mistakes and create procedures to reduce data entry mistakes. Consistency and communication are key when sharing data between teams and collaborators. If everyone is on the same page, it is possible to reduce many of these mistakes. Address these mistakes early, and you will have much cleaner data to work with come analysis time. And clean data results in accurate, efficient, and actionable results.

Tips

  • Consistency. Consistently entered data will result in clean, readable data that will significantly improve the efficiency of your data analysis.

  • Communication. Communicate data entry protocols and codes to everyone that will interact with the spreadsheet.

  • Data validation. Consider using data validation to ensure that only valid data are entered into each cell.

  • One piece of data per cell. Each cell should contain a single, discrete value. If you have related data, consider splitting the data into multiple columns.

  • No blank cells. Missing data can cause issues in data analysis. Find a code to represent missing data and use it consistently throughout your data.

Further reading

Date formatting: https://www.ablebits.com/office-addins-blog/2015/03/11/change-date-format-excel/

Split text to multiple columns: https://support.office.com/en-us/article/split-text-into-different-columns-with-the-convert-text-to-columns-wizard-30b14928-5550-41f5-97ca-7a3e9c363ed7


Sign up for our newsletter

We’ll let you know about our new content, and curate the best new evaluation resources from around the web!


We respect your privacy.

Thank you!


Written by cplysy · Categorized: evalacademy

Apr 21 2020

Dear evaluators, it’s time to blog!

This post is my plea to you. Please start blogging.

As conferences cancel…

It doesn’t take too many clicks to see that COVID-19 is impacting our field’s ability to communicate with one another. All you really have to do is visit Better Evaluation’s events page and start clicking to see all that is now postponed or cancelled.

The EERS board regrets to announce that it is necessary to cancel what would have been our 43rd annual conference.

http://eers.org/

UK Evaluation Society Annual Conference 2020
*** regrettably cancelled due to Coronovirus ***

https://www.evaluation.org.uk/event/annual-conference-2020/

Considering the very important public health issues at hand, the CES has decided to act prudently and to postpone the deployment of its 2020 conference initially planned for June 13-17, 2020. C2020 will become C2021!

https://c2020.evaluationcanada.ca/

It is with regret that in order to protect our ANZEA wh?nau, and given the extraordinary volatility of the current environment, the ANZEA Board has taken the decision to postpone the ANZEA conference scheduled for July.

https://www.anzea.org.nz/anzea-conference-2020/

aes20 conference postponed due to COVID-19 pandemic
This year’s conference has been postponed and will now be held at the Brisbane Convention Centre from 27 September to 1 October 2021.

https://conference2020.aes.asn.au/

Of course it’s the right decision. Anything in the near future involving travel and crowds needs to be nixed for everyone’s health and safety.

As for why they don’t just go digital? Here’s a secret, if you don’t know how to organize, structure, and produce large digital events, it can be really hard and really expensive.

And for the last decade most associations have been approaching digital as a nice to have or added bonus, not an essential backup. In other words, the heavyweights are just not prepared to go all in on digital.

Is the field of evaluation non-essential?

I don’t think so.

It’s like education. It gets put on pause for a minute before we start to realize that hey, this is really important.

The world is changing before our eyes and far more rapidly than most would like. And the return to quasi-normalcy still doesn’t seem imminent. When times are tough, many of the programs we support with our expertise and methods are likely to become endangered.

In an uncertain world, giving sometimes turns into hoarding and defunding. Effective interventions get put on the back burner. And sometimes they go away entirely.

There is a harsh reality that underwrites our profession.

Like it or not, funding and attention is finite. Hard decisions will be made. And effectively using evidence to influence those decisions is one of our primary roles.

As a profession this is not the time to stop connecting with one another.

Blogging is a form of presentation.

Blogs are not like mini-journals.

They’re more like mini-presentation rooms. Room that don’t require a physical space and scheduled time to exist.

Blogging is presenting.

And in a field as practical as our own, presentations matter.

Just think about your last presentation. Could you turn into a blog post? Or maybe a few blog posts?

What about that presentation you were planning to give at a now cancelled conference? In your head, has that presentation idea been cancelled that too?

Your expertise has value, it can still be shared. Our field still needs you to share.

Creating your own presentation room.

This part is super simple.

Don’t over think it. Seriously, don’t over think it.

Go to wordpress.com, click “start your website,” and follow the prompts.

The design doesn’t matter right now. You can change it at any time, I change my designs all the time. You can just use your name for the blog title. The about page also doesn’t matter. Write something simple.

Your goal. Setup the basics so you can write a post and hit publish.

Blogging is actively presenting.

You just need to do it.

Amplifying your reach.

Once you have a presentation, then you need an audience.

Blogging is not like a webinar or any other kind of live presentation. You don’t need the audience before you give the presentation.

Easiest way to reach people is to just reach out to friends/colleagues. Share the link for your new post. Then hit social media.

I always encourage evaluators to use twitter, because a lot of evaluation bloggers use twitter. And evaluation bloggers like helping other evaluation bloggers reach audiences.

Your blog here?

Relaunching the Eval Central Blog of Blogs

Over a decade ago I started eval central as a blog of blogs. For the last few years I’ve experimented with new formats.

The forum is cool and so is the series of unwebinars I started. But the more I have reflected the more it has become clear to me that we need the blog of blogs.

This is how we amplify indie presenters.

By connecting a bunch of evaluators who blog into a single megablog we can leverage the shared audience it creates. This creates a platform we can then use to amplify new voices.

After I auto connect the blogs, I auto connect the evalcentral twitter account. Now whenever anyone in the network blogs, it then gets tweeted to evalcentral’s over 4,000 followers.

So here it is, the brand new Eval Central Blog of Blogs: blog.evalcentral.com.

I’ve started bringing together some established indie evaluation bloggers. Now I just need you. You’ll find a link to submit your blog on the site.

Support Me?

This blog, the cartoons, the evalcentral forum, the evalcentral unwebinars, and the evalcentral megablog are my ongoing professional contribution to the evaluation field I love.

But ultimately it’s not cheap and I am just an indie evaluator/designer. So if you like my work, please consider becoming a Patron.

Written by cplysy · Categorized: freshspectrum

  • « Go to Previous Page
  • Go to page 1
  • Interim pages omitted …
  • Go to page 269
  • Go to page 270
  • Go to page 271
  • Go to page 272
  • Go to page 273
  • Interim pages omitted …
  • Go to page 304
  • Go to Next Page »

Footer

Follow our Work

The easiest way to stay connected to our work is to join our newsletter. You’ll get updates on projects, learn about new events, and hear stories from those evaluators whom the field continues to actively exclude and erase.

Get Updates

Want to take further action or join a pod? Click here to learn more.

Copyright © 2026 · The May 13 Group · Log in

en English
af Afrikaanssq Shqipam አማርኛar العربيةhy Հայերենaz Azərbaycan dilieu Euskarabe Беларуская моваbn বাংলাbs Bosanskibg Българскиca Catalàceb Cebuanony Chichewazh-CN 简体中文zh-TW 繁體中文co Corsuhr Hrvatskics Čeština‎da Dansknl Nederlandsen Englisheo Esperantoet Eestitl Filipinofi Suomifr Françaisfy Fryskgl Galegoka ქართულიde Deutschel Ελληνικάgu ગુજરાતીht Kreyol ayisyenha Harshen Hausahaw Ōlelo Hawaiʻiiw עִבְרִיתhi हिन्दीhmn Hmonghu Magyaris Íslenskaig Igboid Bahasa Indonesiaga Gaeilgeit Italianoja 日本語jw Basa Jawakn ಕನ್ನಡkk Қазақ тіліkm ភាសាខ្មែរko 한국어ku كوردی‎ky Кыргызчаlo ພາສາລາວla Latinlv Latviešu valodalt Lietuvių kalbalb Lëtzebuergeschmk Македонски јазикmg Malagasyms Bahasa Melayuml മലയാളംmt Maltesemi Te Reo Māorimr मराठीmn Монголmy ဗမာစာne नेपालीno Norsk bokmålps پښتوfa فارسیpl Polskipt Portuguêspa ਪੰਜਾਬੀro Românăru Русскийsm Samoangd Gàidhligsr Српски језикst Sesothosn Shonasd سنڌيsi සිංහලsk Slovenčinasl Slovenščinaso Afsoomaalies Españolsu Basa Sundasw Kiswahilisv Svenskatg Тоҷикӣta தமிழ்te తెలుగుth ไทยtr Türkçeuk Українськаur اردوuz O‘zbekchavi Tiếng Việtcy Cymraegxh isiXhosayi יידישyo Yorùbázu Zulu