• Skip to main content
  • Skip to footer
  • Home

The May 13 Group

the next day for evaluation

  • Get Involved
  • Our Work
  • About Us
You are here: Home / Archives for cplysy

cplysy

May 30 2023

How to combine data from multiple sources for cleaning and analysis.

This article is rated as:


As a data analyst in the world of evaluation, much of my work at Three Hive involves combining similar datasets from multiple sources into one master file to analyze them in aggregate. For example, a recent project of ours involves combining patient experience data collected at two sites, one in the North and one in the South, to analyze together. Although both sites use the same survey questions, each site asks the questions in a different order and store their data slightly differently, which means merging these datasets takes a few extra steps. While I don’t believe there is a wrong way to merge datasets in situations like this, there are certain steps that I like to take to set myself up for a straight-forward analysis process. In this article, I’ll walk you through the steps I take when working through a task like this using a fake dataset as an example.

1) Before you start…

  • Pick an analysis program. The analysis program you use will impact some of the decisions you need to make about your data, so it is good to decide what you will be using as early in the process as possible! The program you use for data prep doesn’t need to be the same program that you conduct your analysis in, but it should be one that you are familiar with. For most of my analyses, Excel is usually powerful enough to do the trick, but you can choose whichever program you are most comfortable with as long as it allows you to explore the data and make changes where needed.

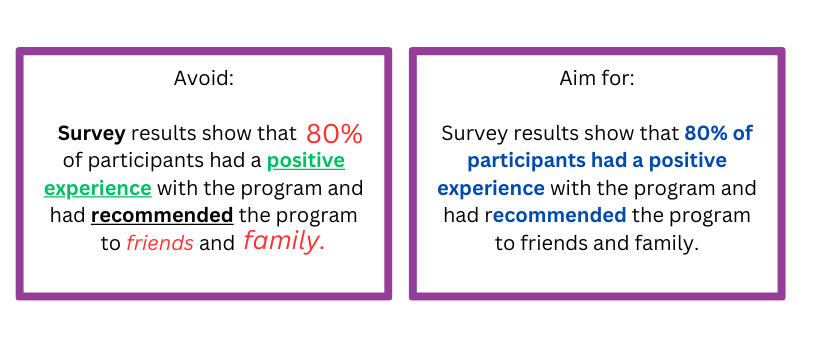
  • Start a ‘data diary’. This step might not be necessary if your data set is small and simple, but I find that it’s helpful to record the steps I take in cleaning so they can be easily replicated in the future or adjusted if I realize I’ve made a mistake (which happens more often than I’d like to admit!). Lately, I have been using a tab on the project’s OneNote in our online work environment, but you can use any word-processing software that you prefer for this. In the past I have used physical notebooks as a data diary but found that this made it much harder to collaborate and share my process with the rest of my team. Whenever possible, I suggest using online documents that you can share across your notes with the project team!

    • Within your data diary, start preparing a data dictionary – this is where you can take notes about the variables in each data set as you explore your data. To learn more, check out our article on Data Dictionaries!

2) Explore your data (and take notes)

  • Explore your individual datasets. Work through each data set individually to understand what data was collected, and how it is displayed in your data processing software. I find it useful to create a list of the main variables in each dataset and write a short blurb about each in my data diary. This gives me a good overview of the data I will be working with and allows for easy comparisons in the next step of the process.

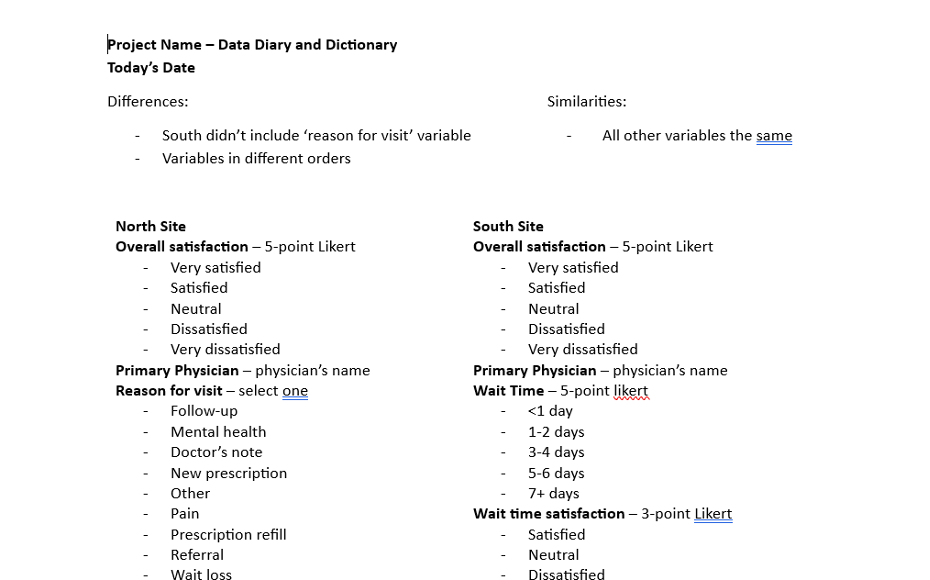
  • Compare similarities and differences. After exploring and making notes on each dataset individually, I compare my notes to find similarities and differences between them. In the project that involved combining data from the North and South sites, I noticed that both sites had the same main variables but that they were in a different order, and that the North site collected one extra piece of information than the South site did. For this project, my data diary and dictionary looked something like this after exploring and comparing the data:

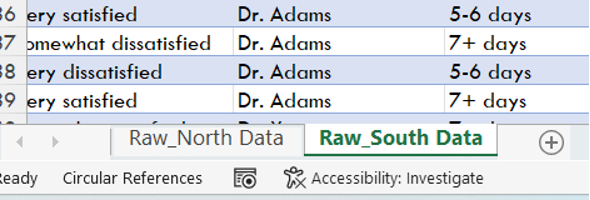
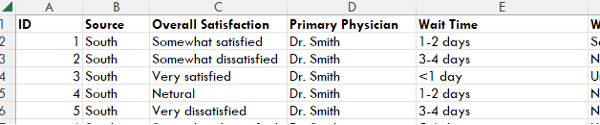
3) Prepare your original data. When I combine data in Excel, I like to copy and paste each individual dataset into a separate tab of an Excel workbook, like this:

Next, I assign identifiers to the individual data sets. This will allow me to link the responses from the master dataset to the original datasets if I need to make changes in the future. To do this, I create two new variables for each original dataset by inserting columns in Excel by right-clicking on the column header and selecting ‘Insert’ from the pop-up menu.

After inserting two new columns to the left, I will give them the titles of “ID” and “Source”

  • ID: This variable will assign a unique numeric value for each observation (row) of data within each original dataset. To do this quickly in Excel, you can type 1 in cell A2 and 2 in cell A3, then select both A2 and A3 and double click on the small green triangle at the bottom left of your selection to autofill the rest of the rows, like this:

Source: This variable will be used to differentiate each observation (row) of data in the master dataset depending on which site it came from. To do this, I will label all the data in the North site dataset as “North” and all the data in the South dataset as “South”. When we eventually combine all the data into one mater dataset, this will allow me to easily determine which site each piece of data came from.

Repeat this process for each individual dataset you have, being sure to assign a different ‘Source’ name for each dataset. Each dataset should now look something like this:

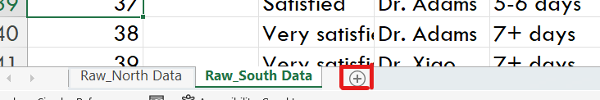
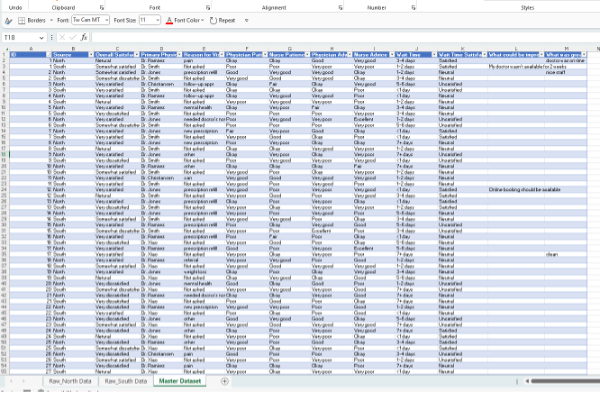
4) Prepare your master dataset. Once I have gone through and compared the variables in each data set to determine which can be combined and which cannot, I create a new worksheet using the ‘+’ sign to the right of my workbook tabs to lay out the variables that will be in my master dataset.

At this point, there are a few decisions to make!

  • In our example, the North and South sites organized their variables in different orders. I like the way the North site ordered their variables, so I will use their ordering, but you can choose what works best for you.

  • The North site also collected information on the reason for each respondent’s visit to their doctor, which the South site did not collect. You may choose to include or exclude variables that aren’t present in all datasets depending on what types of questions you are hoping to answer. In this case, it could be useful to see if wait times for patients varied depending on the reason for their visit, so I will include the ‘Reason for Visit’ variable even though the South site did not collect that information.

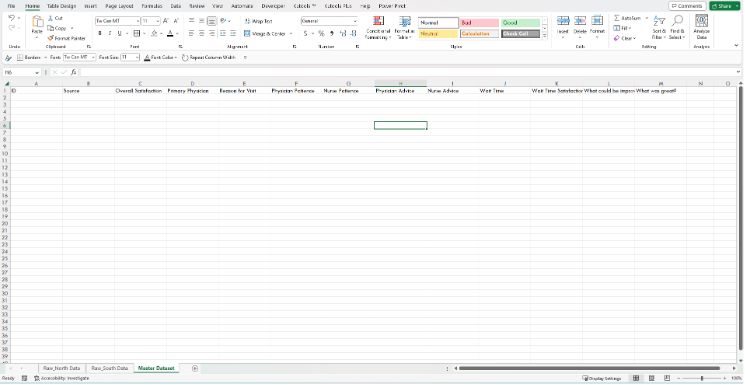
Once you have decided which variables you will include in your master dataset, and in which order, you can start typing out the variable names as headings in row 1 of your master dataset worksheet. Your workbook should now look something like this:

Convert your master dataset outline into a table for easy sorting for our next step by selecting the headers and one row down, clicking ‘Insert’, ‘Table’, checking the ‘My table has headers’ box (if it isn’t already checked), and ‘Ok’.

5) Combine your data. All that’s left now is to combine the data from our original North and South datasets into our master dataset! To start, copy all the ID and Source values from each original dataset and paste it into the ID and Source columns of the master dataset. The table you made in the last step will automatically update to add in all the rows of data you have just pasted.

For the rest of the data, the way you choose to add it to your new master data table will depend largely on the size and complexity of the dataset.

  • For small datasets like in our example, it can be as easy as copying data from one variable at a time and pasting it into the corresponding column in our master dataset, double-checking that you are pasting the data into the correct column and rows each time.

  • Since the South site didn’t include a ‘Reason for Visit’ variable, I added in a value of ‘Not asked’ which will be more helpful to me during analysis than leaving those fields blank.

*Tip: If you’re like me and tend to get lost in your head when working through repetitive tasks like this only to question what you did later on, I have found it helpful to voice record myself narrating each step as I do it. Once I have finished the copy-and-pasting of data, I replay my voice recording and type out what I did into my data diary. This way, I never have to question if I *actually* pasted all the data from all the sources I needed to!

  • For larger or more complex datasets, you may need to use a function like XLOOKUP or the PowerQuery tool to avoid spending too many hours copying and pasting data across sheets. Keep an eye out on Eval Academy for our upcoming article on PowerQuery for beginners to learn more! In the meantime, here is a useful article on the XLOOKUP function for multiple criteria by MyExcelOnline: https://www.myexcelonline.com/blog/xlookup-with-multiple-criteria/

6. You’re ready to clean! Once all the relevant data has been copied and pasted from all source datasets into your master dataset, you are ready for data cleaning. Check out our Data Cleaning Toolbox article for guidance on cleaning your new master dataset!

It can be intimidating to try combining datasets that aren’t perfectly aligned, but by taking some extra time at the beginning to understand the data you have and the result you are aiming for, you can create a clear road map for yourself and your team! Not only can this help to make the process much smoother, but it may also inspire new ways of analyzing and describing the data.


Let us know how you find this process in the comments below!

Written by cplysy · Categorized: evalacademy

May 30 2023

How to spot common budgeting pitfalls.

This article is rated as:


Evaluations of any size tend to need to adhere to budgets, whether for financial or human resourcing constraints. There are certain pitfalls that can quickly derail your budget. Where possible, it’s important to clarify these during project scoping (check out our article here). This article will guide you through some of the most common budget pitfalls to help you plan and support you to stay on budget throughout your evaluation.

Frequent meetings.

Meetings are part of any project and are important for building relationships, understanding context, getting buy-in, and gathering or sharing information. However, meetings, especially over a long period of time can quickly eat away at your budget. So how can you tell if you need to budget more money or time for meetings? Typically, the early stages of an evaluation for a simple project will need 2-6 meetings to set up the evaluation and develop data collection tools, then often monthly or quarterly touch base meetings. So, what clues suggest that meetings might take up more of your budget? Some things to watch out for include: 

  • Many people or organizations involved

  • Participatory evaluation methods

  • Complex or rapidly changing projects

    • Or those with lots of detail or context

  • Projects that continue over a long period of time

  • Meetings that focus on the minutia, where lots of discussion is required, often go off track. This is not necessarily a bad thing, but if you notice a team likes to delve into deep discussions in meetings, they might take more time or you might need more meetings than you originally thought.


Travel.

While the shift to virtual meetings and a greater reliance on virtual tools can reduce your travel budget, there are certain things that are easier in person. Travel can quickly eat up your budget if you haven’t accounted for it fully. Mileage or car rentals, insurance, per diems, hotels, and even just the time to travel to a meeting, chat afterwards, and travel back can add up quickly. Typically for a virtual meeting, we budget time for 15+ min of prep or wrap up on either end of a meeting. Adding in travel and time to find parking can easily add an hour or more to that estimate.


Participant honorariums.

Valuing your participants’ time and knowledge is important, but it can be tricky to get it right. You may want to consider compensating participants for providing guidance, their time in meetings, answering surveys, participating in interviews or focus groups, or supporting data analyses. Make sure you check out what the going rate is for providing incentives or thank you’s to participants and who is responsible for footing that bill.

To learn more, check out our article: Incentives for participation in evaluation


Administrative data analysis.

Administrative data can be a real doozy. Evaluations may rely on situations where we are using data collected by others or working within data collection systems (like electronic medical records, for example) where we don’t have much influence on how the data are collected or what the data export looks like. It’s tricky to estimate how long it will take to piece together disjointed data. Entering, cleaning, and understanding these data can quickly eat up a lot of time without you noticing.

To learn more, check out our article: New Checklist: Information request checklist


Surprises and re-work.

Ah, yes, the unpredictable joys of surprises, or re-work. In addition to data analysis taking up extra time, surprises like incomplete data sets or extra data that no one told you about can quickly throw your budget off track. Assumptions made during the data collection and analysis processes that aren’t clarified with the project team can lead you to re-do some of your analyses or sensemaking. And sometimes, key pieces of information can get lost or forgotten in translation, requiring you to re-do work that you’ve already done. Another surprise that can impact your budget is when timelines are condensed; in these cases, you may need to use more evaluators to get the work done quickly. More evaluators mean more project management time, including getting everyone up to speed and keeping them on the same page.


Endless report edits.

You know the ones. Often this happens when many stakeholder groups are involved, or the report sits for a long time before people provide feedback. Sometimes your report can get stuck in editing wars as people debate the use of the Oxford comma or wordsmith paragraphs ad infinitum.


Scope Creep.

When I think about scope creep, I imagine some nefarious project manager demanding more work that’s outside of our contract or scope of agreement; however, scope creep often happens in a much more subtle and less evil way. Many times, scope creep just sort of happens, without either party necessarily realizing they are drifting outside the bounds of their agreement. Maybe you only budgeted for one report, but then the team realizes there’s an opportunity to present to leadership who will respond best to something tailored specifically to their interests. Or perhaps the project team realizes that the staff survey they’ve been running for years and forgot to mention when you were planning the evaluation might hold insights that could support your evaluation.

To learn more, check out our article: Scope Creep: When to indulge it and when to avoid it


At the end of the day, estimating an evaluation budget and then monitoring if you are on track are important parts of managing an evaluation. We’ve found that budget management can be more difficult for the smaller, “simple” projects as a lot of the items that can quickly derail your budget are project management issues, which are the same for small projects as they are for large ones. Where possible, it’s nice to add in a ‘contingencies’ line to a budget to give the evaluation some breathing room. By keeping an eye out for common issues that can derail your budget, you will be better prepared to identify and manage these issues.

If you’re interested in learning more about budgeting for an evaluation, our Program Evaluation for Program Managers course contains a handy budget template, along with other helpful evaluation planning and implementation knowledge.

Written by cplysy · Categorized: evalacademy

May 30 2023

5 tips for ensuring interviewer safety.

This article is rated as:


At Eval Academy, we’ve discussed the importance of ethical practice when collecting qualitative data including obtaining consent and maintaining confidentiality and anonymity. Many of our previous conversations have focused on the need to ensure the safety and well-being of participants.

In this article, we highlight the importance of also ensuring interviewer safety to make the interview experience effective for collecting data and a positive experience for everyone involved! Here are our 5 tips for safeguarding the interviewer:

1.     Conduct a pre-interview risk assessment.

Before starting your interviews, it’s important to assess potential psychological risks associated with the discussion topic or participant characteristics. Take some time to evaluate factors such as sensitive topics, the possibility for emotional distress, or power dynamics that might arise during the interview process. This assessment will help you to identify potential challenges that might occur and provide you with the opportunity to develop strategies to address them. If you work as part of a team, engage them in a discussion about potential psychological concerns you have, including any personal impacts or triggering situations you might find yourself in.

2.     Establish clear expectations and guidelines.

The purpose, scope, and expectations of the interview process should be clearly communicated to participants before they consent to take part. This includes sharing information on the topics that will be covered. As well as knowing the purpose of the interviews, participants should be fully aware of their rights, confidentiality measures, and the voluntary nature of the interviews. Sharing documentation beforehand in a way that is appropriate to your participants will manage their expectations for the session and allow you to establish guidelines for respectful communication, confidentiality, and appropriate behaviour throughout the interview process.

3.     Conduct the interview in a safe and secure location.

Prior to the interview, take time to assess the physical risk and safety of the interview location. Choose a location that ensures the safety and privacy of both you, the interviewer, and the participant. If completing the interviews virtually, ensure you have access to a quiet and private location where you can easily access any documentation and support systems you might need. For virtual interviews, encourage the participant to take the call in a location where they can have some privacy. If conducting in-person interviews, select a neutral and comfortable space that allows for confidential conversations.

If you are not able to select the location of the interview, assess the context of the location to examine how much you know about where you will be conducting the interview and other safeguards that can be taken. This includes ensuring there is an available staff member to check in on the interview periodically, ensuring you’re aware of exit points and doorways, assessing the space for objects that could be used as weapons, and knowing how to navigate the neighbourhood safely. During the interview itself, be prepared to take note of what the participant is wearing and how they’re positioning themselves, as well as anyone else who is at the location.

4.     Have an emergency plan in place.

Based on your pre-interview risk assessment, you should prepare for potential emergencies or distressing situations.

An emergency plan for the interviewer: Identify your own emergency contact, such as the project leader. It can be useful to make a list of potential scenarios that might arise from the interviews and develop an action plan of how you would address them. Be prepared to respond calmly and compassionately in distressing situations.

An emergency plan for participants: Develop an emergency plan that includes contact information for relevant authorities or support services for participants. Familiarize yourself with appropriate resources such as helplines or counselling services and be prepared to provide this information to participants if they require assistance. Printing this information on handouts can ensure it is easily accessible to participants.

5.     Establish a debrief and support system.

Don’t be afraid to ask for support! Recognize that conducting interviews, particularly on sensitive topics, can affect the emotional well-being of both interviewers and participants. Establish a debriefing process with a colleague or a mental health professional to create space to discuss any challenges, emotional impact, or concerns.


As interviewers, it’s our responsibility to prioritize the safety, well-being, and ethical inclusion of participants. By conducting a pre-interview assessment, setting clear expectations, assessing the physical risk and safety of the interview location, having an emergency plan in place and knowing how to use it, and establishing support systems, we can ensure the interview process is respectful, ethical, and valuable for everyone involved.

For more information and resources on conducting interviews, check out:

  • How to conduct interviews

  • How to transcribe interviews like a pro

  • How to use Calendly to schedule interviews like a pro

  • Tips for conducting interviews

  • Standard interview templates bundle

Written by cplysy · Categorized: evalacademy

May 30 2023

New Infographic: 10 tips for designing quality reports!

This article is rated as:


Eval Academy just released a new infographic, “10 tips for designing quality reports!”

Many of us have come across reports that feel cramped, unengaging, and let’s face it, a little bit boring! Dedicating some time to designing your report before writing can significantly affect its overall quality. By taking some time to focus on design, you can create a report that is not only refined and professional, but also visually appealing.

Back in November 2022, we shared five elements to include in your reporting style guide. In this article, I dive a little deeper as I  reflect on my recent experience of designing an engaging and visually appealing report for a Three Hive Consulting client. You can download the infographic here – I recommend printing it and keeping it in sight to help you keep design in mind when writing your next report!

Before we jump into it, I recommend checking with your client or organization to see if they have set branding, including fonts and colours, that they would like you to use in reporting. If so, integrate that into each of the following steps.

1)    Pick a colour scheme and stick to it.

  • This includes colouring for fonts, quotes, visuals, graphics, and cover and end pages.

  • Consider the content of the report and the tone you want to portray. How do your chosen colours support that message?

  • Use a colour wheel to find complimentary colours.

  • Stick to a limited colour palette. I’ve found that 3 different colours tend to work best.

  • Consider the accessibility of your colour palette. Is it colour-blind friendly? Or do the colours have cultural significance you should be aware of? There are a number of tools available online that provide further information on colour-blind friendly palettes and how to choose colours:

    • Colouring for Colourblindness

    • The Best Charts for Colourblind Viewers

    • Colour Brewer

  • Microsoft also has tools available to help you pick colours from any application you have running and copy them in a configurable format to your clipboard! You can learn more about Windows PowerToys Colour Picker here.

2) Use consistent fonts.

  • This includes consistent font styles, sizes, and colours from your colour scheme.

  • Choose easy-to-read font styles such as Serif (e.g., Times New Roman, Georgia, Cambria) and Sans Serif (e.g., Arial, Helvetica, Calibri).

  • For body text, avoid using too many styles such as bold, italicized, or underlined which can make a report look cluttered. See below for an example:

3)    Use clear sections that tell a story.

  • This includes using page breaks, headings, and sub-headings to make it easier for readers to find information.

    • Headings should be clear and descriptive to help readers quickly understand what each section is about and how it relates to the overall story.

    • Use different fonts to distinguish between headings, sub-headings, and content.

      • Pick one font for headings. This should be large and easily distinguished when skimming. Using a block of colour can help people quickly identify a high-level heading.

      • Pick one font for the body text.

        • Vary the font size, bolding, and italics in a consistent manner to delineate different heading levels.

  • Clear sections help to organize information in a logical way to improve readability.

  • Consider using a table of contents with hyperlinks to make finding sections that bit more efficient!

4)    Use bullet points and numbered lists.

  • This can include using icons within lists to make them more eye-catching.

  • Bullet points and lists help to highlight important points, improve how information is structured, and emphasize information.

  • They can also help to make complex information easier to read and understand.

  • Bullet points and lists can save space in a report, whilst also adding more white space!

5)    Include visuals.

  • Charts, graphs, and other visual aids can help make data easier to understand and can make the report more interesting. For example, take a look at our article 3 Easy Ways to Quantify Your Qualitative Data.

  • Choose the right type of visual aid depending on the type of information you’re presenting as mentioned in our articles 7 Tips for Better Data Visualizations and Dial Down Your Data.

  • Make sure visuals are high-quality, simple, and formatted consistently – for more information, take a look at our article Chart Templates: The Time Saver You Should Be Using.

  • But don’t rely solely on visual aids, they’re there to support the information presented in the report!

6)    Embrace the white space.

  • White space, also known as negative space, refers to the blank or empty areas in a report.

  • The trick is not to cram too much information onto one page! Use white space to break up long paragraphs or chunks of text and create sections to make it easier for readers to scan and digest the information presented.

7)    Check your margins and spacing.

  • Checking margins and spacing for consistency ensures visual appeal and readability. It also helps to avoid clutter and ensures the report stays aligned when printing and sharing.

8)    Utilize the grouping tool.

  • The grouping tool in Microsoft applications allows you to group related objects together. This can be useful for organizing content in a logical and visually appealing way.

  • Grouping allows for easier editing, more control over design, and can improve efficiency!

9)    Create templates and start early.

  • Whether you’re creating your report in Microsoft Word or PowerPoint, before you even start writing I recommend creating a template that combines all of these elements! This will save you time when you’re writing, ensure consistency, and allow you to have greater control over the design.

10)    Proofread, again and again!

  • Last but certainly not least, proofread your report multiple times! I like to proofread first for content, spelling, and grammar, and then again for formatting. Take a break between these different sessions to help you look at the document with fresh eyes.

  • Ask a critical friend or colleague to proofread. No matter how thorough you are, there’s always that one typo that slips through the cracks!


For more information on report writing, check out the following Eval Academy links:

  • Six hacks for renovating your evaluation report Part1: Take them on a journey 

    • Part 2: Consistency is Cool

    • Part 3: Practice Proximity

    • Part 4: Make it pop!

    • Part 5: Photo Love

    • Part 6: Dial Down Your Data

What are your tips for designing quality reports? Share them in the comments below.

Written by cplysy · Categorized: evalacademy

May 28 2023

AEA Conference 2022

Preconference Workshop: Transformative Mixed Methods: Supporting Equity & Justice by Donna Mertens

A key reason that I decided to take this pre-conference workshop was because I wanted to learn from Donna Mertens. I really like her writing and wanted to have a chance to learn from her in person. She did not disappoint! While I didn’t find there was much about mixed methods, per se, there was a lot about transformation, equity, and justice. Here are some things I learned/re-learned:

  • In France there is a law against the government collecting data on race. It comes from WWII when government data on Jewish people facilitated the ability to send Jewish people to concentration camps.
  • Ethics is the start of every decision we make in evaluation.
  • If you are not challenging oppressive structures, you are complicit in the status quo.
  • You can challenge your client/commissioner – e.g., if they ask for a survey for a summative evaluation, you can ask them if that’s really going to be transformative.
  • mixed methods – what is the synergy between the quant and the qual? what do you gain by bringing quant and qual in dialogue with each other?
  • transformative paradigm
    • axiology (i.e., nature of ethics & values) – culturally responsive, promotes social/environmental/economic justice and human rights, address inequities, reciprocity (what do you leave the community so they can sustain the change when the evaluator leaves?), resilience, interconnectedness (living & non-living), relationships
    • ontology (i.e., nature of reality) – reality is multi-faceted, historically situated, consequences of privilege
    • epistemology (i.e., the nature of knowledge & relationship between knower and that which would be known) – interactive, trust, coalition building
    • methodology (i.e., nature of systematic inquiry) – transformative, dialogic, culturally responsive, mixed methods, policy change as part of methodology
  • transformative mixed methods design:
    • Build relationships
      • often historical experiences of research/evaluation that are extractive and oppressive; researchers need to earn trust
      • identifying existing community actions groups and understand the history of their efforts; identify formal & informal leaders; identifying community needs/gaps/strengths/assets
    • Contextual analysis
      • cultural, historical, political, environmental, legislative, power mapping
      • policy analysis (what’s written and unwritten; what’s written by not enacted)
    • Pilot interventions
      • collect data, make mid-course corrections
    • Implement intevetnion
      • collect data for proces evaluation
      • collect data on unintended/unanticipated outcomes
    • Determine effectiveness
      • outcome evalaution
    • Use findings for transformative purposes
      • include in contract the importance of working with the community – from relationship building at the start all the way through to sharing the findings at the end
      • if the community is involved throughout the evaluation, they will already know the findings and will not need to wait for the final report to find out (also, reporting findings along the way will make sure you are reporting data back to community in a reasonable time)
  • You can say that you’ll work with an expected goal of reducing inequities and increased justice and that you’ll work in respective ways; you can’t guarantee that you’ll make things better and can’t guarantee you won’t cause harm, because we don’t know what will happen
  • http://transformativeresearchandevaluation.com/

Opening Plenary: Re(Shaping) Evaluation: Decolonization, New Actors, & Digital Data. Edgar Villanueva interviewed by Nicky Bowman.

Villaneuva wrote the book Decolonizing Wealth. I will admit that I have this book in my big pile of books to read, but hadn’t got around to reading it! After hearing this keynote, I’m even more excited to read it. Here are some things he said during the keynote that resonated with me:

  • we learned the names of the colonizers’ ships (the Nina, the Pinta, the Santa Maria, the Mayflower), but not the names of the Indigenous lands and people
  • colonization is like a virus that wipes out anything that is not like the dominant culture
  • the US is working on Truth & Reconciliation legislation re: Indian Boarding Schools
  • none of us has ever lived in a world that wasn’t actively being colonized. It can be violent and it can be subtle.
  • we can’t collectively heal without acknowledging how we got here
  • we need to change 4 things:
    1. people: more diversity of perspectives in leadership
    2. resources: who has them and who makes decisions about them. who has the microphone.
    3. stories: need to shift away from the deficit mindset, see the strengths
    4. rules: spoken & unspoken policies, need more equitable policies, but also need to become aware of and change the unspoken rules that limit our work

Concurrent Session: Walking the talk: Bringing Ontological Thinking into Evaluation Practice by Jennifer Billman and Eric Einspruch

Journal article: Framing Evaluation in Reality: An Introduction to Ontologically Integrative Evaluation

Thursday Plenary: Co-creation of Strategic Evaluations to Shift Power Moderator: Ayesha Boyce Speakers: Elizabeth Taylor-Schiro/Biidabinikwe, Gabriela Garcia, Melanie Kawano-Chiu, and Subarna Mathes 

Here are some things that the panelists said that resonated with me:

  • Ayesha Boyce:
    • equity is context-specific
  • Gabriela Garcia:
    • equity is not enough. The next step is collective liberation
    • At Beyond, they use a culturally-responsive evaluation framework, start all evaluations in a visioning session, ensure the evaluation is grounded in community values
  • Elizabeth Taylor-Schiro/Biidabinikwe:
    • communities striving for collective liberation don’t have power and that’s the problem. Power is needed to draw on their strengths, move toward sustainability and self-determination
    • it should be the community leading the evaluation, supported by evaluators, rather than ‘co-creating’ the evaluation
  • Melanie Kawano-Chiu:
    • whoever funds the evaluation gets to make the most decisions – that’s a bias we hold
    • ableism = there is a “norm” and if you fall outside of it, you aren’t good enough
    • “Nothing about us without us” comes from the South African disability community
    • Disability Rights Advocacy Fund formed after the UN Convention on Rights of People with Disabilities
  • Subarna Mathes:
    • if rigour = degree of confidence that the program has led to an outcome [different than rigour in the post-positivist sense]
    • we need to push against the view of rigour that is narrowly defined, that prioritizes a worldview of “one reality” or “objectivity”

Concurrent session: Interactive tool to promote responsible use and understanding of culturally responsive and equity-focused evaluation by Blanca Guillen-Woods, Felisa Gonzales, Katrina Bledsoe, Kantahyanee Murray

  • https://slp4i.com/the-eval-matrix/ is an online tool that helps you to choose from various different equity-focused/culturally-responsive evaluation approaches
  • 7 key principles, 3 focus areas (individual, interpersonal, structural levels)
  • This tool is really cool and I’m definitely going to share it with my students, as they often ask how to choose an approach (or approaches) when designing an evaluation

Concurrent Session: Design Sprint: How Researchers Can Share Power with Communities Involved in Evaluations by Gloriela Iguina-Colón and Brit Henderson

These presenters took us through a workshop on power sharing. Here are some things that they talked about that resonated with me:

  • power is often thought of in the sense of authority, control – power over other people or things
  • MLK descrbied power as “Power properly understood is nothing but the ability to achieve purpose. It is the strength required to bring about social, political, and economic change.”
  • can have power with (collaborate with others to find common ground), power to (believe in people’s ability to shape their own lives), and power within [which I didn’t catch the meaning of in my notes so I just Googled it and found this: “the sense of confidence, dignity and self-esteem that comes from gaining awareness of one’s situation and realizing the possibility of doing something about it.”]
  • power levers:
    • resources
    • access
    • opportunities
  • power sharing = recognizing the power levers that you have and actively choosing to leverage these to build collective strength
  • positionality – “how our social identities and experiences influence the choices we make in the research process and how those factors shape the way others see us and give us power and/or insight in a specific research context.”
    • consider experiences (interactions with the topic; lived experience of the topic), social identities (it’s context-dependent which are valued or not valued), perspectives (about the topic; understanding systems of oppression); identifying these can provide helpful insights (e.g., when you share an identity with participants) and biases (e.g., when you don’t share an identity (or an intersection of identities) and have assumptions/biases)
      • in addition to individual positionality, think about team positionality
  • reflectivity – “an attitude of attending systematically to the context of knowledge construction, especially to the effect of the researcher, at every step of the research practice.
    • examination, attitude, process related to the topic; not just about identifying these things, but also what insights this will give me and where I might have knowledge gaps
  • opportunity spaces: “points in the [evaluation] process during which you can apply power levers to facilitate meaningful participation among and share decision-making power with
    • each of the steps of the evaluation process is an opportunity for meaningful participation: evaluation design, data collection, data analysis, interpretation of results, and dissemination
  • facilitation – provide enough structure so everyone can be heard; be mindful of different views of evaluation
  • when considering the key people/groups in an evaluation, ask:
    • who has the most power/privilege in this context?
    • who will be most impacted by the evaluation?

Concurrent Session: Ethics for Evaluation: Can We Go Beyond Doing No Harm to Tackle Bad and Do Good? by Penny Hawkins, Donna Mertens, and Tessie Catsambas

  • Ethics for Evaluation: Beyond “doing no harm” to “tackling bad” and “doing good”. Edited By Rob D. van den Berg, Penny Hawkins, Nicoletta Stame

Concurrent Session: Equitable Evaluation Discussion Guide by Maggie Jones, Natasha Arora, and Elena Kuo

  • Centre for Community Health & Evaluation at Kaiser Permenated (Seattle) [Seemed quite similar to CHEOS)
  • equity-focused conversation about the evaluation design with someone from their organization who is not part of the project to get a different perspective
  • they created a guide that includes pre-work before the meeting, them a meeting where you do a consultation with reviewers
  • helped them to think from multiple angles (not just “what’s in the RFP?”)
  • helped them to discuss assumptions and implications
  • articulate what they can and cannot do to address equity
    • might not be able to do something in the current evaluation, but if you don’t identify ideas, won’t ever do them – so may be something to put in the next proposal if it’s too late to do it in this proposal
  • they tell funders that the EDI reviews is part of their process (i.e., we will develop the plan, put it through the EDI review and may come back to the funder with new ideas)
  • ultimately would like to have a systematic follow up process where people will document what they do (trying to document changes that happened due to the EDI review process) to build evidence if this process makes a difference

Concurrent Session: Identifying Gaps in the Research on Professionalizing Evaluation: What Do We Need? by Amanda Sutter, Esther Nolton, Rebecca Teasdale, Rachael Kenney, Dana Wanzer

Concurrent Session: Creative Practices for Evaluators by Chantal Hoff & Susan Putnins

  • reminded me a lot of Jennica & May from ANDImplementation

Concurrent Session: Who Are We? Studies on Evaluators’ Values, Ethics and Ontologies by John M. LaVelle, Michael Morris, Clayton Stephenson, Scott I Donaldson, Justin Hacket, Paidamoyo Chikate, Jennifer Billman

  • VOPEs have ethics, standards, and competencies, but we as evaluator interpret them through our own lenses
  • values = a set of goals and motivations that serve as a guiding group of principles, affect decisions/attitudes/behaviours, come from many sources, influence our practice

Concurrent Session: Mapping Distinctions in the Implementation of Learning Health System (LHS) by Anna Perry & Dough Easterling

  • from National Academy of Medicine, but concept is too high level and ambiguous to guide the actual work of becoming a LHS
  • in the US, electronic health records adopted in early 2000s, Afforable Care Act required the use of data to inform the health system
  • Academci Helath Centres not early adopters of LHS because they were focused on research to build knowledge vs. continuous improvement type stuff
  • hypothesis is that LHS is supposed to improve patient care, patient outcomes, and staff satisfaction (since they are more engaged)

Concurrent Session: Who are We? Studies of Evaluator Beliefs, Identify, and Ethics by Rachel Kenney, Bianca Montrosse-Moorhead, Amanda Sutter, Christina Peterson, Rachel Ladd, Betty Onyura, Abigail Fisher, Qian Wu, Shrutikaa Rajkumar, Sarick Chapagain, Judith Nassuna, Latika Nirula

  • Ladd & Peterson discussed consensual qualitative analysis
  • Tin Vo presented on behalf of Betty Onyura, who was not able to attend. Talked about how the commodification of evaluation work is in tension with trying to support equity and social justice
Untitled
  • an audience member suggested the word “constituent” instead of “stakeholder” [as a lot of us are trying to find a word to replace “stakeholder”]

Concurrent Session: Playing with Uncertainty: Leaning into Improv for Effective Evaluation by Daniel Tsin, Libby Smith, and Tiffany Tovey

  • improv as reflection-in-action
  • improv as a mindset – every idea matters
  • thinking on your feet, using a different part of your brain, building on ideas, chance to be brave – can all be useful in evaluation
  • activity: Zip Zap Zop – toss a ball and say “zip,” “zap”, “zop” in that order and when someone drops the ball, we all cheer “woop!”
    • a chance to experience failure and turn it into a celebration
    • shared experience of a group
    • a plan for when we messed up
    • have to pay attention the whole time – not planning what to do, but being present, acknowledging what is being said/done
    • facilitator is not in control
  • activity: Yes, and…
    • “and” is generative, while “but” feels more like you are shutting someone down
    • you will notice “but” in every day life when you could have used an “and”
    • sometimes you want to be generative and sometimes you want to prioritize (e.g., don’t want to keep “and”ing when building a program ToC and end up with trying to do everything).
  • Adrienne Marie Brown’s Emergent Strategy

Concurrent Session: What Should I Do? Examining Uncertainty, Decisions Points, and Pushback in Evaluation Practice by Rebecca Tesadale, Tiffany Tovey, Grettel Arias Orozco, Julianne Zemaitis, Onyinyechukwu Onwuka, Cherie Avent, Christina Peterson, Allison Ricket, Mandy White, Kelli Schoen, Daniel Kloepfer, Natalie Wilson

  • evaluations require interpersonal skills, but it’s not taught in evaluation courses or in evaluation texts
  • it’s a human tendency to be defensive and as a conversation proceeds, defensiveness will increase as what a person hears can become a distortion of what the message was
  • Kahlke, 2014 – Generic Qualitative Approaches: Pitfalls and Benefits of Methodological Mixology
  • Braun & Clarke, 2022
  • evaluators are always dealing with uncertainty
  • different people have different level of tolerance for uncertainty (and an evaluator’s tolerance might be different than that of the people they work with)
  • aspects of uncertainty”
    • probability – quant representation about the amount of uncertainty
    • ambiguity – different ways to interpret findings
    • vagueness – how detailed the language is
  • take with client before you start – what is the stake of the decision? What is their tolerance for university how certain do they need to be? This can inform choice of methods, etc.
  • uncertainty can be leveraged to drive transformational change by creating dialogue about the unknown and asking more interesting questions about the unknown (e.g., if data is not available, ask why there is no data)

My post conference “to do” list

  • read Decolonizing Wealth
  • read all the various articles that I took note of
  • order System Evaluation Theory: A Blueprint for Practitioners Evaluating Complex Interventions Operating and Functioning as Systems by Ralph Renger (I chatted with Ralph at the book fair, but they didn’t have any books to buy at the book fair – just a chance to talk to authors)

Written by cplysy · Categorized: drbethsnow

  • « Go to Previous Page
  • Go to page 1
  • Interim pages omitted …
  • Go to page 86
  • Go to page 87
  • Go to page 88
  • Go to page 89
  • Go to page 90
  • Interim pages omitted …
  • Go to page 304
  • Go to Next Page »

Footer

Follow our Work

The easiest way to stay connected to our work is to join our newsletter. You’ll get updates on projects, learn about new events, and hear stories from those evaluators whom the field continues to actively exclude and erase.

Get Updates

Want to take further action or join a pod? Click here to learn more.

Copyright © 2026 · The May 13 Group · Log in

en English
af Afrikaanssq Shqipam አማርኛar العربيةhy Հայերենaz Azərbaycan dilieu Euskarabe Беларуская моваbn বাংলাbs Bosanskibg Българскиca Catalàceb Cebuanony Chichewazh-CN 简体中文zh-TW 繁體中文co Corsuhr Hrvatskics Čeština‎da Dansknl Nederlandsen Englisheo Esperantoet Eestitl Filipinofi Suomifr Françaisfy Fryskgl Galegoka ქართულიde Deutschel Ελληνικάgu ગુજરાતીht Kreyol ayisyenha Harshen Hausahaw Ōlelo Hawaiʻiiw עִבְרִיתhi हिन्दीhmn Hmonghu Magyaris Íslenskaig Igboid Bahasa Indonesiaga Gaeilgeit Italianoja 日本語jw Basa Jawakn ಕನ್ನಡkk Қазақ тіліkm ភាសាខ្មែរko 한국어ku كوردی‎ky Кыргызчаlo ພາສາລາວla Latinlv Latviešu valodalt Lietuvių kalbalb Lëtzebuergeschmk Македонски јазикmg Malagasyms Bahasa Melayuml മലയാളംmt Maltesemi Te Reo Māorimr मराठीmn Монголmy ဗမာစာne नेपालीno Norsk bokmålps پښتوfa فارسیpl Polskipt Portuguêspa ਪੰਜਾਬੀro Românăru Русскийsm Samoangd Gàidhligsr Српски језикst Sesothosn Shonasd سنڌيsi සිංහලsk Slovenčinasl Slovenščinaso Afsoomaalies Españolsu Basa Sundasw Kiswahilisv Svenskatg Тоҷикӣta தமிழ்te తెలుగుth ไทยtr Türkçeuk Українськаur اردوuz O‘zbekchavi Tiếng Việtcy Cymraegxh isiXhosayi יידישyo Yorùbázu Zulu