• Skip to main content
  • Skip to footer
  • Home

The May 13 Group

the next day for evaluation

  • Get Involved
  • Our Work
  • About Us
You are here: Home / Archives for allblogs / cameronnorman

cameronnorman

Sep 29 2020

7 Questions to Evaluate Design Thinking

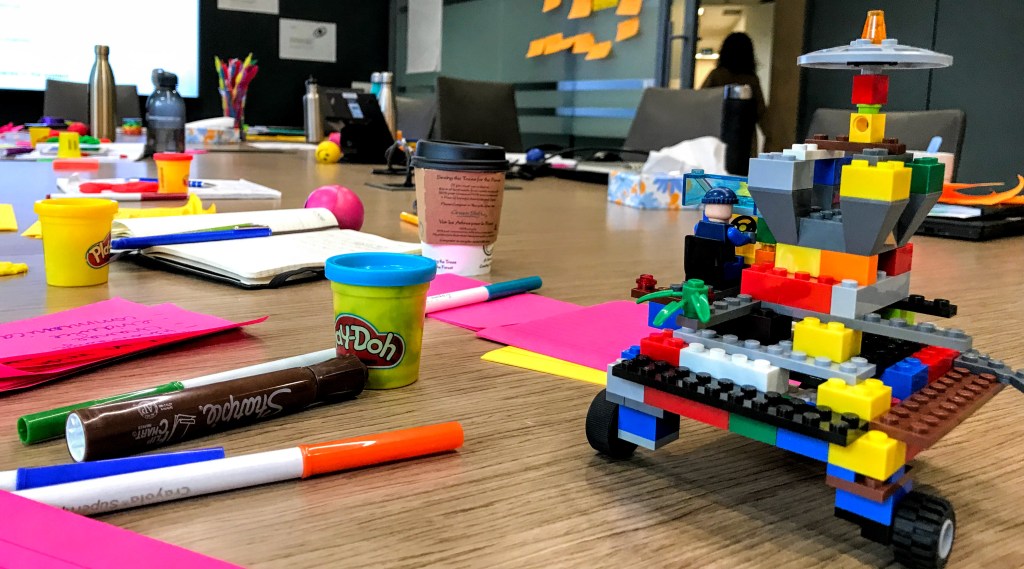
Design thinking is much more than sticky notes, whiteboards and creative exploration. It’s impact can be felt in the outputs and outcomes tied to actual product or service and much further if we allow ourselves to focus on that.

Here are 7 questions that we ask of design thinking that focus on the learning outcomes and uncover the true impact of creation, design, and execution, which is a big part of what design thinking is all about.

By asking these we can better tap into the true return on investment of design thinking as a transformative approach to learning, not just product or service design.

  1. What do people learn in the process of engaging in design thinking?
  2. What new skills to people acquire, develop, or refine through design thinking?
  3. How are the lessons from engaging in design thinking applied to other subsequent products?
  4. What is the effect of design thinking on the mindset of those involved in a design-oriented project?
  5. How does the co-design process influence team development, cohesion, creativity, and innovation performance?
  6. What role does design thinking play in shaping the innovation culture (e.g., creation, execution, delivery, and evaluation) with an organization?
  7. How does design thinking contribute to the implementation of innovations?

Evaluating the impact of your products or services is always important, but if you focus only on that you will miss some of the biggest benefits that design thinking offers your organization when done well.

If you need or want help in learning how your team learns and amplifying the effects of design thinking, contact us and we’ll help you out.

Note: This article was inspired by a recent post on our sister blog, Censemaking, which focuses on ideas, commentary and issues tied to innovation.

Written by cplysy · Categorized: cameronnorman

Sep 22 2020

Predicting Next Year’s Top Story

Foresight can involve complex data gathering, sensemaking, and design and also be something as simple as developing the headline for next year’s news.

This simple technique can get your organization started on futures thinking and provide a way to connect the present situation with trends that you are seeing in your industry and the world to strategy and aspirations. This technique gets you to imagine the headlines of the future (what people are writing or saying about your enterprise) and walking back from that or projecting forward to fill in the steps that led you to that outcome.

Setting the Stage

This is an activity that is best done as a group anywhere from 4 to 12 people and can be done in as little as an hour, although it can be done over a longer period of time in single or multiple sessions if you wish to go deeper into the assumptions and models for the future.

It’s important to frame the exercise by choosing whether you want headlines for the organization or a specific project or product. It doesn’t matter who these imaginary headlines are to be written by (e.g., journalists, industry professionals), however, it does help to imagine what context they are to be written (e.g., news media, business press, industry news outlets, professional associations, peers). Make whatever context you pick clear even if it is in multiple contexts.

Next, set a time horizon for the headlines sometime within the next 6 to 12 months.

Lastly, this is often used to frame positive outcomes. However, after you’ve determined what success looks like it is worth considering repeating the exercise at a later date (e.g., one week later) with the converse: focusing on headlines that report failures, disasters, or problems. This can help your team see threats as well as possibilities.

The materials you will need are pieces of paper (preferably sticky notes because they are easily portable and can be re-arranged) and a whiteboard or flipchart/newsprint sheets of paper and markers for a facilitator (who can be external or a member of the team) and the team/participants.

Activity

Individually, have participants brainstorm headlines they imagine for the time horizon you have set. Give them about 5-10 minutes and ask participants to strive for volume — lots of ideas — over quality.

As a group, post together (with stickies) or share the ideas that individuals have generated. This can be done by having individuals post up their sticky notes on a wall and then later organized or by doing successive round-robin reporting where everyone presents a single idea in as many rounds as there are ideas.

We suggest having the group vote on headlines that they like, elicit the strongest reactions (positive or negative), or are the most provocative. Aim for 3-5 headlines. With these headlines explore as a group some of the assumptions that are in place for this headline to come true. The aim is to answer the question: what would have to happen for this to become a real headline?

Why?

This activity helps you set and frame a goal for your organization, project or product. It can help elicit information about what kind of aspirations, assumptions, and ideas that your team has about what you are doing. It will also allow to identify what kind of relationships, resources, or facilitators are needed to get from where you are to where you wish to go over the time horizon you’ve picked.

If you do the negative case headline, this technique can help frame what kind of necessary activities are required for success and where they can possibly go wrong. it will allow you to identify threats and risks associated with what you’re planning to help account for that in your plan.

This simple technique is powerful and can be used in a single session, with multiple units, or as part of a planning exercise and the dividends are great. It’s fun, creative, and informative.

If you want to see more about what this can do, contact us and we’ll gladly help you set up a foresight scan and strategic plan for your project or organization based on this kind of futures thinking.

Written by cplysy · Categorized: cameronnorman

Sep 15 2020

Innovation Talent Inventories

Faced with a situation or opportunity that demands you try something new or change what your organization does, the type of knowledge, skills, and experience required is often different than what is used to maintain the status quo. One of the most overlooked places to look for this talent is right under our noses — or beaks — and that your birds of a feather might be closer together than you knew.

An innovation talent inventory is an exercise that organizations are advised to undertake every 6-12 months (depending on the level of dynamism within the organization and industry) to assess the talent within your organization.

Why an Inventory?

Talent acquisition and retention is a costly part of organizational development. Hiring staff often means looking at a variety of skills, yet may only enlist a few of them for a specific job. Over time it becomes easy to lose track of or forget that your team may have skills and experiences that can be brought to bear on your current project.

The process of undertaking an inventory is also a means of recognizing and reminding your team of who is on it. By looking at your staff through the lens of innovation, it’s also possible to identify attributes that were not germane at hiring or recruitment but have evolved into a need at the present day. Whether its a certification course, extra-mural activities like coaching sports, or experience working in a particular sector, these previously non-recognized experiences can now serve to support your team’s innovation project.

Undertaking an Inventory

There is no prescriptive means of undertaking an inventory and we recommend the following:

Informal interviews. Simple coffee-time conversations can make a big difference and have the added benefit of allowing your team to build trust and commitment to the innovation project in the process. Toronto-based software firm Freshbooks encourages their team to go on ‘blind dates’ (not real ones) over coffee with staff in other departments so that they can learn from each other. Informality allows for conversations to wander to different parts of a persons’ career that might have been previously unexplored.

Resume reviews. Whether it is looking over your team’s personnel files or LinkedIn pages (all with permission and consent of your team, of course), a review of the current set of listed skills, experiences and certifications can jog your memory about what talent your team already has. Being transparent about why you’re doing this and ensuring that any exploration is done solely for the purpose of the innovation talent inventory is essential. This can be a powerful means for team and trust-building if done right and harmful if done poorly.

Surveys. A simple exploratory survey asking individuals to identify skills and abilities (less about knowledge) can catalogue your teams’ ideas and suggestions. The one risk with this approach is that many staff might still see themselves in their current role and frame their responses according to that. Like with the interviews, focusing on a person’s journey rather than their current destination is key.

Visual Mapping. Another fun and informative strategy is to use visual maps where individuals either self-plot or are plotted on a map of the situation. Plotting out the needs, wants, and opportunities on a simple large-sheet of paper and then having individuals place themselves closest to where they fit related to those needs, wants, and opportunities can be highly participatory. This works by having the page posted on a wall in a common area for a few days (e.g., coffee room) or using an electronic tool such as Miro or Mural.

Together, you will find yourself and your team learning much from what you already have and putting underused or unknown talents to work to help take your idea forward. You’ll know so much more about what you already know (and didn’t realize).

Need help putting this together? Contact us and we can show you how to engage your team and learn more, together, to set yourself for innovation, by design.

Written by cplysy · Categorized: cameronnorman

Sep 09 2020

Innovation Implementation Index

What does it truly mean to say that you are an innovative organization? One of the simplest, most powerful measures is implementation. How many innovative initiatives have you launched and put into the world?

There are arguments why the QWERTY keyboard is inferior to other designs, but there’s no argument that its the best innovation we’ve ever had when it comes to typing. Why? It’s the one that was implemented into practice.

Success Marks

Checkmarks on a list usually imply some kind of rote behaviour that isn’t suitable for innovation, although checklists themselves are useful for quality control. We prefer the idea of ‘success marks’ which indicate that an idea has been successfully taken from concept and put into practice — whether or not it yields desired outcomes.

As an index, we propose the following six metrics:

  1. The number of new initiatives that have been implemented into practice
  2. The number of projects that have developed prototypes that have been tested
  3. The prototype ‘death rate’: divide the number of terminated prototypes by the total number of prototypes developed
  4. The number of prototypes moved into implementation (* which is a similar, but not necessarily the same number as #1)
  5. The number of new initiatives started:
  6. The initiative death rate: divide the number of ‘new’ projects started by the number of projects implemented

Number 1 is the most important of all of these.

The reason we count all six as part of an index is that each of these represents some form of concerted action and effort toward moving ideas out of concept into action with the lowest number (Number 1) representing the highest value to the organization.

While having ideas is a precursor to prototypes we don’t we count this because it is easy to game this metric.

We also don’t believe in coming up with metrics about innovation or even prototype quality because the success of implementation and the quality of the prototype don’t always match. You can implement an idea that is still in development, yet still has value that can be realized right away.

Want to show how innovative you are? Consider scoring yourself on these metrics to see how much of what your organization does is talk and how much of it is action.

Want to move ideas into action? We can help. And we can develop the metrics to show what kind of impact your innovation has in the world. Let us show you how.

Written by cplysy · Categorized: cameronnorman

Sep 01 2020

Forecasting

You might not have a crystal ball, but you can still envision the near-future by using a simple strategy called forecasting to plot your strategy for the coming months. Here is how.

Fundamentals

A forecast is a data-driven prediction of possible outcomes that can be used to generate scenarios. The first item required is data. This can be qualitative, quantitative, or mixed and from primary or secondary sources. Most often, forecasts are a combination of these.

Checklists have been found to be useful tools to help organize data that contribute to forecasts. Pull together those sources you have and then organize them in a manner that allows you to build a narrative — a story — of what has happened to allow you to better anticipate what might happen.

Forecasts work when there is some expectation of a linear progression from time to time (with some variation). Time series data — data gathered on the same topic/issue/item multiple times over in succession — is among the most popular sources of data. This will allow you to see patterns and spot trends that lead you to now.

Add Imagination

Once you’ve developed a model of the present situation, the next stage is to imagine what might happen in the near future. Forecasts are generally useful for predicting near-term (e.g., 3-, 6-, or 12-months) outcomes and are less useful for longer-term assessments.

Next match data from other sources — social trends, government policy documents, census data — to create scenarios. For example, seasonal trends can change the near term. ‘Seasons’ like ‘back-to-school’, holidays, flu trends, weather changes can all affect how present data can mislead us for future activities. The COVID-19 pandemic provided an example of the various ways in which an economy can re-open, a healthcare system can respond, and what ‘back-to-school’ looks like.

From these data points, work together as a team (this is always better done in groups because different people will see data differently) we can start to envision possible futures and outcomes.

Look for amplifiers and dampeners. What things might make an existing trend more pronounced and what might dampen that trend, or extinguish it altogether. In discussion as a group you can

Structuring Forecasts: Tips & Tricks

Begin your group work together with a few simple ‘rules’ to guide your discussion. Start with limiting any feedback or critique of ideas at the start. You want to explore why something could happen, not assess the likelihood of such activities at first. This opens our minds up to unlikely scenarios.

It’s helpful to have someone on the team who can play the role of the ‘black hat‘ – the person whose role is to illustrate why something won’t work. Edward DeBono’s ‘thinking style’ roles can be useful here in helping us structure a way to look at the data and ideas from different points of view. Building on these different perspectives, it’s important to build a variety of scenarios and attach a level of anticipated likelhood to them. (e.g., high, medium, or low) and timing (e.g., imminent, soon, long-term, etc..)

Build out as many scenarios as the data suggests might be useful. This is often three to five, but rarely nine or ten.

From these scenarios, ‘walk them back’ to the present using an approach of asking “what happened just before X” and repeating that of each answer until you find yourself at the present. This allows you to start building pathways of potential causality.

While it may be that none of the scenarios come into reality, there are likely to be pathways that resemble them. When you find these, your team can use those to examine the assumptions that you hold with each one of them and use that to develop a strategy around them to better increase your anticipatory awareness and adaptive capacity to learn and act.

Taken together, this method can help you to see what might be coming and plan accordingly. It is a powerful means to explore near futures and design your organization to be better suited to living in them rather than having to play catch-up.

If you want to develop forecasts, contact us. We can help you see what might be coming and design your team to better meet it.

Written by cplysy · Categorized: cameronnorman

  • « Go to Previous Page
  • Go to page 1
  • Interim pages omitted …
  • Go to page 14
  • Go to page 15
  • Go to page 16
  • Go to page 17
  • Go to page 18
  • Interim pages omitted …
  • Go to page 21
  • Go to Next Page »

Footer

Follow our Work

The easiest way to stay connected to our work is to join our newsletter. You’ll get updates on projects, learn about new events, and hear stories from those evaluators whom the field continues to actively exclude and erase.

Get Updates

Want to take further action or join a pod? Click here to learn more.

Copyright © 2026 · The May 13 Group · Log in

en English
af Afrikaanssq Shqipam አማርኛar العربيةhy Հայերենaz Azərbaycan dilieu Euskarabe Беларуская моваbn বাংলাbs Bosanskibg Българскиca Catalàceb Cebuanony Chichewazh-CN 简体中文zh-TW 繁體中文co Corsuhr Hrvatskics Čeština‎da Dansknl Nederlandsen Englisheo Esperantoet Eestitl Filipinofi Suomifr Françaisfy Fryskgl Galegoka ქართულიde Deutschel Ελληνικάgu ગુજરાતીht Kreyol ayisyenha Harshen Hausahaw Ōlelo Hawaiʻiiw עִבְרִיתhi हिन्दीhmn Hmonghu Magyaris Íslenskaig Igboid Bahasa Indonesiaga Gaeilgeit Italianoja 日本語jw Basa Jawakn ಕನ್ನಡkk Қазақ тіліkm ភាសាខ្មែរko 한국어ku كوردی‎ky Кыргызчаlo ພາສາລາວla Latinlv Latviešu valodalt Lietuvių kalbalb Lëtzebuergeschmk Македонски јазикmg Malagasyms Bahasa Melayuml മലയാളംmt Maltesemi Te Reo Māorimr मराठीmn Монголmy ဗမာစာne नेपालीno Norsk bokmålps پښتوfa فارسیpl Polskipt Portuguêspa ਪੰਜਾਬੀro Românăru Русскийsm Samoangd Gàidhligsr Српски језикst Sesothosn Shonasd سنڌيsi සිංහලsk Slovenčinasl Slovenščinaso Afsoomaalies Españolsu Basa Sundasw Kiswahilisv Svenskatg Тоҷикӣta தமிழ்te తెలుగుth ไทยtr Türkçeuk Українськаur اردوuz O‘zbekchavi Tiếng Việtcy Cymraegxh isiXhosayi יידישyo Yorùbázu Zulu