• Skip to main content
  • Skip to footer
  • Home

The May 13 Group

the next day for evaluation

  • Get Involved
  • Our Work
  • About Us
You are here: Home / Archives for allblogs

allblogs

May 07 2020

Declaración de la plataforma BetterEvaluation frente al COVID-19

Esta es la Declaración de la plataforma BetterEvaluation frente al COVID-19 (Abril de 2020)

La pandemia de COVID-19 está transformando rápidamente nuestro mundo. Las personas, las comunidades y las organizaciones enfrentan enormes desafíos e incertidumbres. La crisis climática y los desastres naturales sin precedentes han puesto en tensión nuestros recursos limitados. Estos desafíos globales ponen en riesgo los Objetivos de Desarrollo Sostenible y amenazan el bienestar de las personas y el planeta. En BetterEvaluation creen que tienen un papel importante que desempeñar para responder a esta situación en desarrollo.

Trabajamos para apoyar una mejor evaluación a nivel mundial. Una buena evaluación ayuda a las personas a identificar la información que necesitan y darle sentido. Ayuda a informar las decisiones sobre qué hacer y cómo mejorar los resultados. Una buena evaluación es esencial para guiar el mejor uso de los recursos y para garantizar la rendición de cuentas y el aprendizaje. Durante esta pandemia y en el mundo posterior a la pandemia, nuestro trabajo es más importante que nunca.

Así es como están respondiendo:

1 Trabajando de forma remota para garantizar la seguridad de nuestro personal y la comunidad.

2 Finalizando las mejoras de la experiencia de usuario en el sitio web para que sea más fácil encontrar información relevante

• Creando y seleccionando contenido adicional para abordar el contexto actual, que incluye:

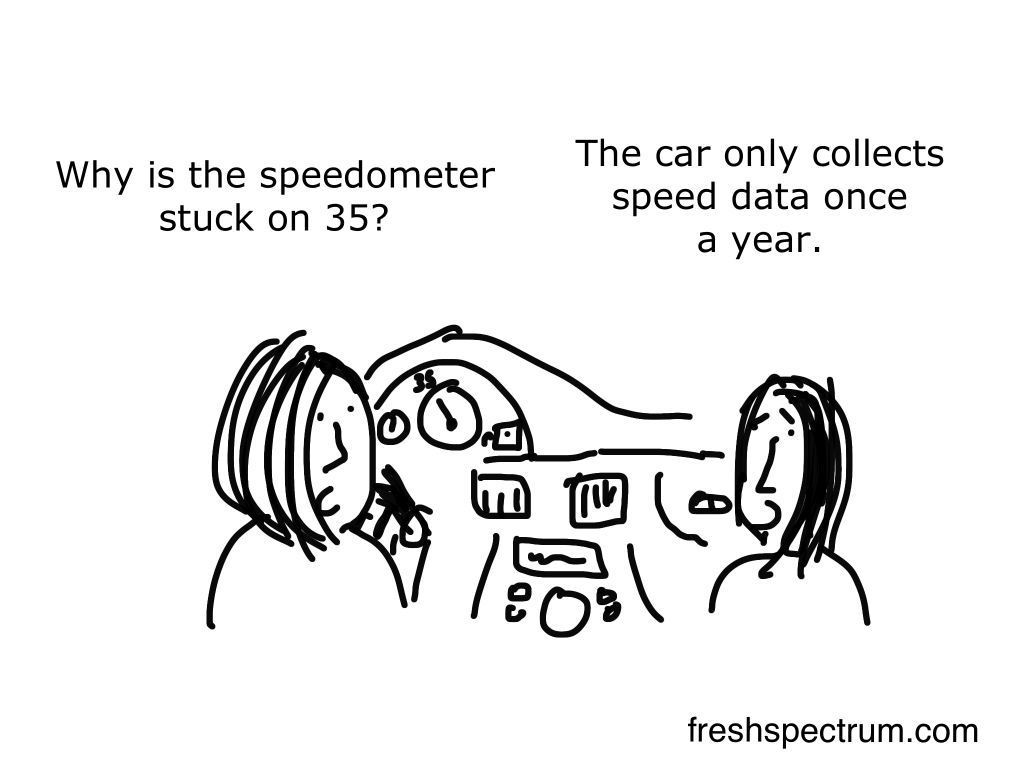
• evaluación en tiempo real

• evaluación para la gestión adaptativa

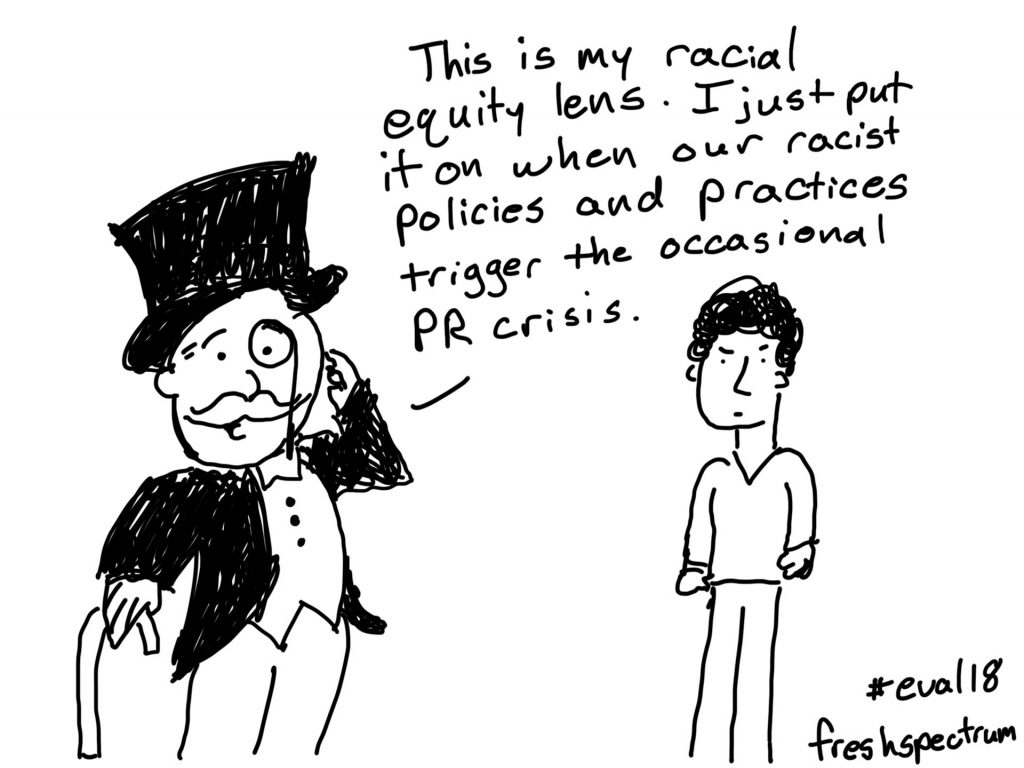
• abordar la equidad en la evaluación

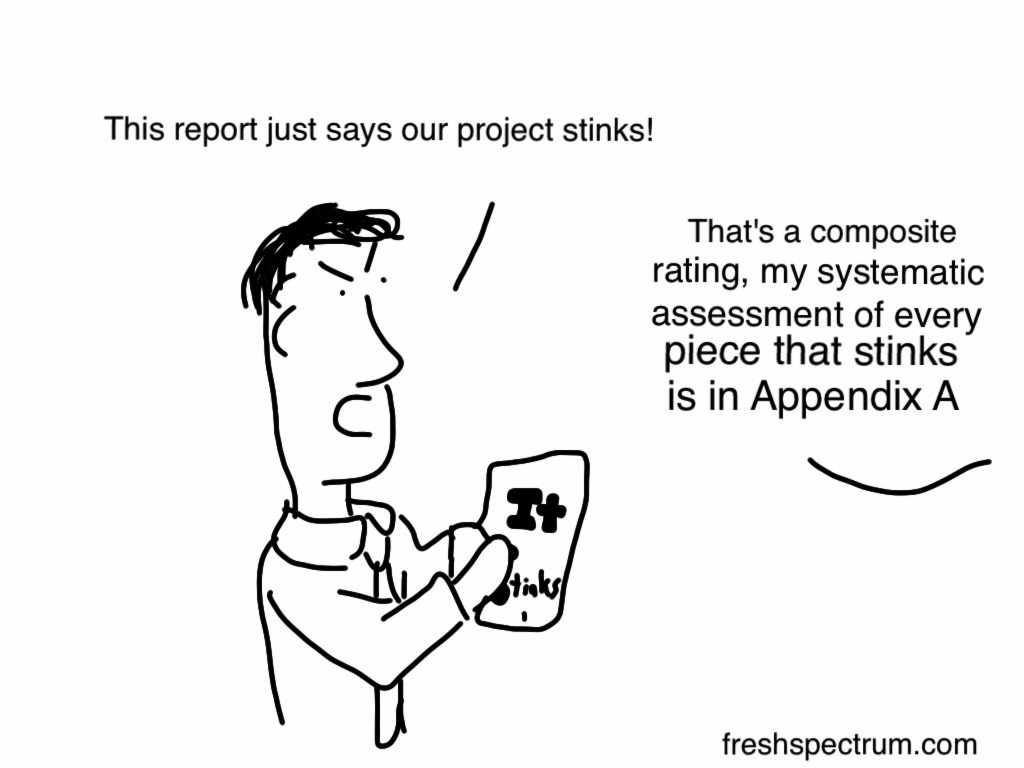
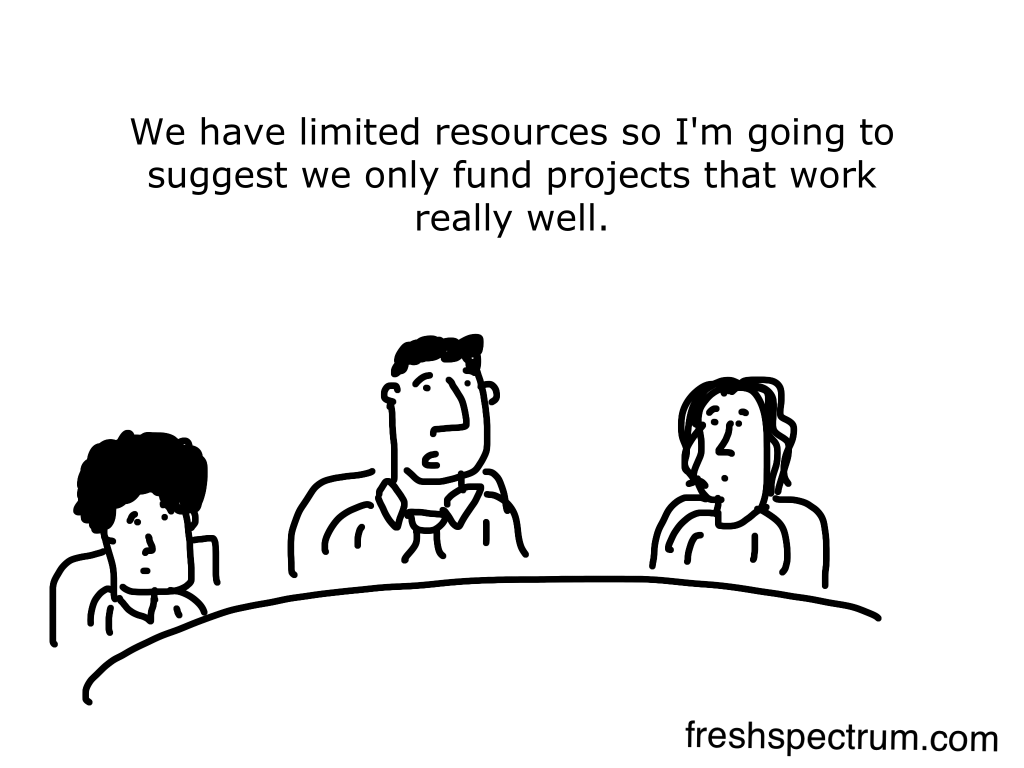
• evaluación de rendición de cuentas y asignación de recursos

• formas de hacer la evaluación dentro de las limitaciones de distanciamiento físico

• formas de trabajar eficazmente en línea

• recursos relacionados con la evaluación en la pandemia de COVID19

3 Asociaciones existentes y los proyectos de fortalecimiento de capacidades, adaptándonos según sea necesario.

4 Explorando formas de contribuir a los esfuerzos específicos para abordar estos desafíos a nivel local y global.

BetterEvaluation continuará trabajando en colaboración para crear, compartir y apoyar el uso del conocimiento sobre la evaluación.

-Basados en las experiencias de nuestra junta, personal y socios en el fortalecimiento de capacidades en crisis de salud y desastres naturales.

-Firmemente comprometidos a utilizar las fortalezas en la evaluación para construir un mundo mejor, particularmente para los grupos marginados y los más afectados por las crisis actuales.

Written by cplysy · Categorized: TripleAD

May 07 2020

Social and Emotional Learning is Imperative and in Museum Educators’ Wheelhouse: Part 2

Shortly after posting my last blog on social and emotional learning being imperative and in museum educators’ wheelhouse, some conversations with clients, colleagues, and research participants further drove this point home for me.  In my first post, I wrote about how important question-posing is for social and emotional learning and how museum educators are often masters of questioning.  I realized this week there are other ways art museum educators can play a critical role in promoting social and emotional learning, all the while attending to museum’s audience-focused Diversity Equity Access and Inclusion (DEAI) efforts during this time.

Here are the three experiences that have led me to this conclusion:

1. Interviews with preschool teachers about art and art museums: I have been speaking with preschool teachers, many of whom work for state-funded public preschools, about the role of art and art museums in support of their curriculum.  One of the trends across these interviews is how integrated art is into the preschool classroom.  Art is often described as a means of expression, reflection, and meaning making.  For instance, preschool teachers ask students to draw as a way to reflect on fieldtrips and other classroom learning (e.g., draw something you remember from the fieldtrip, or draw something you recall from a story we read this week).  Other times, drawing prompts are more broad, such as draw your house or room, to stimulate conversation.  Preschool educators may ask the children about what they drew as a means to support social and emotional learning specifically (e.g., child talks about being sad because grandmother who lives with them is ill, etc.).

2. Update from an art museum client on their work: In a project update phone call, one of our art museum clients shared how they have used the funding from the family programs they would have been hosting if the museum were open to donate art supplies to the community. The museum plans to disseminate art supplies to local students’ families when they pick up breakfast and lunches at their schools (free- and reduced-lunch program).  This idea personally struck me as so resonant. At my child’s school, her art teacher has been posting art assignments each week.  Conversations in the Google Classroom have raised the issue that some families do not have “traditional” art supplies at home (and maybe cannot afford them).  To the art teacher’s credit, she always gives a found-object option to complete assignments, but it still seems that guardians have some anxiety around their child not having art aupplies.  As noted in the example, access to art making is an important outlet for social and emotional learning among preschool students and others.  Therefore, providing access to art supplies seems to be a really on-point undertaking and one that is likely mission-related for art museums.  Furthermore, our client noted that this endeavor will allow them to connect to even broader audiences than they may have reached through their family programs.  Which leads me to…

3. Visitor Studies Association webchat, Attending to DEAI during the time of COVID–19: I helped to support a DEAI webchat with Jill Stein, Dr. Cecilia Garibay, and VSA’s Understanding Communities focused interest group. The conversation emphasized not letting DEAI conversations fall to the wayside at this time.  As Cecilia pointed out, there seems to be a false dichotomy set up where museum leadership feels they cannot tackle DEAI and the current pandemic.  As the example above demonstrates, it is possible to do both even if it is through what may be perceived as a small gesture.  Circling back to social and emotional learning, the American Physchological Assocation notes that socioeconomic status (SES) “is a consistent and reliable predictor of a vast array of outcomes across the life span, including physical and psychological health.”   There is a high need for support of social and emotional learning, particularly for those challenged by socioeconomic inequalities—access to social and emotional learning support is indeed an equity issue.  Children most in need of social and emotional learning support are those disconnected from sources of that support which they receive in school from counselours and in the art classroom.  Donating art supplies may not typically have been consider a DEAI initiative before, but it is certainly linked to such issues.

Again, I think social and emotional learning is a place art museums in particular can fill a void.  It may mean doing things differently, but that is exactly what we should be embracing at this time.  It reminds me of when a museum educator shared during an American Alliance of Museums conference in 2015 that she felt the education team was better and more innovate when their museum building was closed for construction.  All museums are now without a building, so let’s start thinking outside that box.


 While I was writing this blog, a conversation was posted to Art Museum Teaching that is extremely relevant: Trauma-aware Art Museum Education: A Conversation

The post Social and Emotional Learning is Imperative and in Museum Educators’ Wheelhouse: Part 2 appeared first on RK&A.

Written by cplysy · Categorized: rka

May 07 2020

111 Evaluation Cartoons for Presentations and Blog Posts

Looking for an evaluation related cartoon for your next presentation or blog post? Well, over the last decade I’ve drawn hundreds.

In this post, I’m sharing 111 of my evaluation cartoons, including a lot of community favorites. Please feel free to save to your computer, add to your presentations, and share them on the web.

What about licenses?

So if you’re giving a presentation or writing a blog post, I consider these non-commercial uses. The only attribution I require is keeping the signature in the cartoon (most often freshspectrum, but sometimes clysy). You can add more (always appreciate links back to this site) but I do not require this.

I hate filling out paperwork. Filling out paperwork is making me do work so that you can use my stuff. I charge for this, because, well, I hate paperwork. So I’m just using the Creative Commons language, because I also dislike writing legal-ease kinds of stuff.

All that said, if you like my stuff, consider becoming a Patron of mine. This helps compensate for the costs of sharing my stuff publicly (mainly web hosting). $5/month would be awesome but $1/month is also very much appreciated.

My Creative Commons License

Attribution-NonCommercial (CC BY-NC)

image

This license lets others remix, tweak, and build upon your work non-commercially, and although their new works must also acknowledge you and be non-commercial, they don’t have to license their derivative works on the same terms.

View License Deed | View Legal Code

What about Commercial Uses?

I’m still usually okay with these types of uses. Especially if I don’t have to do any paperwork and my cartoons are secondary to the overall product you are offering. But reaching out and asking (chris @ freshspectrum .com) is encouraged.

I’ll probably just say go for it, and encourage you to become a $5 or $10 patron.

On to the Cartoons

You’ll find others out in the world, but here is a pretty big set that includes most of the community favorites. I’ve also decided to scatter in some comments to add a little additional context.

I drew this Zombie evaluator cartoon for a halloween. But it’s definitely become on of my favorites for anytime use. I have been asked how the evaluator draws on the whiteboard without hands.

My tongue in cheek response is usually, “maybe she had them when she was drawing it on the board in the first place.”

I drew this program evaluation evolution cartoon at the request of another evaluator. Not sure if they ever used it, but I think there is a pretty common sentiment here.

The logic behind doing “what works” often gets applied to newly forming programs. But taking the time to evaluate the past to find what did work, or applying the lessons of past evaluations, is something that few organizations actually take the time to understand.

I like mixing puns with sad social realities…

It’s much easier to say things about racial equity than do things about racial equity. It’s also much easier to do things about racial equity than do enough of the right things in the right way to make significant progress on issues of racial equity.

There is a quote from Michael Scriven that comes from his evaluation thesaurus.

Causation: The relation between mosquitos and mosquito bites. Easily understood by both parties but never satisfactorily defined by philosophers or scientists.

Michael Scriven

Good evaluators carry a set of ethics with them as they pursue their profession. Evaluation can be really important, for good or for bad, and really political.

This researcher vs evaluator cartoon has been a perennial favorite. I find it on a lot of bulletin boards and in presentations. I think there is a hunger for many in the evaluation community to describe their work simply.

I am not against data science and predictive analytics, but maybe sometimes we take it a bit too far.

This Sherlock cartoon is really just an attempt to show detective work as a form of qualitative evaluation. I edited it at the request of Michael Quinn Patton for use in one of his books, but this is the original and I like it better.

Most of the crowd favorite cartoons tend to be short and a little over the top. This is definitely one of them.

I drew this one while pondering the differences between attribution and contribution.

One of the reasons I started becoming disillusioned with contract evaluation was the amount of money that gets put into data collection/analysis. But by the time the contract gets around to dissemination, it’s almost like an afterthought. What a waste.

Seen this on a few bulletin boards too. There are lots of things that are complex, but that’s no excuse to not use data. In fact, quite the opposite.

The word failure can be stigmatized in organizational settings. It’s an easy target for a cartoon, but honestly I’m not sure it’s the kind of word that should get glorified either. Doing something wrong could be someone’s “failure” but it could also be someone else’s “lesson learned.”

Charts and jargon can really obscure ridiculous assumptions and sources. Sometimes it’s fun to just vastly oversimplify.

This is one of those cartoons that I rarely see anyone use, but I think it’s a really important concept. I think the idea of something being “indisputable” is a real driving force behind the perpetual rhetoric that drives methodological choice.

If you read enough of my cartoons you’ll see a lot of repeating ideas. I kind of look at it like taking photographs. Sometimes you need to take them at different angles to see which works the best.

This is the “my dad could beat up your dad” playground argument with an evaluator involved.

Designed this one for Christmas time, but It’s a Wonderful Life is really a true evaluation story.

Another crowd favorite. I learned early that if I wanted a popular cartoon in the evaluation world, it should include a logic model or theory of change.

Can you tell that this is one of my earliest cartoons? Now-a-days, I would take out the tip part at the top. Honestly, I think it would be really cool to draw a logic model to scale.

I really wanted to drive home that this is mother goose. So I added a goose. This sparked the comment, “why is she strangling that goose?”

So many data dashboards I kept seeing were really annual reports carrying a car dashboard metaphor too far. I think it’s funnier to think about cars with annual reporting systems.

Charts are always about perspective. With some annotation and a little bit of color you can make them say all sorts of things.

Every once and awhile when I write on paper, or sketch in a little notebook, I’ll want to undo something I just wrote. So I’ll tap the paper with a couple of fingers just like I would do when using procreate on my iPad. It never works.

This cartoon came out of a post talking about everyday ethical challenges. The story goes, the survey has a low response rate so the program is informed. Then all of a sudden way too many people respond for it to be actual participants.

This cartoon was inspired during a Michael Quinn Patton presentation. It’s the story he uses when talking about coming up with the idea of developmental evaluation.

Open and click rates for emails that people actually look forward to read are usually pretty low. Often <30% of people will open a group’s newsletter and <5% will actually click on anything in that email. Now think about what happens when someone gets an email that includes a link to a long pdf report.

Drew this one for a friend who had just earned her PhD. I know it sounds a bit mean-spirited but honestly, most research and evaluation reports end up in a pit. If you want people to use your work, you might have to spend as much time (or more) advocating, presenting, and sharing. For most work, once it gets to a published state, we move end up moving on.

Of course evaluations can be evaluated. Like wouldn’t it be good if we regularly evaluated peer review? But sometimes it is hard enough getting a decent evaluation budget, asking for an evaluating the evaluation budget seems like a stretch.

Funny thing about this cartoon. If an evaluator reads it, they think it comes across as mean. Like the evaluator is just being too honest.

When a project person reads it they have the opposite reaction. They think, what nerve does this evaluator have coming in and saying they know best.

Seriously, share this cartoon with friends who are evaluators and friends who are program people. Ask them what they think when they read it.

This one was inspired by someone’s story of leading a commissioned evaluation for a program that was not included in making that decision. This happens more often than any evaluator would like, and it can really set things off on the wrong foot. I had to make sure the table of people looked mad enough to make this whole scene feel appropriately uncomfortable.

It’s hard to be the harbinger of a project’s demise, but somebody’s got to do it. I know most evaluators don’t want to see their work this way. But if we work in a world with limited funds and unlimited problems to solve, deciding what programs are not effective enough to be worth the money is a critical role.

Another crowd favorite. I believe it was originally inspired by Jane Davidson talking about causation. Not everything needs a control group or 100% certainty.

I spent a number of years doing data collection grunt work. It basically meant continuing to follow-up with people until they completed a survey. That’s really the secret to high response rates, perseverance (and goons).

Just to make sure we are all on the same page. I am not against RCTs as a method. I am just against the idea that any particular method is superior to all the other methods. The RCT Gold Standard is pretty much a meme that predates the internet..

This cartoon always made me giggle. But if someone doesn’t already know what a heat map is, it would fly right over their head. This is a good lesson for using cartoons. Just because you think something is funny doesn’t mean your audience will.

Lots of jokes are audience dependent. Be prepared that something you think is funny could easily go over like a lead balloon.

Long reports often get a bad name. But if you really want to reach a bunch of different audiences you are not going to do it in one short report.

There is definitely a difference between effectiveness and perceived effectiveness. Unfortunately the one that should matter the most, often doesn’t.

Given the amount of code often required to do a network analysis, and the reputation held by people who know a lot of code, I wonder how accurate this cartoon might be.

There was this chart on the side of a Lipton tea box that I always found fascinating. It compared flavonoid content of tea versus a couple of juices and coffee. But it also included broccoli. It was so completely random and inspired this cartoon.

Sounds silly I know. But honestly, if someone takes the time to bedazzle all of their charts, I would probably take a closer look.

If you ask an evaluator to describe what they do to non-evaluation audiences a lot will struggle. Or they’ll just dive into a string of metaphors comparing evaluation to other professions.

This also works for blog posts. Just add a bunch of random resources at the end using citations and not including links.

It’s not just what you report but how you report that matters. You could create a brilliantly accessible report but if it gets buried on a boring/confusing/poorly designed website nobody will read it.

What we see and what actually happened are two different things. This is what makes true attribution so hard. It’s also what makes cultural responsiveness and stakeholder engagement so critical as the negative side effects of an intervention can easily outweigh the benefits. Yes, you don’t know what you don’t know. But you’ll never know if you don’t even try.

That’s why we donate to things right? We want to know our money is going to actually helping solve a problem we believe needs to be solved. If the charity gets back to you and says, “no, but it helped us buy paper towels for the break room,” I’m not sure that would go over well.

Drew this one for David Fetterman. There are all sorts of methods, approaches, and frameworks in evaluation that overlap or appear similar. The difference between collaborative, participatory, and empowerment evaluation at the most basic level is the role of the evaluator, which is what I tried to share with this cartoon.

“What I cannot create, I do not understand.”

It’s a Feynman quote that I think we can expand upon.

“What I cannot communicate, I can not help you to understand.”

In the time of COVID-19, I fear that we maybe be running this experiment. But the two groups are not being assigned randomly.

TATMWPIAP (There Are Too Many White People In Authority Positions). I note the irony in saying this as a white person who sometimes finds himself in authority positions.

I don’t think it’s too surprising that many of the evaluators who teach data visualization design do so using common tools like Excel and Power Point.

I love tech, and there are some really cool pieces of software out in the world, but if it’s a much shorter distance to teach someone to design using tools they already know. It’s a pragmatic starting point, and most evaluators are nothing if not pragmatic.

So what cartoon is your favorite?

Do you have any favorite evaluation cartoons from this list? Do you have any favorites from outside this list?

Also, if you use any of my cartoons in presentations or on bulletin boards, would you take a selfie with them? You can share it with me here in the comments, on twitter, or on LinkedIn.

I love seeing the cartoons in the wild!

Written by cplysy · Categorized: freshspectrum

May 06 2020

La evaluación en tiempo real en emergencias

Hoy traigo a través del resumen que hizo INTRAC sobre el tema, algunas ideas sobre evaluación en tiempo real.

Una evaluación en tiempo real (RTE) está diseñada para proporcionar retroalimentación inmediata (en tiempo real) a aquellos que planifican o ejecutan un proyecto o programa, para que puedan realizar mejoras. Esta retroalimentación generalmente se proporciona durante el trabajo de campo de la evaluación, en lugar de después.

Las evaluaciones en tiempo real normalmente están asociadas con la respuesta de emergencia o las intervenciones humanitarias. Sin embargo, algunas personas también usan el término para referirse a evaluaciones continuas, llevadas a cabo junto con iniciativas de desarrollo, que proporcionan retroalimentación continua y regular, en lugar de retroalimentación en un momento específico.

Además de contribuir al aprendizaje y mejorar el rendimiento, las RTE también se pueden utilizar para demostrar la rendición de cuentas a diferentes partes interesadas, incluidos gobiernos, donantes, socios ejecutores y beneficiarios.

Cuándo usar la evaluación en tiempo real: Las RTE son más efectivas cuando se usan durante las primeras etapas de una respuesta humanitaria. Esto se debe a que pueden tener la máxima influencia en esta etapa.

Las RTE también pueden, en cierta medida, compensar la falta de seguimiento continuo en un proyecto o programa, ya que permiten realizar ajustes de manera oportuna. Esto puede ser importante en las intervenciones humanitarias, ya que a menudo (a) falta seguimiento o (b) el seguimiento es lento para adaptarse a las realidades que cambian rápidamente. Por lo tanto, las RTE pueden cerrar la brecha entre el seguimiento y la evaluación al identificar las fortalezas y debilidades de una intervención de manera continua.

Las RTE también se pueden utilizar para verificar el cumplimiento de diferentes estándares, como los códigos de conducta o las políticas de la organizaciones: Esto también es importante en contextos humanitarios ya que muchas organizaciones han adoptado diferentes estándares, como los Humanitarian Accountability Partnership (HAP) Standards, que están diseñados para fortalecer la rendición de cuentas ante aquellos afectados por situaciones de crisis.

Quizás el principal desafío para una RTE es que debe verse como una contribución a las mejoras, en lugar de ser un dolor de cabeza burocrático. La responsabilidad recae en la evaluación para demostrar que está contribuyendo a mejorar el rendimiento. De lo contrario, diferentes partes interesadas, con muchas demandas urgentes sobre su tiempo, pueden cuestionar el tiempo y esfuerzo dedicado a la RTE.

Fuentes

▪ Cosgrave, J; Ramalingan, B and Beck T (2009). Real-time evaluations of humanitarian action: An ALNAP Guide. ODI, 2009.

▪ Herson, M and Mitchell, J (2005). “Real-Time Evaluation: Where does its value lie?” Humanitarian Exchange, 32, pp. 43-45.

▪ Polastro, R (2012). Real Time Evaluations: Contributing to system-wide learning and accountability. 

▪ INTRAC. Real Time Evaluation

Y la música, que nos sigue siempre, es hoy en recuerdo de Florian Schneider de Kraftwerk (esta canción nos acompañó a muchos cuando éramos más jóvenes…)

Written by cplysy · Categorized: TripleAD

May 06 2020

How to “Quantify” Qualitative Data


Let’s be clear: sums and frequencies are not the desired product of qualitative questions. In qualitative approaches, we want to describe, to present details and nuances and interesting outliers. But as evaluators, we need to do more than just report what is—we need to comment on what it means. In familiar evaluation terms, moving from the “what” to “so what?”

Qualitative purists may hiss at the idea of quantifying qualitative data. But as evaluators, our job is to apply evaluative thinking to our qualitative findings. Not all findings are as material as others—in other words, the one respondent who thought their nutrition class provided just the right amount of detail is likely overshadowed by the eleven who described feeling overwhelmed at the volume of information. Evaluators would be remiss not to introduce an element of quantification to their qualitative data.

Caveat: I do not intend to suggest that a higher number of respondents reporting a similar answer is always more important. Outliers and small groups matter, and understanding those outliers is a major part of why qualitative approaches are used.

But we do need to be able to describe the proportion of respondents who report similar answers.

The key to quantifying qualitative findings is consistency. Editing reports where descriptions of qualitative data included words like “a lot,” “the majority,” “many” and “most” left me wondering why those particular words were chosen. How is “a lot” different from “many?” Are “the majority” and “most” roughly the same number of respondents? And if I was asking those questions, I know our stakeholders would be asking them, too.

To give my staff concrete guidance, I found this framework… online… somewhere… maybe in 2013? (If this is your framework, or you know who created it, please let me know! I’ve been using these definitions in evaluation and reporting workshops for a few years, and have seen it used in Government of Canada documents, but without attribution.)

Few

Less than 10% of participants

Several

Less than 20%

Some

More than 20%

Many

Nearly 50%

A majority

More than 50%, but fewer than 75%

Most

More than 75%

Vast majority

Nearly all participants, with some still having different views

Unanimous, or almost all

All participants, or the vast majority gave similar answers and the rest did not comment


These definitions may work for you. Or you might take issue with some of the ranges and want to create your own. As I said before, consistency is key! Try using this framework in your next report, and include it in your methods appendix.


Sign up for our newsletter

We’ll let you know about our new content, and curate the best new evaluation resources from around the web!


We respect your privacy.

Thank you!


Written by cplysy · Categorized: evalacademy

  • « Go to Previous Page
  • Go to page 1
  • Interim pages omitted …
  • Go to page 268
  • Go to page 269
  • Go to page 270
  • Go to page 271
  • Go to page 272
  • Interim pages omitted …
  • Go to page 310
  • Go to Next Page »

Footer

Follow our Work

The easiest way to stay connected to our work is to join our newsletter. You’ll get updates on projects, learn about new events, and hear stories from those evaluators whom the field continues to actively exclude and erase.

Get Updates

Want to take further action or join a pod? Click here to learn more.

Copyright © 2026 · The May 13 Group · Log in

en English
af Afrikaanssq Shqipam አማርኛar العربيةhy Հայերենaz Azərbaycan dilieu Euskarabe Беларуская моваbn বাংলাbs Bosanskibg Българскиca Catalàceb Cebuanony Chichewazh-CN 简体中文zh-TW 繁體中文co Corsuhr Hrvatskics Čeština‎da Dansknl Nederlandsen Englisheo Esperantoet Eestitl Filipinofi Suomifr Françaisfy Fryskgl Galegoka ქართულიde Deutschel Ελληνικάgu ગુજરાતીht Kreyol ayisyenha Harshen Hausahaw Ōlelo Hawaiʻiiw עִבְרִיתhi हिन्दीhmn Hmonghu Magyaris Íslenskaig Igboid Bahasa Indonesiaga Gaeilgeit Italianoja 日本語jw Basa Jawakn ಕನ್ನಡkk Қазақ тіліkm ភាសាខ្មែរko 한국어ku كوردی‎ky Кыргызчаlo ພາສາລາວla Latinlv Latviešu valodalt Lietuvių kalbalb Lëtzebuergeschmk Македонски јазикmg Malagasyms Bahasa Melayuml മലയാളംmt Maltesemi Te Reo Māorimr मराठीmn Монголmy ဗမာစာne नेपालीno Norsk bokmålps پښتوfa فارسیpl Polskipt Portuguêspa ਪੰਜਾਬੀro Românăru Русскийsm Samoangd Gàidhligsr Српски језикst Sesothosn Shonasd سنڌيsi සිංහලsk Slovenčinasl Slovenščinaso Afsoomaalies Españolsu Basa Sundasw Kiswahilisv Svenskatg Тоҷикӣta தமிழ்te తెలుగుth ไทยtr Türkçeuk Українськаur اردوuz O‘zbekchavi Tiếng Việtcy Cymraegxh isiXhosayi יידישyo Yorùbázu Zulu