Impact. You know the feeling don’t you – you’ve been working on a brilliant initiative, and then someone turns up and asks you “So – what impact are you making”?
It’s a fair question – indeed, it’s a question we should be asking ourselves. If we are not making a difference, we are wasting our time, aren’t we? In this blog post we look at what we mean by impact, and how we can measure it.
Impact – what is it?
First, let’s be clear what we mean by ‘impact’ – it’s the powerful and long-lasting effect that something we’re doing has on a situation or on people. So, for example, if we run a programme encouraging women to become entrepreneurs, hopefully some of them will set up successful businesses – that’ll be our impact.
The question now is: how do we know if we are achieving what we want? Well, we are going to have to measure the impact… And this is not always as difficult as it first sounds. Most things can be measured . Check out my brief blog post on We can measure (nearly) anything.

The 5 steps to measure impact of social innovation
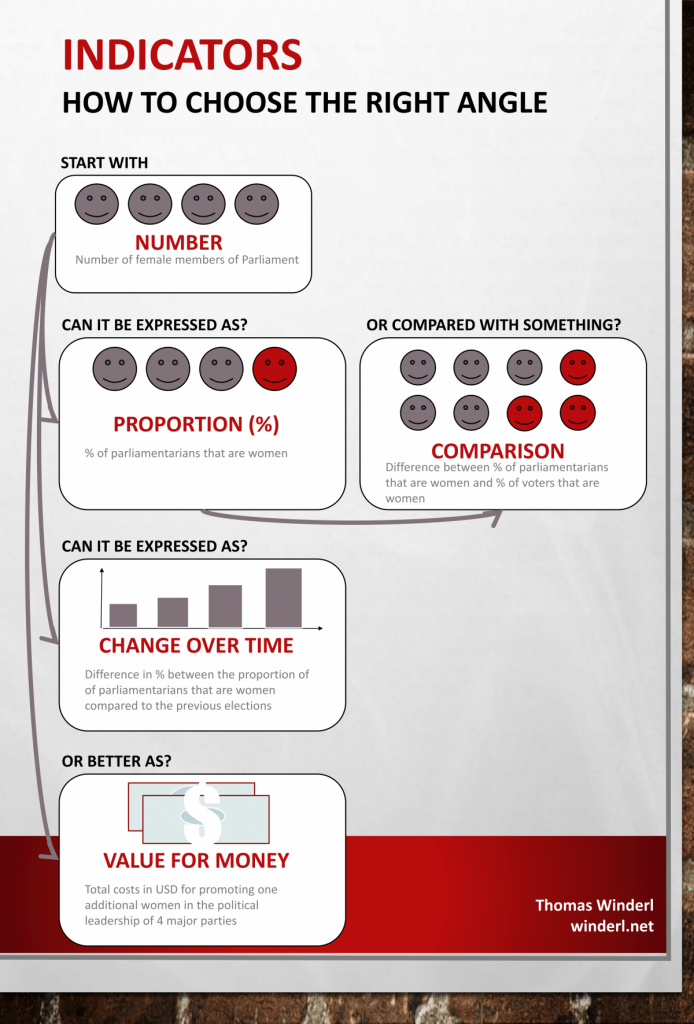
To measure impact, we are going to need data – in other words, facts. So, to go back to our example, we could look at what percentage of trainees who set up a business, how the business grows, and how much income they generate.
Importantly, we need TWO measures – we need the data before our intervention and the data following our intervention – hopefully, when we compare the two, we will see that there’s been an improvement. If not, we have wasted out time!
So how can we get our data? This is where the five steps to measure impact of social innovation come in.
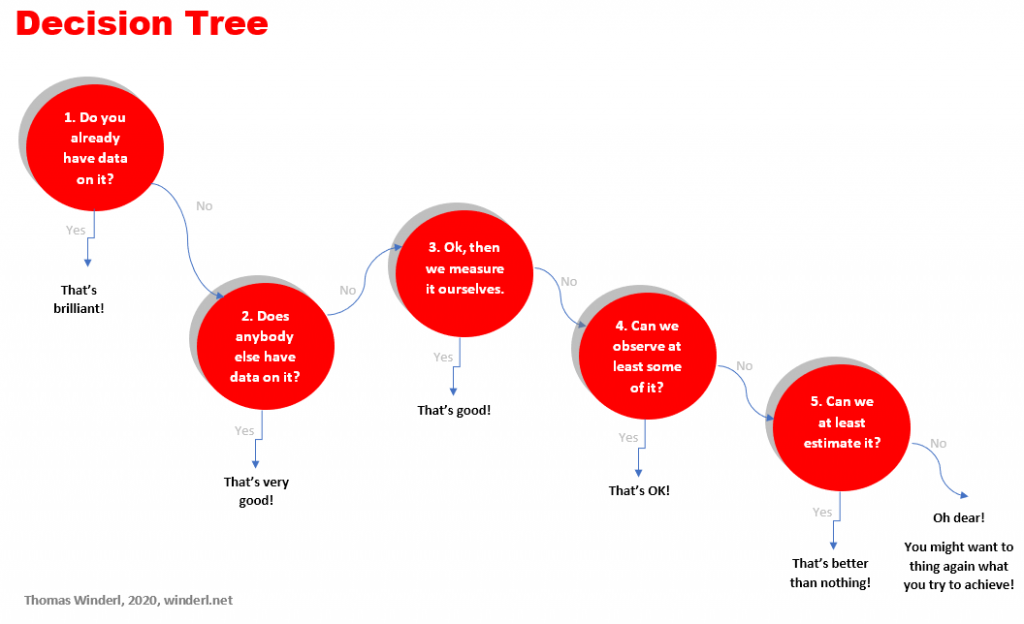
Step 1: Dig deep into what we already know
You would be surprised; we often have more data available than we realise. In step 1, we carefully think through what data we are already collecting. For example, we are likely to have administrative or financial data. If we do training, we will also have data on trainees.
Example
We are training young people on digital innovation
Think about it! We already know how many attend our training and for how long; we just have to look at the attendance sheet the participants sign every day during our training. This is valuable data
We also know who the people are that attend our training, including their sex and age, just by looking at the trainee profiles filled out by applicants.
We can find out the extent to which participants have acquired new skills by comparing their skills before and after the training
And we may even have an idea of how many of our participants have managed to set up businesses or find employment – just check the call log and notes from meetings with previous participants who have come back to us to ask for further support.
Step 2: Do some research about others
If we don’t have data, it’s possible that somebody else has useful data. So, before thinking about getting new data ourselves, let’s see if it is already being measured in some way by someone else. That is our step 2.
This will require some research – at least a careful search on the internet and government and non-governmental websites.
This is our chance to be a ‘clever detective’: Consider using big data, national statistical databases and reports, international data repositories, national or international surveys and indices.
Example
A youth organisation is sending a caravan across Morocco to promote the Sustainable Development Goals. We want to measure if people become more aware of the SDGs. OK, so here’s an easy way: use Google Trends to track how many people search for the term “SDG” over time.
Example
A Ministry runs an awareness campaign to stop sexual harassment. After some research, we find out that HarassMap, a volunteer-based initiative in Egypt, already records reported incidences of sexual harassment. This data can be analysed and used to track high-level impact of the awareness campaign over time.
Step 3: Measure impact it yourself
If we do not have data ourselves – and nobody else has it either – it’s time to put our thinking hats on : We need to measure it ourselves.
Just about every imaginable phenomenon leaves some evidence that it occurred. Let us look for any trails it leaves, consider tagging it or carry out experiments:
a. Can we observe it directly?
For example, we have done some training for unemployed people in Somalia, and this requires us to measure to what extent trainees are successful in producing mobile apps. To do that, we regularly count the number of published apps with at least four stars on Google Play with the keyword “Somalia”.
b. If we can’t observe it directly, can we tag it to start tracking?
For example: 500 young people in Iraq are trained in entrepreneurship and design thinking. Six months after finishing the training, we offer 50 randomly selected trainees an additional day of tutoring with a group of established businesswomen and men. During this tutoring, we ask them to fill out a one-page questionnaire that helps us measure their success and ability to obtain additional loans.
c. If all else fails, can we create an experiment to create the conditions to observe it?
For example: A network of youth organisations support young people in political participation. To measure success, we compare how many young people under 21 are elected to councils in three supported cities compared to three similar councils in the same region that were not supported
To collect data ourselves, we have a full toolbox from Social Sciences available to us. I wrote about this toolbox in another blog post.
Step 4: Use sampling to measure impact
This is my favourite part: Step 4 is about sample surveys to collect data.
Sampling is like magic: We observe just some of the things we are interested in, and from this we can learn something about all things.
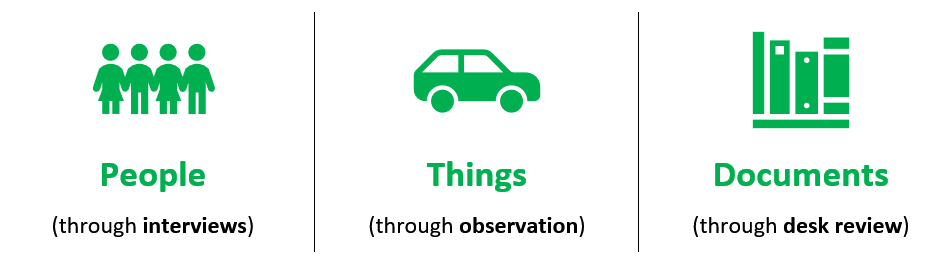
Sample surveys can be used for people, things and documents.
And sample surveys can be small, simple and cheap, including only a single observationor one or two questions.
Example
An organisation in Somalia provides 2,000 young people with new skills in digital innovation. We want to know the impact.
Rather than interview all of them, we randomly select 100 young people at the training graduation and ask them to leave an email address. Six months later, we ask them if they have found employment, in what area and how much they earn now.
Then, we ‘extrapolate’. That is to say: if we find that, for example, 60 of our 100 people we track have found work in the ICT sector and are earning an average of, say, $400 a month, then we can assume the same pattern will be found in all 2,000 trainees – i.e. that 60% of the 2,000 trainees are working, and that our training has created a total additional monthly income of $480,000. Multiply that over twelve months, and that’s well over $5 million in a year! That’s a BIG impact!
Step 5: Estimations for measuring impact
Ok. If nothing has worked so far, we have one last option up our sleeves: estimations. No, I didn’t say ‘make things up’ (that wouldn’t be right) – but we can get indications of impact by estimating data based on what we know already. Not convinced? Let’s look at an example:
Example
We want to know how many people our Sustainable Development Goals campaign reaches. We want to know how many young people we have reached in a year through our the campaign.
Counting every single participant at every of our 200 events per year would be a nightmare. However, we can take a photo of 15 randomly selected events. We roughly count the number of people on the picture and take an average. Let’s say 50 people on average show up.
Nothing works? Rethink what you do!
Ok. If nothing has worked so far, we may have a problem.
If we cannot measure it at all, we may need to think again about what we are trying to achieve!
The post Measuring impact of social innovation appeared first on Thomas Winderl.