• Skip to main content
  • Skip to footer
  • Home

The May 13 Group

the next day for evaluation

  • Get Involved
  • Our Work
  • About Us
You are here: Home / Archives for cplysy

cplysy

Oct 25 2021

Evaluation Report Inspiration: Excerpts From A Breast Cancer Clinic Evaluation


Evaluators do not often share their evaluation reports. The organization or client that the evaluator works for usually owns the report, which can make sharing them difficult. But sometimes it can be helpful to see what and how information is presented in an evaluation report.

A few years ago, we completed an evaluation for a breast cancer clinic. In honour of Breast Cancer Awareness month, we thought we would highlight some excerpts from that report to help inspire your next evaluation report!


  1. Describing the evaluation

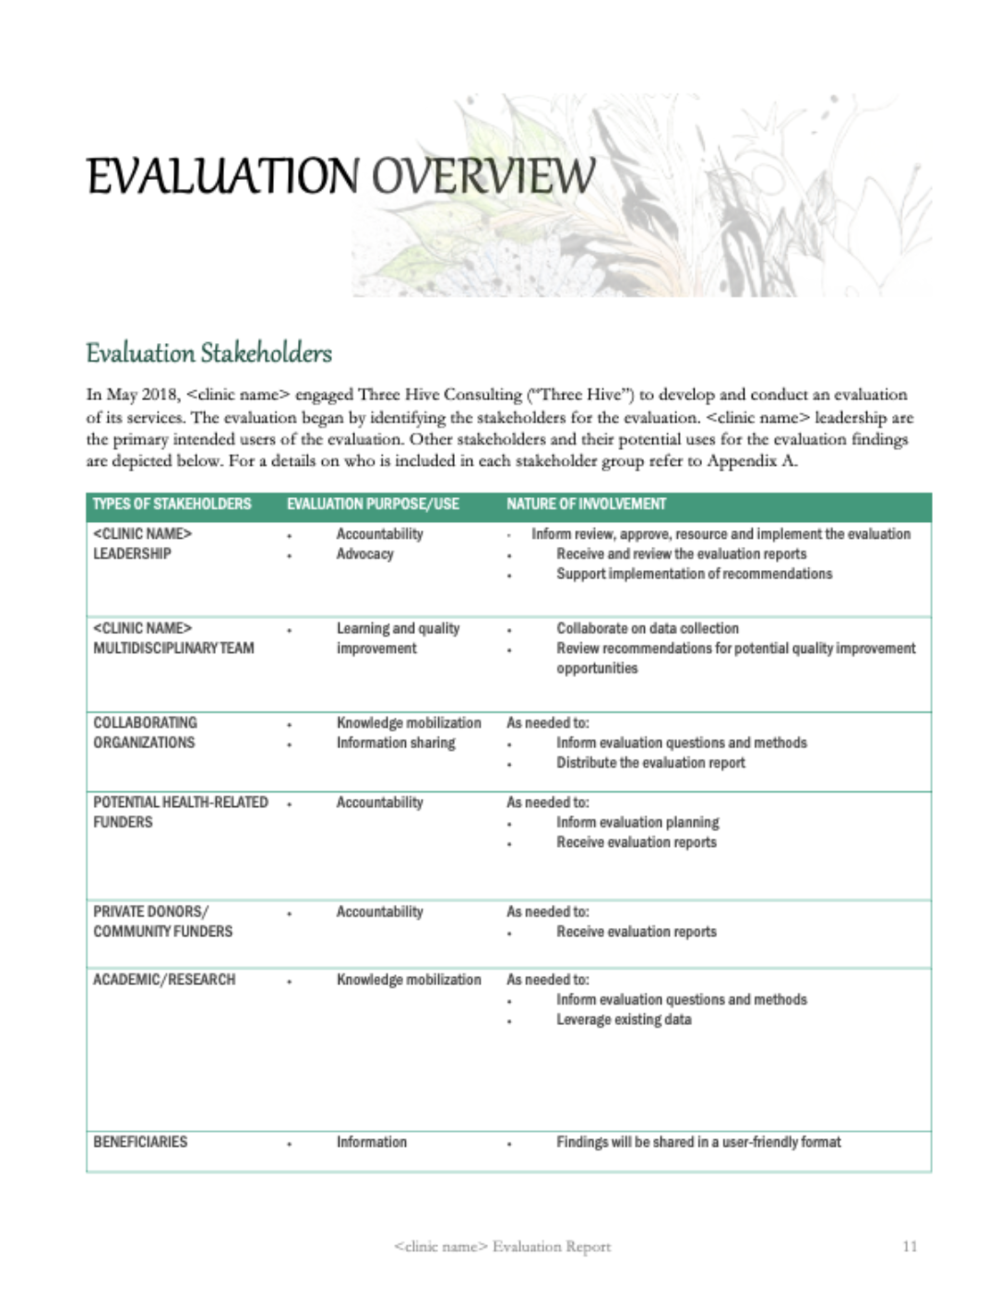
In our reports we like to acquaint the audience with an overview of the evaluation near the beginning of the report. In the evaluation overview, we try to provide a high level understanding of the evaluation plan and how it was developed.

For this evaluation, the stakeholders requested we include an abbreviated stakeholder matrix that we co-created at the beginning of our evaluation planning.  

 An evaluation can’t be all things to all people, and by including a stakeholder matrix identifying the primary intended users, we showed that all stakeholders were considered and involved in the evaluation in some way (as outlined in the “nature of involvement” column).

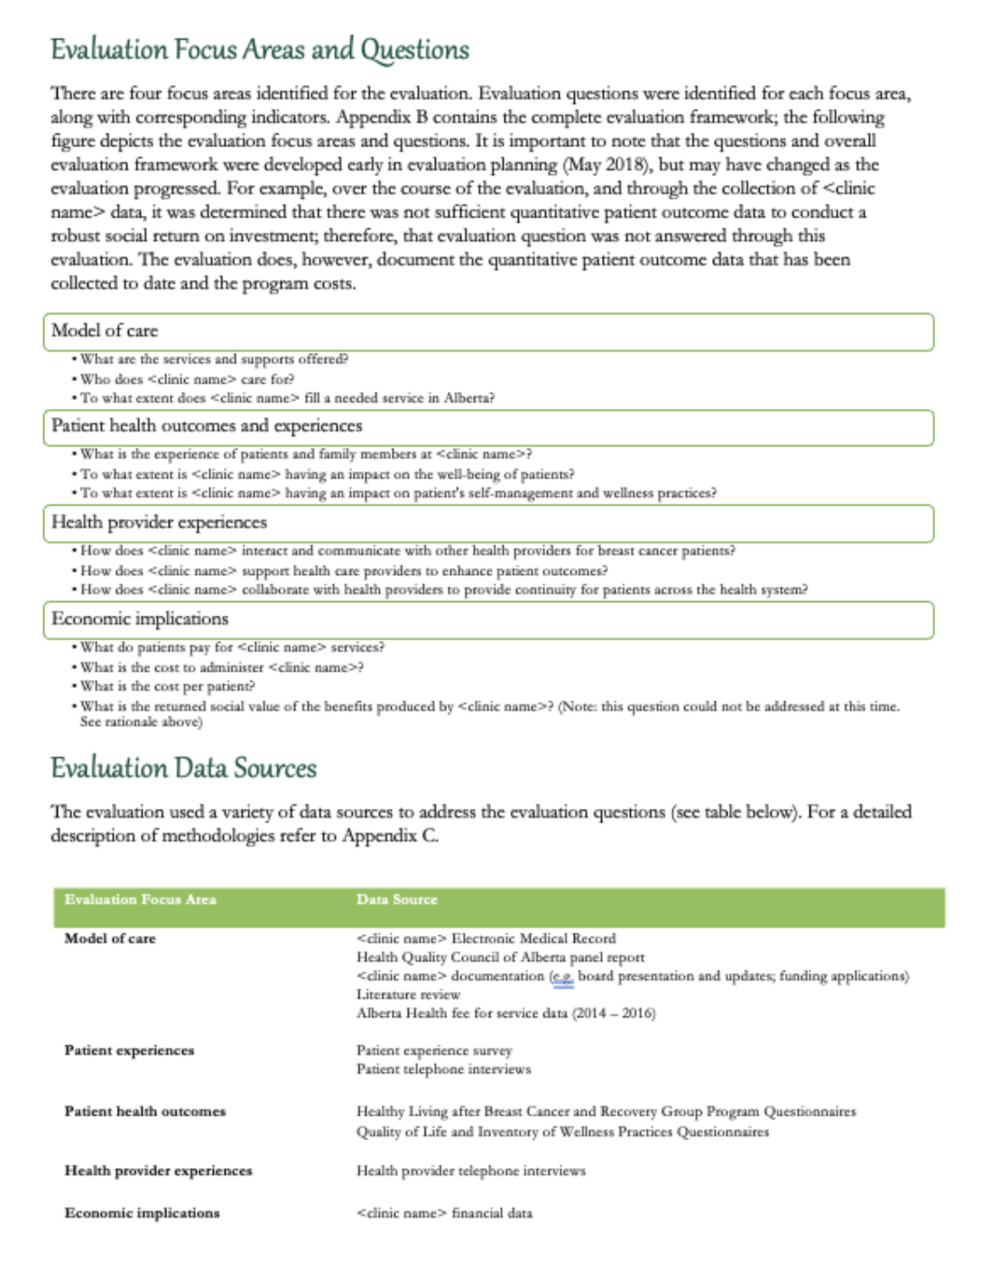
This evaluation had four focus areas:  

  1. Describing the model of care,  

  2. Reporting on patient outcomes,  

  3. Reporting on health provider outcomes, and  

  4. Describing the costs.  

Each focus area had corresponding evaluation questions. These questions were answered using mixed methods. We don’t want to overwhelm the reader by going into the detailed minutia of our methods, so usually we append that at the back of the report and include a high level overview of our data sources near the beginning of the report.

2. Describing the clinic

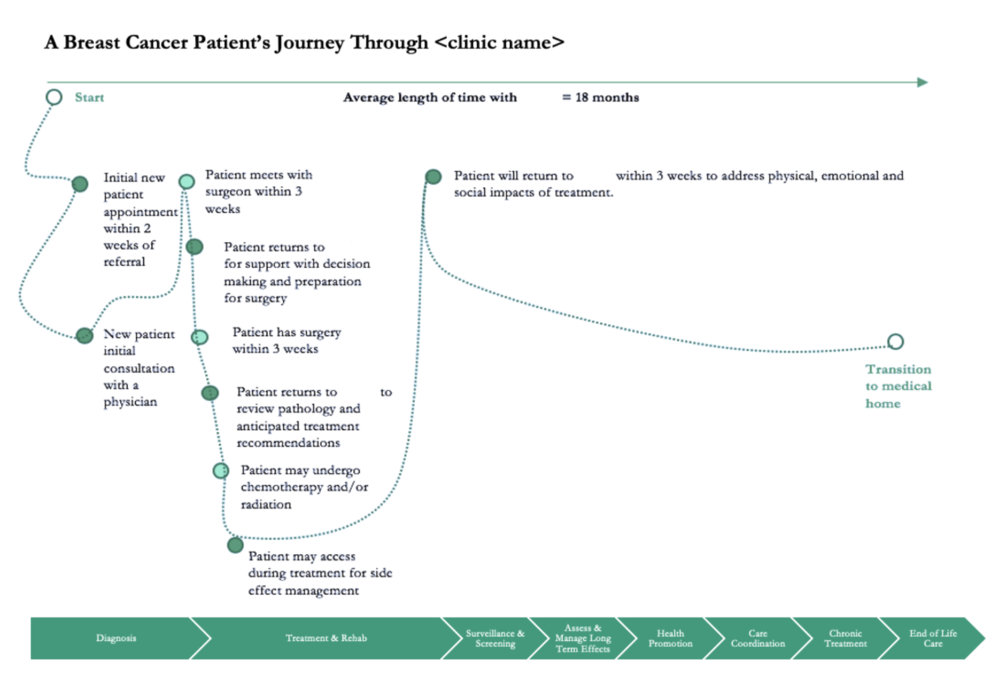
In this evaluation we needed to describe the clinic and its model of care (see evaluation questions under model of care). We did so using narrative and a number of figures, including the ones below.

This figure was created using PowerPoint and shows a breast cancer patient’s journey and the clinic’s role in that journey.

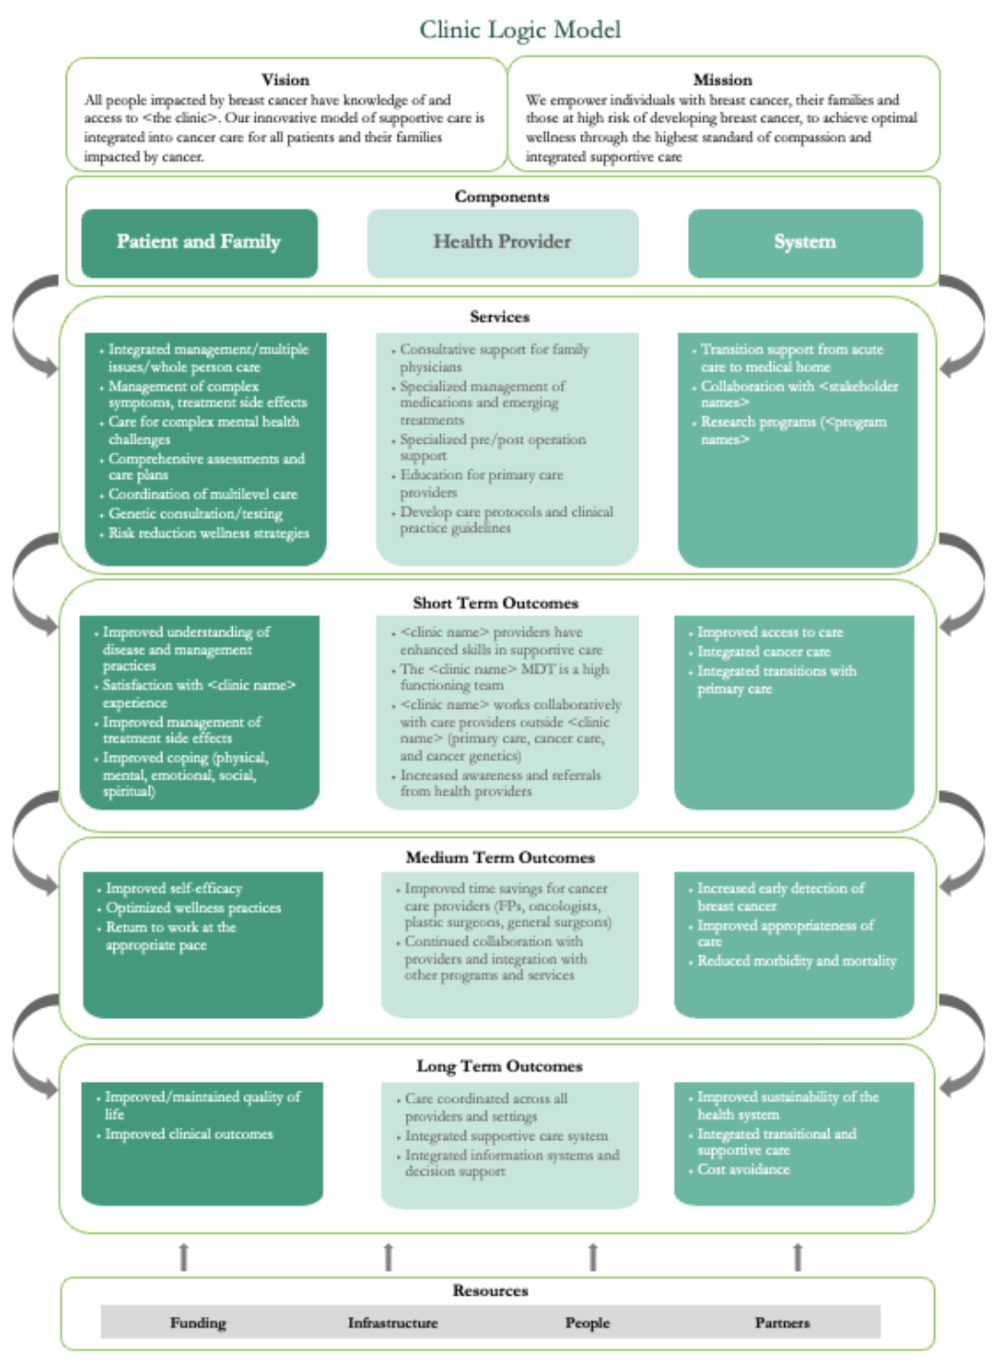
Logic Models can be a great communication tool to describe a program. There was a more detailed logic model created for this clinic; however, for the purposes of this report we simplified it to this one-page overview using SmartArt. (We know SmartArt isn’t for everyone! Check out this article by Dr. Echo Rivera for some SmartArt alternatives.)

3. Describing the findings

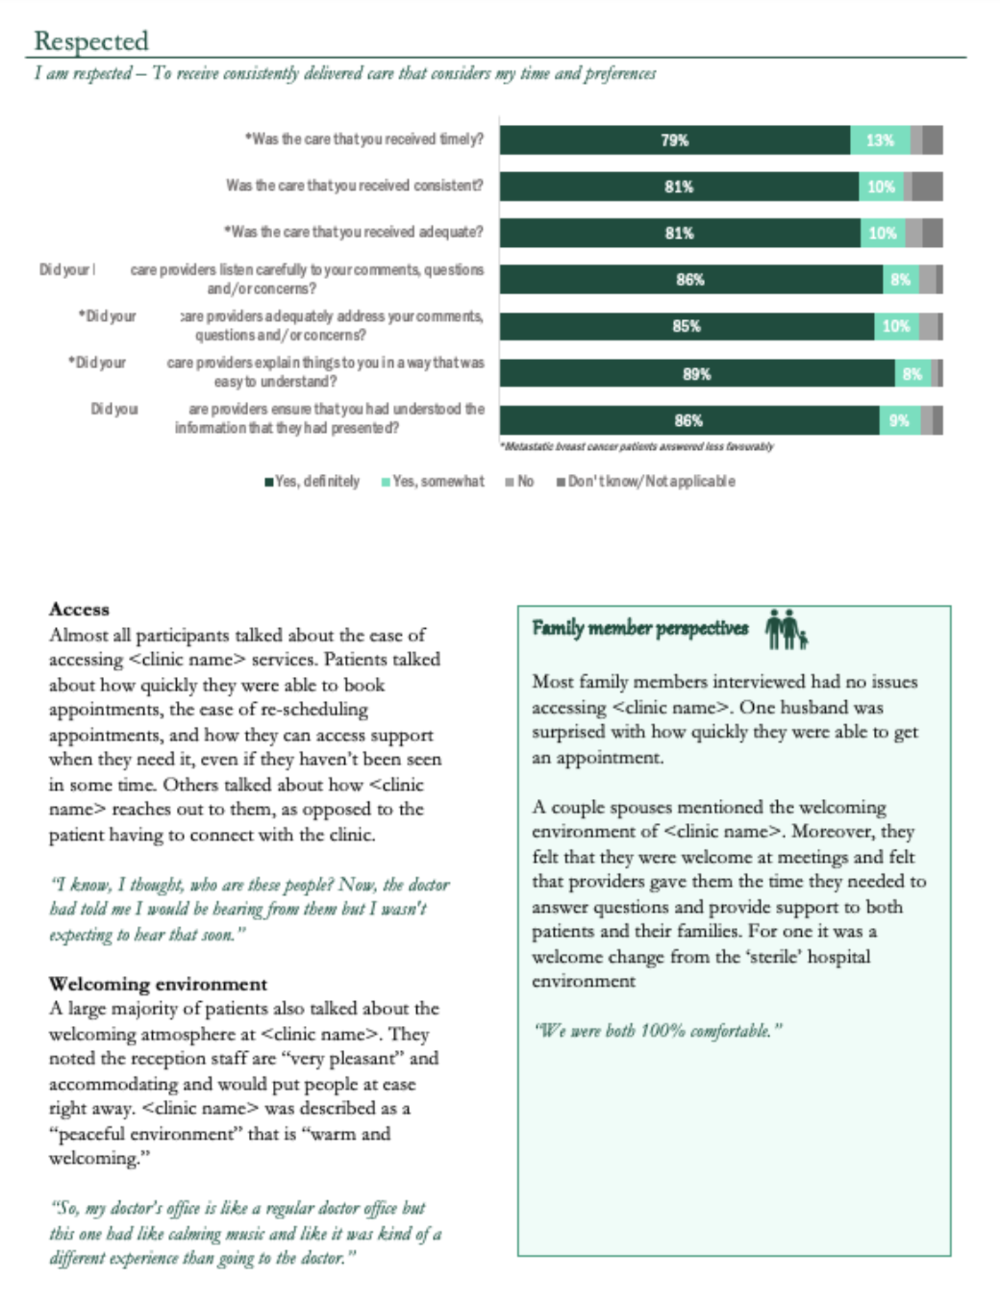
We collected survey data and interview data from patients and family members. We wanted to present that information in a cohesive way instead of using headings like “patient survey findings,” “patient interview findings,” and “family interview findings.” Instead, we used the Canadian Partnership Against Cancer’s pillars of a positive patient experience frame how the results were reported.

We showed the relevant survey findings and incorporated interview findings from both patients and family members. Family member perspectives were highlighted with a call out box and an icon to cue the reader that the information was from family members and not patients.


Unfortunately, we can’t share with you excerpts from the report where we helped interpret the findings and recommended next steps, since these are specific to the clinic and their stakeholders. However, we hope we have provided you with some inspiration to help inspire your next evaluation report. 

If you’re looking for more reporting ideas and inspiration, check out our Six Hacks For Renovating Your Evaluation Report series of articles. Or feel free to reach out to one of our Eval Academy coaches.  


Sign up for our newsletter

We’ll let you know about our new content, and curate the best new evaluation resources from around the web!


We respect your privacy.

Thank you!


Written by cplysy · Categorized: evalacademy

Oct 25 2021

3 Tips to Move from Spooky to Success when Reporting

This post shares 3 tips to move from spooky to success (or confusion to clarity) with your reports. These include: Discuss reporting during contracting, present multiple options, and report early and often.

The post 3 Tips to Move from Spooky to Success when Reporting appeared first on Elizabeth Grim Consulting, LLC.

Written by cplysy · Categorized: elizabethgrim

Oct 22 2021

How to report on the web. My Splash Model strategy.

Today’s post outlines a modern reporting strategy that I call the splash model.

In today’s post:

  • A recap, why it’s time for a strategy change.
  • Avoiding the Social Media time suck.
  • Your big three audiences.
  • Big splash content.
  • Byproducts and adaptations.
  • Serve the 1st tier first.
  • Then serve the 2nd tier.
  • 3rd tier by extension.
  • When you know your whole audience.
  • When you want to grow your audience.
  • For more information.

A recap, why it’s time for a strategy change.

So I wrote a whole post on why I think we need a change in the way we report. You can read the whole thing here, Stop Reporting Like it’s 1999.

But here is the TL/DR version.

A lot has changed on the web over the last 20+ years. But many organizations are still reporting the same way they did two decades ago, by simply uploading a PDF to a big resource library. It’s time for a change.

Avoiding the Social Media time suck.

I think a lot of organizations feel like they need to show up big on social media. Or at least, that’s where they think they should go first.

Yes, it’s pretty easy to create a tweet, a Facebook post, an Instagram post, or even a TikTok video.

But for most of us, Social Media is a trap.

On the surface it’s just a little bit of work. But to do social well, you have to put in that work, over and over and over again. Day in, day out. And ultimately, it becomes a lot of work. And for what?

There is an alternative though, and that’s to go big instead of going small. To do something big on occasion instead of doing something small constantly.

Your big three audiences.

We have three main audiences.

The first tier is our primary audience. Ideally it’s the people you know already (you may even have their email addresses). This is not a casual audience but people who hopefully care deeply about what you plan to share.

The second tier are people who know you. They are the people who follow your work (and likely follow your organization’s social media accounts). They are a casual audience, when the stuff you share is relevant they may click, look, read, and engage.

The third tier are the people who know the people in tier 1 and tier 2. They might not know your work directly, but they will see it when it’s shared by those in the first two tiers. These are the people outside of your direct followers who are “reached” when you share your work and those who find your stuff using Google.

Big splash content.

Big splash content (aka anchor content) is the kind of stuff people will give you their email address to get. This could be webinars that you register to attend, ebooks that you register to download, or communities that you register to join. And yes, this could even be a big PDF report.

This is content with a high perceived value. It’s not a throw-away social media post that has a half-life of just a few hours. It’s not a generic blog post that may or may not be designed specifically for the audience you are trying to reach.

For example, what if every time you released a report you had a release party webinar? In that webinar you feature the voices of the program sites, stakeholders, partners, and evaluators. The report is still the thing that you are sharing, but now it’s more than just a button click and skim.

A report can be big splash content. Take this “Flagship Report” created by UNICEF or the Gates Foundation Goalkeepers report. But you have to treat it like it’s something special. If you treat it like a blog post, sharing it along with a simple tweet, a Facebook share, and a single mention in an email newsletter, it’s not going to have that much of an impact. You can’t just share the link, you have to adapt and expand into other forms of content (like infographics or videos) in order to boost the impact and make a bigger splash.

For instance, the UNICEF flagship report was paired with an interactive data dashboard, video, resources for parents, resources for youth, a social media hashtag campaign, assorted infographics you might only find within their social media feed, and other stuff you’re likely only to see if you are part of a specific UNICEF audience.

Byproducts and adaptations.

The cool thing about big splash content is that it naturally leads to other content. A webinar for example might also lead to the creation of the following byproduct content.

  • Announcement Email
  • Calendar Entries
  • Registration Page/Image
  • Announcement Blog Post
  • Announcement Social Posts
  • Follow-up Emails
  • Follow-up Posts
  • Speaker recruitment
  • Slides/Webinar Recording
  • Mentioned Links & Resources

Adaptations are similar to byproducts, but more intentionally created to help reach 2nd and 3rd tier audiences. Where byproducts are just a result of doing something big, adaptations are focused on reaching specific audiences.

  • Slide Inspired Infographics
  • Blog Post Speaker Introductions
  • Q&A Inspired by Webinar (Blog post or social)
  • New Resources Inspired by Webinar (Blog Post)
  • Clipped Video Content
  • Social Media Questions
  • Event screenshots
  • Quote posts with hashtags

Serve the 1st tier first.

Your report audience is never a monolith. It’s not just an amalgamation of all the different stakeholder groups you can brainstorm on a whiteboard. Different audiences have different needs and desires.

Your job should be to serve the first tier audience first. This requires you to know who is in that first tier. If you have not had that discussion within your organization, you have it before you share your report.

Anything big you do should be of greatest value to those target audience members. If you don’t actually know these people, the big splash content should draw them in. If you do know these people, the big splash content should just be something they will greatly value.

Speaking just to us

Then serve the 2nd tier.

Your second tier is served intentionally by adapting your content to meet the needs of these different stakeholder groups. They are not your primary audience, but you can still serve their needs. Infographics, slidedocs, videos, and other assorted content should be adapted from your report or associated content. The goal is not to rewrite the report, but adapt it into a shorter format with a new audience in mind.

3rd tier by extension.

The third tier of your audience will be reached by extension. The better your big splash anchor content and adaptations, the wider the audience reach. By directly partnering with 1st and 2nd tier audience members in the creation of your content (panel discussion webinars, collaborative blog series, and collaborative social media) you will expand your reach into the 3rd tier. Reaching the 3rd tier requires temporarily borrowing audiences built by others.

When you know your whole audience.

When you known everyone in your 1st tier audience (and serving 2nd and 3rd tier audiences is not within your project scope) then a strategy like this is irrelevant. Just create things to serve that audience, and send them emails or call them on the phone. You likely don’t need social media or even bunches of report adaptations.

When you want to grow your audience.

Let’s say you know a few of your target tier 1 audience members, but there are more out there in the world that are currently unknown. Perhaps they follow you on social, but you don’t yet know them. Your goal for your big splash content will be to build your known audience (by asking for emails!). You’ll also want to build your second tier (by asking for social follows).

But when you design your content still focus on serving the people you know first. To broaden your reach, you start by solidifying your core known audience. The smaller your known audience, the more you will need to partner with 1st and 2nd tier audiences to expand your reach.

For more information.

One day I’ll write this all down, with more supporting evidence and examples, in a book. But given how busy I keep myself, I don’t think that will happen anytime soon. This is the way I conceptualize modern reporting, and it seems to work well when I initiate the strategy. But it is still certainly a work in progress.

Until it’s more fleshed out, I talk about it a bit in my workshop. But whether or not you follow the model doesn’t really matter. Because ultimately reporting this way is just about the following.

  • Known who you are serving.
  • Serve your main audience first with significant content.
  • The more reach you want your report to have, the more report adaptations you need (infographics, etc.).

But if you have any thoughts, I would love to hear them.

Written by cplysy · Categorized: freshspectrum

Oct 20 2021

Be Grassroots and Data Driven

Starting with a simple question can lead to bigger impact.  What does it mean to be data-driven as a nonprofit or smaller grassroots organization? You’re navigating being responsive to the communities you serve, providing services and programming that provide a more just and equitable world, while also being responsive to demands on your organizational capacity. […]

The post Be Grassroots and Data Driven appeared first on Nicole Clark Consulting.

Written by cplysy · Categorized: nicoleclark

Oct 19 2021

Consent Part 2: Do I need to get consent? How do I do that?


Is Consent Always Needed?

Consent to participate in an evaluation project may not be required if the risks posed to an individual are normal, or no more than routine care. A good rule of thumb is that “the level of consent should match the level of risk.” A thorough ethical review may help if you’re unsure what this means. Quality improvement projects where participant information is used to inform improvements but kept confidential may not require consent, whereas interviewing members of a vulnerable population may require a comprehensive consent process. 

Some questions to consider when assessing the risk of participation may include: 

  • What are the impacts of a breach of confidentiality? 

  • Is the topic sensitive in nature? Does it address a stigmatized behaviour or population, religious, culture or legal issues? 

  • What is being asked of the participant? Does it cause any burden? 

  • Is there risk of causing psychological distress? 

There are a few more considerations and principles to cover: 

1. Capacity

Capacity is the ability to understand and appreciate the information being provided. Those with diminished capacity may still (and are encouraged to) be involved in the consenting process. It is important that each consenting participant is fully aware and capable of providing consent. Commonly, this means being over the age of 18, free from the influence of drugs or alcohol, and free from any mental or physical illness that may impair decision-making or understanding.  Check out our article where one of the Eval Academy team encountered problems with capacity and how she dealt with it.  

Importantly, capacity may change over time and there are projects where you may need to assess capacity multiple times. 

2. Coercion

It is possible that the invited participants feel obligated to participate. Falagas found that only 47% of participants truly understood the voluntary nature of participation. This is alarming and suggests that reasons for participation may rise from fear of being denied services or a power imbalance between the project lead and the invitee. Asking yourself about perceived or real power imbalances or conflicts of interest between participants and project leadership is a good place to start.

3. Revisiting Consent

Importantly, consent can change; it must be obtained and maintained. In projects that have a longitudinal time component, consent should be revisited at each touchpoint throughout a project. Reminders can be given about what has been previously consented to, the nature of remaining participation, changes in capacity can be assessed, the right to withdraw may be presented and/or a new opportunity to ask questions may be offered.

4. Evidence of Consent

Evidence of consent is an important part of the process. Evidence may be important should adverse events occur within the project to show that participants were fully informed prior to participation. As described in Part 1 (link), each form of consent has a means of providing evidence.  

Evidence of consent may be: 

  • a (signed) consent form 

  • a documented process or script for obtaining oral consent 

  • a recording of verbal consent 

  • field notes from the data collector about the consent process 

  • through the actions of the participant (i.e., implied consent) 


There is limited information available to guide the consent process in evaluation work. The ARECCI guidelines and screening tool are an excellent resource to get project leads to question the need for consent and the ethical issues surrounding consent (e.g., power imbalances, conflicts of interest, information sharing, or the confidentiality associated with participation). 

Ultimately, thoughtful consideration of the consent process is an important project design step. If consent is required, documentation of the consenting process allows for evidence that the consent process has been planned and will be applied systematically. 

Consent can be a huge part of an evaluator’s role, but it isn’t always scary. If you still have questions reach out to us – we’d love to chat about this more!  


Sign up for our newsletter

We’ll let you know about our new content, and curate the best new evaluation resources from around the web!


We respect your privacy.

Thank you!


Written by cplysy · Categorized: evalacademy

  • « Go to Previous Page
  • Go to page 1
  • Interim pages omitted …
  • Go to page 156
  • Go to page 157
  • Go to page 158
  • Go to page 159
  • Go to page 160
  • Interim pages omitted …
  • Go to page 304
  • Go to Next Page »

Footer

Follow our Work

The easiest way to stay connected to our work is to join our newsletter. You’ll get updates on projects, learn about new events, and hear stories from those evaluators whom the field continues to actively exclude and erase.

Get Updates

Want to take further action or join a pod? Click here to learn more.

Copyright © 2026 · The May 13 Group · Log in

en English
af Afrikaanssq Shqipam አማርኛar العربيةhy Հայերենaz Azərbaycan dilieu Euskarabe Беларуская моваbn বাংলাbs Bosanskibg Българскиca Catalàceb Cebuanony Chichewazh-CN 简体中文zh-TW 繁體中文co Corsuhr Hrvatskics Čeština‎da Dansknl Nederlandsen Englisheo Esperantoet Eestitl Filipinofi Suomifr Françaisfy Fryskgl Galegoka ქართულიde Deutschel Ελληνικάgu ગુજરાતીht Kreyol ayisyenha Harshen Hausahaw Ōlelo Hawaiʻiiw עִבְרִיתhi हिन्दीhmn Hmonghu Magyaris Íslenskaig Igboid Bahasa Indonesiaga Gaeilgeit Italianoja 日本語jw Basa Jawakn ಕನ್ನಡkk Қазақ тіліkm ភាសាខ្មែរko 한국어ku كوردی‎ky Кыргызчаlo ພາສາລາວla Latinlv Latviešu valodalt Lietuvių kalbalb Lëtzebuergeschmk Македонски јазикmg Malagasyms Bahasa Melayuml മലയാളംmt Maltesemi Te Reo Māorimr मराठीmn Монголmy ဗမာစာne नेपालीno Norsk bokmålps پښتوfa فارسیpl Polskipt Portuguêspa ਪੰਜਾਬੀro Românăru Русскийsm Samoangd Gàidhligsr Српски језикst Sesothosn Shonasd سنڌيsi සිංහලsk Slovenčinasl Slovenščinaso Afsoomaalies Españolsu Basa Sundasw Kiswahilisv Svenskatg Тоҷикӣta தமிழ்te తెలుగుth ไทยtr Türkçeuk Українськаur اردوuz O‘zbekchavi Tiếng Việtcy Cymraegxh isiXhosayi יידישyo Yorùbázu Zulu