• Skip to main content
  • Skip to footer
  • Home

The May 13 Group

the next day for evaluation

  • Get Involved
  • Our Work
  • About Us
You are here: Home / Archives for cplysy

cplysy

Nov 05 2021

From data to actionable insights


As evaluators, we are rarely organizational decision-makers; it is our job to provide those decision-makers with actionable insights. In this article I highlight how you can translate data into meaningful findings, or insights, so you can support decision-makers to drive action within their organizations.


Asking the right questions

The process of deriving actionable insights from data starts with asking the right evaluation questions. What do your clients need to answer to tell their stories? Evaluation questions are the starting point to any analysis and the answers are the end point. As the anchors of your analysis, it is crucial to dedicate time with your clients to iron out these evaluation questions; they will provide needed context to all results garnered from the analysis. 

If you are struggling with writing evaluation questions, we have previously written about how to write evaluation questions (with sample evaluation questions). Refer to these articles for more details on establishing effective evaluation questions. 

Start with the data that you have

Make life easier on yourself: start with the data that you have. Data collection takes time. Rather than expending a bunch of resources on data collection, evaluate whether current data sources are sufficient to answer the evaluation questions.  

However, there will be instances when the data required to address the evaluation questions do not exist. In this case, you may need to develop data collection tools (e.g., surveys, interviews) to collect relevant data. Keep things simple and focus on the evaluation questions. Anchoring the data and analysis in your evaluation questions maintains focus, limiting the ability for a project’s scope to creep beyond what was originally agreed upon.  

Which data collection tool you select will depend on the evaluation question and your evaluation design or approach. However, surveys are usually a quick and cost-effective method for collecting data. For example, your evaluation question may ask: “To what extent do patients have a positive experience with primary care programs and services?” To answer this question, we could design a patient survey. The survey could include questions on satisfaction with specific programs and services or overall satisfaction with primary care. The survey should ask questions that will directly address the overall evaluation question. Fewer direct questions are recommended over many tangential or unrelated questions. 

While this is a simplified example, a survey is not limited to answering a single evaluation question. Survey tools can be designed to capture data for one or many evaluation questions. The key is to make sure all questions align with your evaluation questions; this will focus the survey and capture data relevant to the overall goal of your evaluation. 

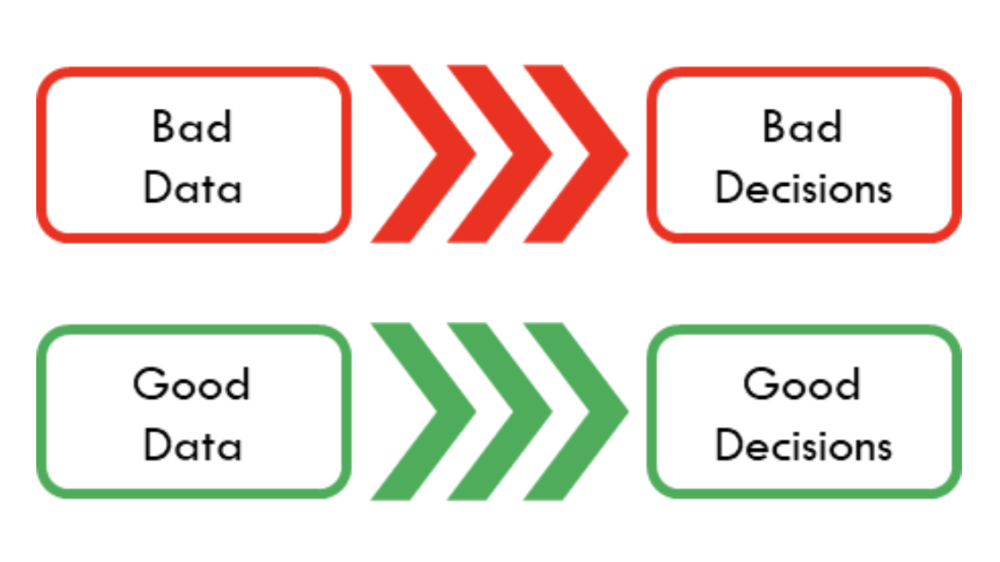
“Garbage in, garbage out”

The results of any data analysis are only as good as the data themselves. If data quality is not ensured, the results of your analysis will be suspect and likely invalid. It is critical that data are scrutinized prior to analysis to establish confidence in the results and insights drawn from the analysis. Therefore, prior to analysis, data quality needs to be evaluated on: 

  • Completeness – are the data sufficiently complete to address your evaluation questions? 

  • Accuracy – do the data correctly reflect the data being collected? 

  • Consistency – do data reflect the same information within and across data sources? 

  • Validity – do the data align with pre-determined conditions/ formats? 

  • Uniqueness – are data represented once within a given data set? 

  • Timeliness – are data up to date to adequately address your evaluation questions? 

Likely, data will not meet all dimensions of data quality right away. Some dimensions of data quality can be fixed with simple data cleaning (e.g., correcting minor typos and formatting dates). Other times data points may be excluded from the analysis. However, it is crucial that the data meet all dimensions of data quality prior to analysis to ensure accurate results.

Data to information

Spreadsheets, regardless of their size and complexity, only store data. That is, a spreadsheet does not provide any meaningful information until the data are structured and organized in a meaningful way. Analysis takes the data building blocks and structures them into something useful (i.e., information). This information will, again, be tied back to the evaluation questions outlined prior to the analysis. 

Information may be summarized as numbers (e.g., proportions, tables) or images (e.g., charts, infographics). How information is structured and presented are dependent on the context of the evaluation questions asked. The key is to provide information that is simple and easy to interpret. 

Sample “information”: 

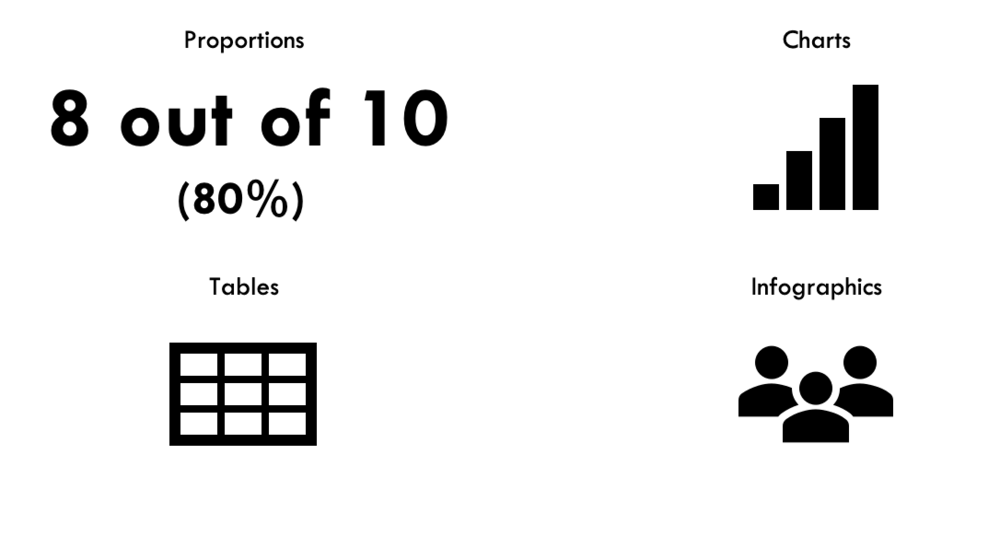
Information should focus on meanings. What do the data illustrate? How does the information connect to the evaluation questions? This is accomplished by focusing the information. That is, focus on one major point per piece of information. By narrowing the focus, you are better able to communicate that information with decision-makers.

Actionable insights

Now that data have been converted into information, it is time to take that information and transform it into actionable insight. Actionable insights come from taking the information gleaned from an analysis and getting at the “so what?” 

 Getting at the “so what?” is not always easy. But there are a few approaches to move insight to actionable insight, including: 

  • Segmenting (or grouping) the results 

  • Using data visualizations to support the results 

  • Comparing to benchmarks (e.g., time series, norms) 

  • Adding additional context 

Segmentation 

Segmenting data into discernable groups can help get at the “so what?” Segments, such as demographics, split the results of the analysis into comparable groups. Which segments you investigate are dependent on the evaluation questions asked. 

Looking within an organization? Segment by department to derive insight into potential departmental differences. 

Looking at financial literacy outcomes? Segment by age or gender to derive insight into potential learner differences. 

Segmenting the information derived from your analysis may help identify patterns in the results. Patterns may identify important differences between segments that will allow for the client to better develop an action plan. 
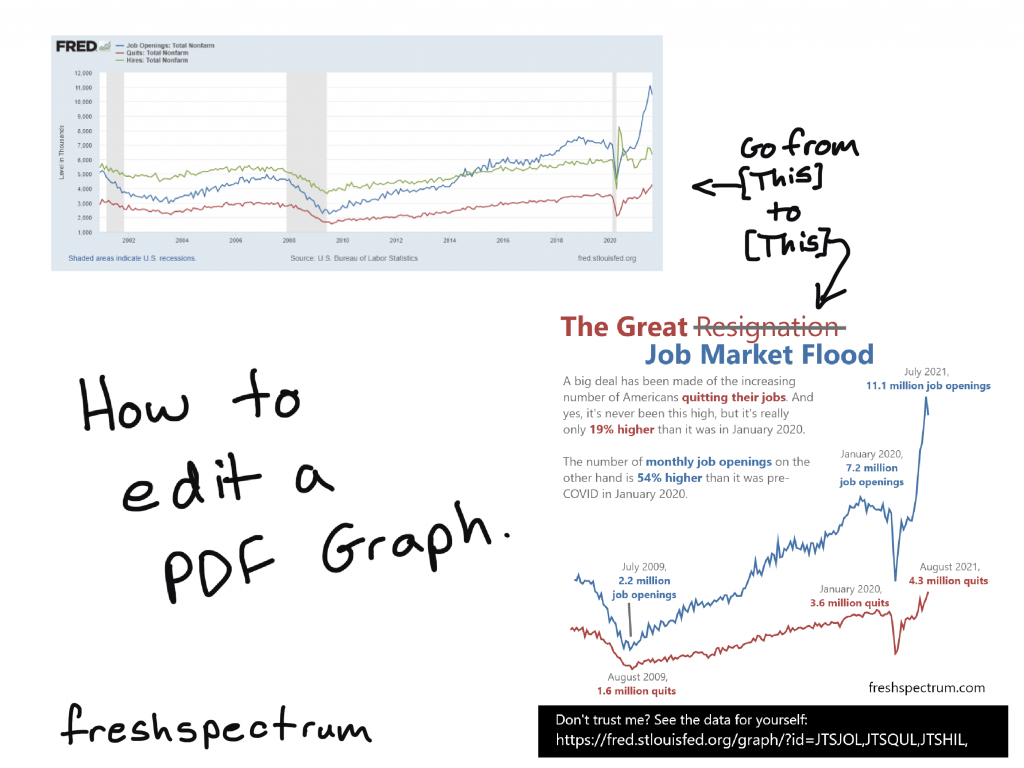
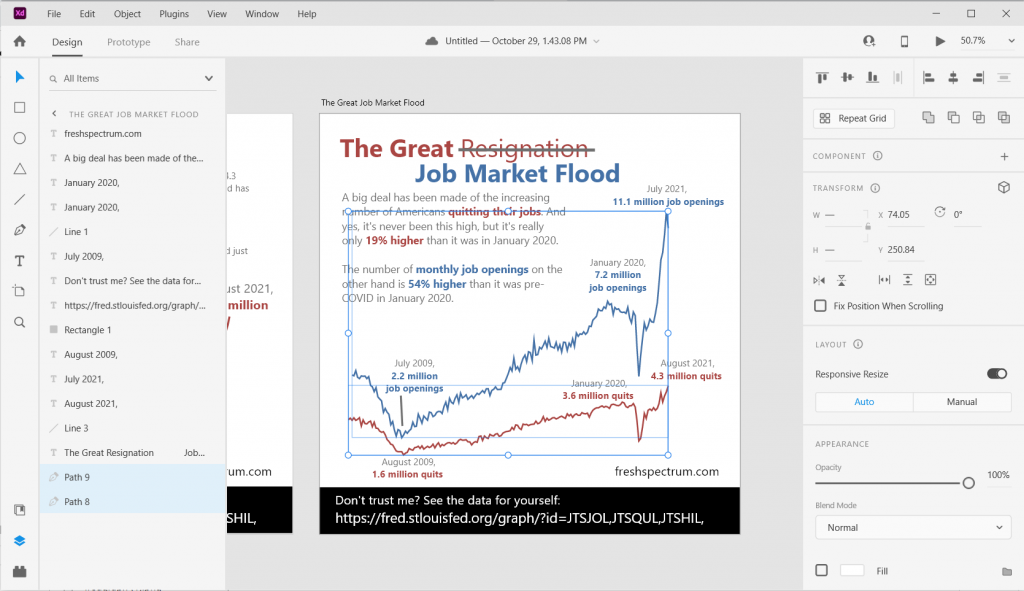
 

Data visualizations 

Data visualizations, such as charts and infographics, do not inherently provide actionable insights. However, they can provide additional support for the key findings of an analysis. Effective data visualizations can highlight key messages within the data and help identify areas for action. 

Take this result: 80% of patients were satisfied with their last visit.  

On its own, we only have one piece of the story. Did the remaining 20% of patient feel neutral about their last visit? Or were they very dissatisfied? For this example, providing a chart with the statement can provide additional context. Knowing that 20% of patients were dissatisfied with their last visit is likely to spur more action than if the patients had neutral feelings about their last visit. 


Benchmarks 

Further insights may be gleaned from benchmarks. These may be internal (e.g., comparing between time points) or external (e.g., comparing to standard norm). Using benchmarks can get at the “so what?” and provide valuable context to the results of an analysis. 

Looking at the previous example, exploring the results over time could provide additional context. For example, if 100% of patients were satisfied with their last visit in 2020 and 80% of patients were satisfied with their last visit in 2021, we can immediately identify a decrease in patient satisfaction. However, if 60% of patients were satisfied with their last visit in 2020, we would likely see a different response from the client. Providing results with the additional context of a benchmark has the potential to turn information into an actionable insight. 


Additional context 

As evaluators, it is not necessarily within the scope of our role to expand beyond what is provided in the data. Sometimes the data do not fully lend themselves to actionable insights. These cases require additional context beyond the data.  

At this point, it is time to hand the results off to your client. Your client will have a better understanding of internal operations, processes, or biases within their organization. Their expertise can provide additional context not apparent from the data alone and the client can come up with their own conclusions based on the results. 


The roadmap for transforming data into actionable insights starts and ends with asking the right evaluation questions. These questions guide the entire analysis process, moving data to information and information to actionable insight. The goal is derive meaning from data and answer the “so what?” questions to help organizations target areas for action.


Sign up for our newsletter

We’ll let you know about our new content, and curate the best new evaluation resources from around the web!


We respect your privacy.

Thank you!


Sources:

How to Write Good Evaluation Questions 

Evaluation Question Examples 

How to Conduct Interviews 

Scope Creep: When to Indulge It, and When to Avoid It  

Dial Down Your Data 

7 Tips for Better Data Visualizations 

How (and Whether) to Write Recommendations

What Is Data Quality and Why Is It Important?  


Written by cplysy · Categorized: evalacademy

Nov 05 2021

How (and whether) to write recommendations


Want to hear my elevator speech about what an evaluator does? It goes something like this: 

“What do you do?” 

“I’m an evaluator.” 

“What’s that?” 

“When an organization runs a program or initiative and they want to know how well they did, they hire an evaluator to help them measure and report back.” 

“Cool, so you tell them how to do better?” 

“Uhh…sometimes.” 

See how it kind of falls apart at the end there? It’s not that I don’t know my own work, it’s that the scope of the evaluator role has been bouncing around in my brain for a while now. Do we tell programs how to improve? Or do we simply share the data with them and let them draw their own conclusions? 


Does an evaluator make recommendations?

I had a mentor for the first few years of my evaluation career. He had an answer to this: “No.”  He firmly believed that an evaluator’s role is to stay neutral, design data collection strategies, implement them, analyze them and report back in a utilization-focused way.  

Michael Quinn Patton would argue there are definitely situations where an evaluator should be anything but neutral, like in evaluating complex innovations where evaluation feeds into design, but that’s not really what I’m driving at here. So, in a traditional formative/summative evaluation, what is the scope of an evaluator’s role: should an evaluator make recommendations? 

Let’s argue both sides of this: 

Pro Recommendations: 

  • Clients look for recommendations, it is expected 

  • Recommendations are the “now what” to reporting results.  

  • You’ve gathered and analyzed data, you’ve interpreted the data (the “so what”), so recommendations are the next logical progression 

Con Recommendations: 

  • The evaluator is not the expert  

  • Imagine recommending that a program change approach (think harm reduction vs. abstinence, or patient-centred care vs. physician-directed care), undermining the expertise and approach being tested 

  • The evaluator does not know the entire context  

  • Imagine recommending that an organization hire a Communications Advisor to help in getting their message out and build awareness, only to learn that their funding has recently been cut in half 

So where does that leave us?

One option is to side-step the issue: hearing my mentor’s voice in my head, I have written reports that stop just shy of “recommendations” but definitely include “Key Lessons Learned.”

So, I might say: 

“Training attendance was better on weekday mornings.”  

Rather than saying: 

“Recommendation #1. Run training sessions on weekday mornings.” 

ARE WE splitting hairs? Is there an actual difference here? 

Part of the difference is in human psychology. Not only do people generally not like being told what to do, but change management literature says that people will engage in change more readily if they come up with the idea themselves. So, if you say, “Training was better in the morning” and the project lead says, “Hey, we should run all sessions in the morning” – they get the credit, and the change is more likely to happen and be sustained. 

Another option might be to use softer language, so instead of: 

“Recommendation #1. Run training sessions on weekday mornings.” 

I might try to soften the language: 

“Consider alternative delivery dates and times. Review methods for optimizing the schedule of delivery based on participant needs and trainer capacity.” 

Again, this feels a little like cheating. And it’s not answering the questions about should an evaluator make recommendations. I think it’s because ultimately it depends on the relationship between the evaluator and the client, the strength of the evidence, the level of knowledge of the evaluator, and the integration of the evaluator within the operations.  

Michael Scrivens tells us that “lessons learned—of whatever type—should be sought diligently, expressed cautiously, and applied even more cautiously.” Scrivens suggested that “micro recommendations” which offer commentary or suggestions about implementation or operational details may be very appropriate within a formative evaluation while macro-recommendations – think “adopt, adapt or abandon”  –  are not necessarily the role of the evaluation and should not be made unless the evaluator has extensive knowledge and knows the context well.  

Micro and macro recommendations describe two types of recommendations, but there are others. Not all recommendations are created equal. Recommending that the coffee vendor at the conference be swapped for better quality coffee is not really the same as recommending that a program close down due to poor outcomes. Yet another type of recommendation (to avoid) is the less-than-helpful “More research is needed,” which can be valid but probably isn’t what your client is looking for.   

So, if your client wants recommendations, or perhaps your role as the evaluator is integrated and knowledgeable enough to warrant recommendations, consider the Following….recommendations (see what I did there?):


Drafting Recommendations

1. Plan early! 

  • When you are scoping an evaluation with your clients ask, “Are you seeking recommendations?” Knowing their expectations can frame the purpose of the evaluation and prepare you to deliver a product that meets their needs. 

  • When you are working with your client to develop the key evaluation questions to frame your evaluation plan, ask your stakeholders “What would you do differently if the outcome is A? What if it was B?” 

2. Engage stakeholders in coming up with recommendations

  • Share results early and often with your key stakeholders. Conduct a sense-making session to review the findings and gather their insights on what actions may be feasible as a result of lessons learned. This is sort of the best of both worlds, technically your report will include recommendations but also technically they didn’t just emerge from your brain! 

3. Validate draft recommendations

  • Are they actionable? Feasible? Under the control of the stakeholders? 

  • Consider conducting a brief literature review, or comparing to an existing review. 

4. Make sure they are justifiable

  • Link your recommendations directly and clearly to the data that drives it. 

  • If possible, seek out multiple data sources that align around the same path forward. This includes perspectives from multiple stakeholders at multiple levels. Think about who is the decision-maker and who would be responsible for implementation. 


Presenting Recommendations

1. Don’t bury them in the narrative of a report! 

  • Think about where to include your recommendation in the final report. Some writers like to showcase them upfront as a quick highlight or summary of the report. Some people like to save them for the end after the results have been presented in full. Other people will embed recommendations throughout the report, often below the data that informed them. In any case, ensure they stand out clearly as recommendations and not hard-to-find, half-hearted suggestions. 

2. Consider if there is a way to group recommendations by urgency, by ease, by impact, or by content theme

3. Though ideally you’ll have engaged stakeholders in crafting the recommendations, it’s always good practice to facilitate a discussion afterward as well

  • Help the team to do some visioning around what would happen if the recommendation was actioned. Is there evidence you can share? Are there indicators you can offer to help the client measure the impact? 

4. Be concise

  • Be clear, but not directive.  

  • Try to limit your recommendations to those that are most valid and actionable. 

  • Avoid lumping several recommendations into one. 


Other Considerations 

1. If possible, give options

  • Perhaps the data showed that mornings are better for training. One recommendation could be to run training in the morning, but alternatively, if you address the barrier about why training was better in the morning you may find an alternative recommendation is “Offer lunch vouchers and free parking to training sessions in the afternoon.” 

2. If you are an internal evaluator, try to build in time to follow up after your recommendations have been made 


Making poor recommendations can undermine your credibility as an evaluator, but conversely, strong, relevant recommendations are valuable and likely exactly what your client is looking for.  

If you’re looking for more tips on how to craft an amazing evaluation report, check out our 6-part series on Renovating Your Evaluation Report or how to deliver less-than-stellar results to your clients. 


Sign up for our newsletter

We’ll let you know about our new content, and curate the best new evaluation resources from around the web!


We respect your privacy.

Thank you!


Written by cplysy · Categorized: evalacademy

Nov 04 2021

Five Why’s

The Power of Why

Children learn a lot and quickly because they are curious. Children don’t stop asking questions, yet as adults we often do. The Five Why’s is a popular, simple, and powerful means to create that childhood sense of wonder and curiosity in your team. It is also a great means to do something called a root cause analysis.

The technique is said to have originated with Toyota, although the exact lineage is a little unclear. If you’ve spent any time around a 5-year old you know this technique by heart.

It starts out like this: Ask ‘Why?’ about something you encounter. Then repeat it for every answer you get up to or past five times.

The Five Why’s is a type of narrative interrogation that allows you to go deeper into understanding the motivations and actions of someone. The Five Why’s is a way for us to learn about what is behind a choice or decision so we can design better for it.

How to Use Five Why’s

The exchange below is based on a real-life example of using this technique. The context was part of a training activity for graduate students with the focus of inquiry on why students chose to pursue graduate studies in design. The program in question largely attracted mid-career professionals who were coming from a variety of different fields to study part-time while they completed their jobs.

Person 1: Question Asker (P1): Why did you choose to enrol in this graduate program?

Person 2: Question Answerer (P2): Because I generally have an interest in design and really wanted to do something that allowed me to be a little more creative.

Commentary (C) : This is the first exchange and focuses on the key question under consideration. Person 2 will respond with whatever they feel is appropriate and it is in this first response that Person 2 will find an aspect of the response that they want to focus on. The next ‘Why’ provides a chance for P1 to inquire about some aspect of this first answer to delve a little deeper.

Second Why

P1: Why is doing something creative important to you?

P2: I don’t have a lot of opportunity to do creative work in my job. I feel I just go through the motions with my job; it’s all very routine. I feel rather bored and unchallenged and I was hoping this program would help that.

C: In this exchange, Person 2 has introduced that creativity is an important part of their motivation to go back to school. The

Third Why

P1: Why do you want to be challenged in your work?

P3: I have a desire to accomplish something. I used to have dreams that I would make a difference in the world and do work that excited me and brought me joy. If I’m honest, I feel like I chose poorly with my career. I did what I was good at, not what I wanted to do.

C: We see here that this learner is addressing larger issues — much closer to the root cause.

Fourth Why

P1: Why was your choice a poor one?

P2: I kept pursuing what others expected of me. I do what others ask of me, not what I really want for myself. I saw this program and thought that this is something that’s important to me, not others.

C: What we see here is that the respondent is opening up about their reasons and connecting them to their career choices. Here, the questioner has many additional avenues to pursue

Fifth Why

P1: Why was it important to do what others wanted?

P2: I always felt I had to please people, especially my parents. They had a tough time and worked so hard to support our family. They were labourers — they didn’t see creativity as something that you could make a living at. I didn’t want to let them down. I felt perusing a creative career would do that and be seen as frivolous.

C: For this learner the choice to pursue graduate studies in design meant far more than a career change — it was a bold personal decision.

Practice Notes

It’s important to note that the pursuit of a root cause can yield some surprising results and that requires some caution. The above exchange got very personal quickly and this can yield some uncomfortable information for some participants. It’s important for facilitators to note that participants should only answer things that they feel comfortable with and should always have the right to pass on a cycle (e.g., do three Why’s instead of five).

Alternatively, there are times when responses do not get detailed and it may take more than 5 cycles to find something closer to a root.

With an understanding of those things that are closer to the root of a situation, the more options there are to design a program or service that meets more substantive needs. Using our example, the graduate program might seek to find ways to market its graduates in ways that can highlight the practical application of creativity. This would fit well with this students’ situation and more underlying motivations and needs.

The Five Why’s are simple to use and powerful in what they reveal. They can bring out your inner five-year old, too.

We can help you ask Why? What? How? and When? as part of our design process. Let us help you — contact us and we can help you implement this method in your work.

Photo by The 77 Human Needs System on Unsplash

The post Five Why’s appeared first on Cense.

Written by cplysy · Categorized: cameronnorman

Nov 03 2021

Ask Nicole: Using Social Work Skills as a Consultant

Have a question you’d like to be featured? Let me know. A few months ago, I mentioned that I’ll be limiting the content I create around starting and running a consulting practice. But I had a conversation with social work colleague recently that I couldn’t want to share! So, this month’s Ask Nicole is about […]

The post Ask Nicole: Using Social Work Skills as a Consultant appeared first on Nicole Clark Consulting.

Written by cplysy · Categorized: nicoleclark

Nov 02 2021

How to edit a PDF graph.

In this post I am going to show you how to edit a vector based PDF graph. You’ll also learn why you might need to so such a thing and how to discover if your PDF graph is indeed vector based.

In this post:

  • First, a little data backstory
  • How I turned this graph…
  • …into this infographic.
  • A PDF is a sometimes Vector.
  • How to Check if a PDF Graph is Vector (aka editable).
  • Editing the PDF Graph with Adobe Acrobat Pro.
  • Turning the PDF Graph into an Infographic with Adobe XD.
  • [Alternative for Non-Creative Cloud Subscribers] Editing the PDF Graph with Inkscape.
Title slide from blog post "How to edit a PDF Graph."

First, a little data backstory

Goodbye. Farewell. Adios. Sayonara. Workers have been giving their bosses an earful of such words as of late. Last week, the U.S. Bureau of Labor Statistics announced that 4.3 million Americans, or 2.9% of the entire workforce, quit their jobs in August. That was a record-breaking month, piggybacking on previous record months. “The Great Resignation” is real, and it can be seen across virtually all industries.

Why are so many Americans quitting their jobs? – NPR

It’s late October 2021 and I keep this story headline talking about the “The Great Resignation.” The stories mention 4.3 million Americans quitting their jobs in August, an all time high. When you click the link to follow the data, you find a news release and then a table without a ton of extra context.

This has been a weird time for economic data. COVID19 put a dent in any of the regular metrics making the pandemic stick out in a way that’s completely unavoidable. My curiosity led to a dive into the data. I found a new data source that gave wider picture based on the same datasets.

And the need to convert and edit a PDF chart brought me to this post.

How I turned this graph…

A chart from the Federal Reserve Economic Data showing Job openings, quits, and hires from 2000 to 2021.  Data can be found: https://fred.stlouisfed.org/graph/?id=JTSJOL,JTSQUL,JTSHIL,

If you look at this chart: the red line is quits, the blue line is job openings, and the green line is hires. It tells a little different story than what we see from “The Great Resignation.” The source of this chart is FRED (Short for Federal Reserve Economic Data). I wanted to clean it up a bit; add focus, put in annotations, and create a social media friendly infographic.

…into this infographic.

An infographic.
The great resignation is really a Job Market Flood. 
A big deal has been made of the increasing number of Americans quitting their jobs. And yes, it's never been this high, but it's really only 19% higher than it was in January 2020. 
The  number of monthly job openings on the other hand is 54% higher than it was pre-COVID in January 2020.
July 2009 - 2.2 million job openings
January 2020 - 7.2 million job openings
July 2021 - 11.1 million job openings

August 2009 - 1.6 million quits
January 2020 - 3.6 million quits
August 2021 - 4.3 million quits

To create this square infographic I didn’t have to recreate the line graph. I just used the one provided by FRED. At the top of the chart there was a “DOWNLOAD” button.

As a designer I would have loved to see “SVG” as one of the download options. The “Image (graph)” downloads a PNG file (which is not Vector and not so flexible to edit). The “PowerPoint (graph)” option downloads a PowerPoint file that includes a slide with the chart (but that chart is also not vector).

That leaves the “PDF (graph)” option, which did happen to be a vector file (woohoo)!

FRED graph screenshot showing download options.

A PDF is a sometimes vector.

So a PDF is a bit of a wildcard file type.

Sometimes with a PDF you’ll be able edit every single element (words, numbers, tables, charts, and colors). Other times it’s really just a static pixel based image file (more similar to a PNG or JPG). But that makes sense, because you can turn just about any picture or text file into a PDF.

As a designer looking to tweak a graph, when I pull open a PDF I really hope to find a vector format.

Freshspectrum cartoon by Chris Lysy. 
"I PDF all my charts because it keeps my boss from screwing up the colors and formatting."

How to Check if a PDF Graph is Vector (aka editable)

You can find out if a PDF is vector based pretty quickly. All you have to do is Zoom in on the file.

As you Zoom, if the image pixelates (turns into little squares) then your graph is not Vector based. Which basically means it’s easily editable. You’ll have to either recreate using the data, edit in an image editing tool (like photoshop), or recreate using some other approach.

Screenshot of a pixelated PDF graph.
Here is a PDF version where the chart is not a vector format.

If you can Zoom in and not lose any image quality, the image is Vector. This will give you a lot more options as a designer.

Screenshot of a clean zoomed in PDF Vector graph.
This a PDF version of the same chart but is definitely vector. The screenshot you see above is the pdf zoomed in 6400%. As you see, no drop in clarity.

Editing the PDF Graph with Adobe Acrobat Pro

Screenshot of a graph being edited in Acrobat Pro.

So if you have Adobe Acrobat Pro, you can do some basic editing. This includes editing words on the page, deleting certain formatting blocks, and even deleting or adjusting certain elements in a graph.

Keep in mind that PDF Vectors, especially auto-generated PDF vectors, are not always the cleanest files. There can be empty transparent blocks on top of your graph that you’ll need to delete to get to the chart elements underneath. You are also pretty limited in what you can do.

Editing the PDF Graph with Adobe Illustrator

Screenshot of a graph being edited in Adobe Illustrator.

If you have Adobe Creative Cloud, Adobe Illustrator is definitely the tool you will want to use to open up Vector PDFs. You’ll be able to see every single layer and element that makes up the image.

I’ll use Illustrator to open PDFs even when I plan to design my infographics using other tools. To identify an specific element just keep clicking on it until the specific layer is isolated. If you’re an accomplished user of Illustrator you can do all of your editing here.

Turning the PDF Graph into an Infographic with Adobe XD

Screenshot of a graph being edited in Adobe XD.

Over the last few years, Adobe XD has become my infographic design tool of choice. While you can drop SVG files right into Adobe XD, you can’t open a PDF. Even if it’s vector.

But what you can do is copy elements right from Adobe Illustrator and paste them into Adobe XD. That’s what I did here, copying the the two lines (each one is it’s own path) in Illustrator and pasting them into my XD file. Now I can do a lot with them, including changing colors and changing each line’s thickness.

[Alternative for Non-Creative Cloud Subscribers] Editing the PDF Graph with Inkscape

So I know there are a lot of you who do not have, and will likely never have, a subscription to Adobe Creative Cloud. That’s okay, you can still edit PDF graphs.

There is an open source vector drawing tool called Inkscape. And with Inkscape you can do a lot of the same things you could do in Illustrator (including opening up a PDF). Still want to use Adobe XD to create your infographic? That’s no problem, just save your file as an SVG. Then drop the SVG into Adobe XD.

Screenshot of a graph being exported from PDF to SVG using Inkscape.

Written by cplysy · Categorized: freshspectrum

  • « Go to Previous Page
  • Go to page 1
  • Interim pages omitted …
  • Go to page 154
  • Go to page 155
  • Go to page 156
  • Go to page 157
  • Go to page 158
  • Interim pages omitted …
  • Go to page 304
  • Go to Next Page »

Footer

Follow our Work

The easiest way to stay connected to our work is to join our newsletter. You’ll get updates on projects, learn about new events, and hear stories from those evaluators whom the field continues to actively exclude and erase.

Get Updates

Want to take further action or join a pod? Click here to learn more.

Copyright © 2026 · The May 13 Group · Log in

en English
af Afrikaanssq Shqipam አማርኛar العربيةhy Հայերենaz Azərbaycan dilieu Euskarabe Беларуская моваbn বাংলাbs Bosanskibg Българскиca Catalàceb Cebuanony Chichewazh-CN 简体中文zh-TW 繁體中文co Corsuhr Hrvatskics Čeština‎da Dansknl Nederlandsen Englisheo Esperantoet Eestitl Filipinofi Suomifr Françaisfy Fryskgl Galegoka ქართულიde Deutschel Ελληνικάgu ગુજરાતીht Kreyol ayisyenha Harshen Hausahaw Ōlelo Hawaiʻiiw עִבְרִיתhi हिन्दीhmn Hmonghu Magyaris Íslenskaig Igboid Bahasa Indonesiaga Gaeilgeit Italianoja 日本語jw Basa Jawakn ಕನ್ನಡkk Қазақ тіліkm ភាសាខ្មែរko 한국어ku كوردی‎ky Кыргызчаlo ພາສາລາວla Latinlv Latviešu valodalt Lietuvių kalbalb Lëtzebuergeschmk Македонски јазикmg Malagasyms Bahasa Melayuml മലയാളംmt Maltesemi Te Reo Māorimr मराठीmn Монголmy ဗမာစာne नेपालीno Norsk bokmålps پښتوfa فارسیpl Polskipt Portuguêspa ਪੰਜਾਬੀro Românăru Русскийsm Samoangd Gàidhligsr Српски језикst Sesothosn Shonasd سنڌيsi සිංහලsk Slovenčinasl Slovenščinaso Afsoomaalies Españolsu Basa Sundasw Kiswahilisv Svenskatg Тоҷикӣta தமிழ்te తెలుగుth ไทยtr Türkçeuk Українськаur اردوuz O‘zbekchavi Tiếng Việtcy Cymraegxh isiXhosayi יידישyo Yorùbázu Zulu