• Skip to main content
  • Skip to footer
  • Home

The May 13 Group

the next day for evaluation

  • Get Involved
  • Our Work
  • About Us
You are here: Home / Archives for cplysy

cplysy

Dec 04 2020

How to develop a data visualization color palette.

In this post I am going to walk you through the process of creating your own data visualization color palette.

  • Why you should have a color palette before you chart
  • Picking your first color
  • Picking Color Number 2
  • Picking Colors 3, 4, 5, and 6
  • Developing a color palette guide
  • Accessibility Checks

Why you should have a color palette before you chart.

A lot of the researchers and evaluators I know don’t think a lot about color when they go to create charts. And as a result, they end up creating reports with a diverse mix of colors reminiscent of late 80s/early 90s fashion.

This happens even when the data person works for an organization that has a defined style guide. Of course that style guide might be limited and is not always helpful when it comes to data visualization.

Having some pre-defined colors in hand when creating charts can help you stay consistent. Design consistency keeps artificial aesthetic differences from appearing significant in some way. It also takes away a step (saving your brain power) the next time you need to write a report on a deadline.

Picking your first color.

I like to start with one color, then build out from that color. It helps keep things from getting too overwhelming.

If you already work for an organization, that first color might be decided for you. Often the primary action color sits within an organization’s logo that you’ll find on their website.

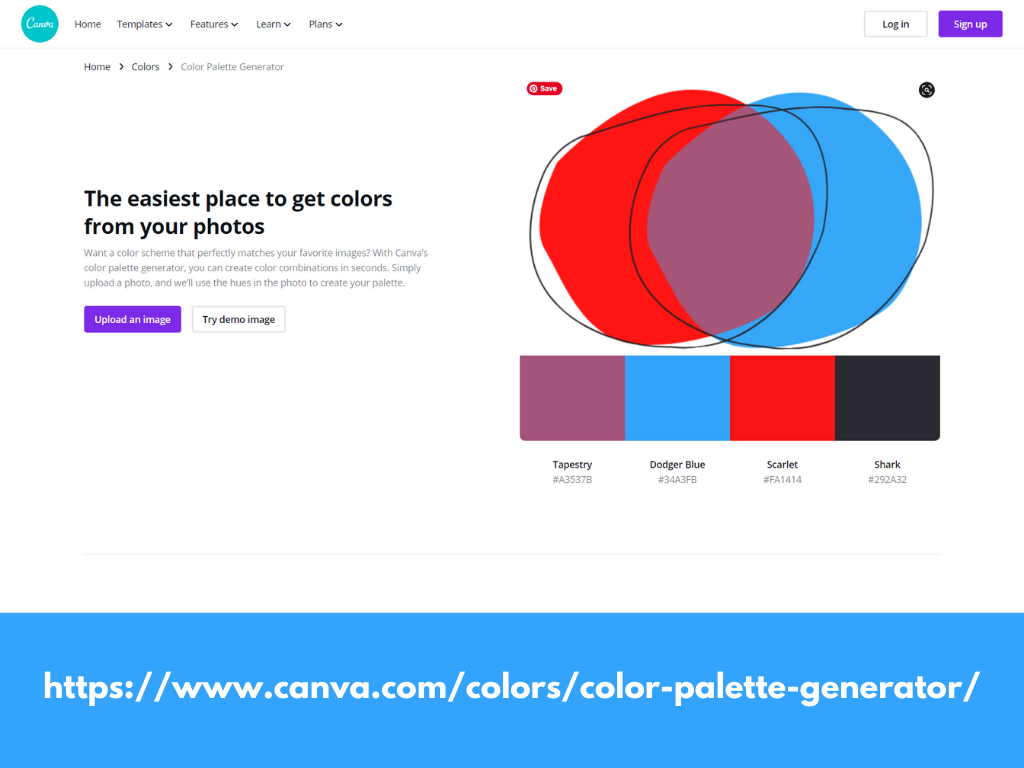
Don’t know what that color is? Canva has a nice free tool that generates a basic palette from a picture. So if you downloaded a logo (or even if you just have picture you find inspires you) you can upload it to the generator and see the colors within.

In my case I am going to start with the blue color from my logo, which Canva calls Dodger Blue. You’ll see the hex code (6 digit alpha-numeric) underneath.

Picking Color Number 2

In a lot of charting it’s good to have at least two main colors.

I highly advocate for choosing the second color based on what is sitting on the other side of the color wheel. In other words, the complementary color.

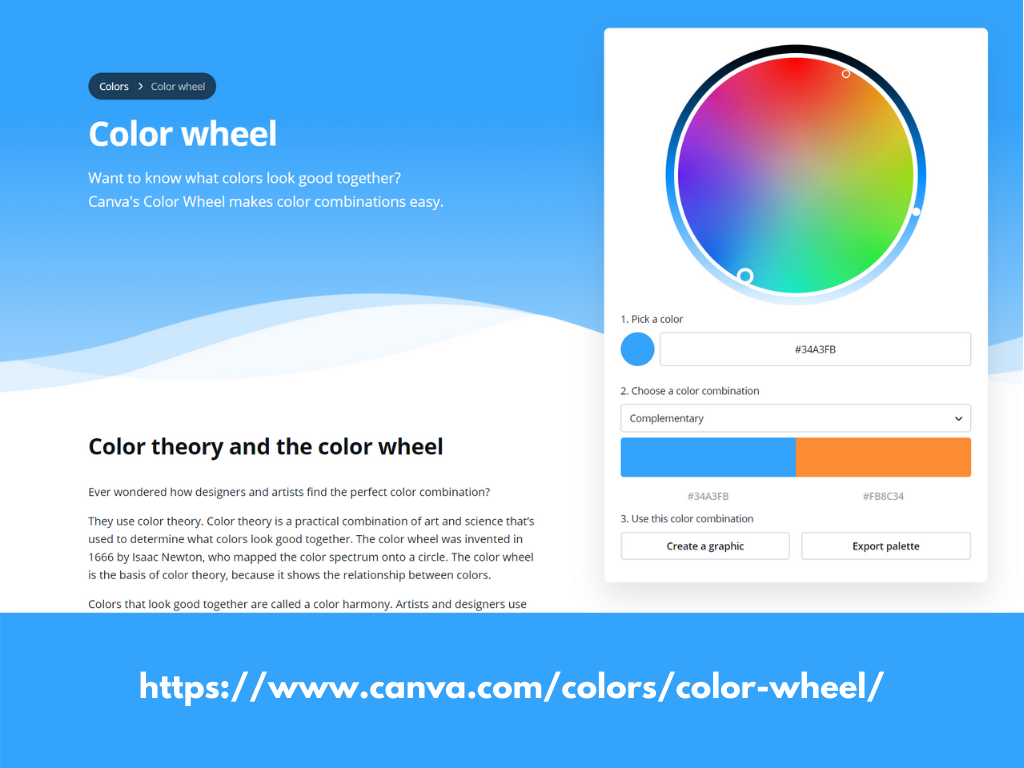
Canva also has a color wheel tool that let’s us see that color.

Just stick in the hex code from your first color into the “Pick a color” space. Then look at the color in the “complementary space.” So for my blue, the complementary color would be an orange.

Picking Colors 3, 4, 5, and 6

Here is the thing about charting. You almost always need several colors. But rainbow coloring your report is not going to help anyone.

Instead I like to draw my next 4 colors using monochromatic versions of my first 2.

Again, with just the hex code in the primary color spot, choose “Monochromatic” in the next space. The Canva color wheel will just repeat the one color and give you another shade of that color on the right.

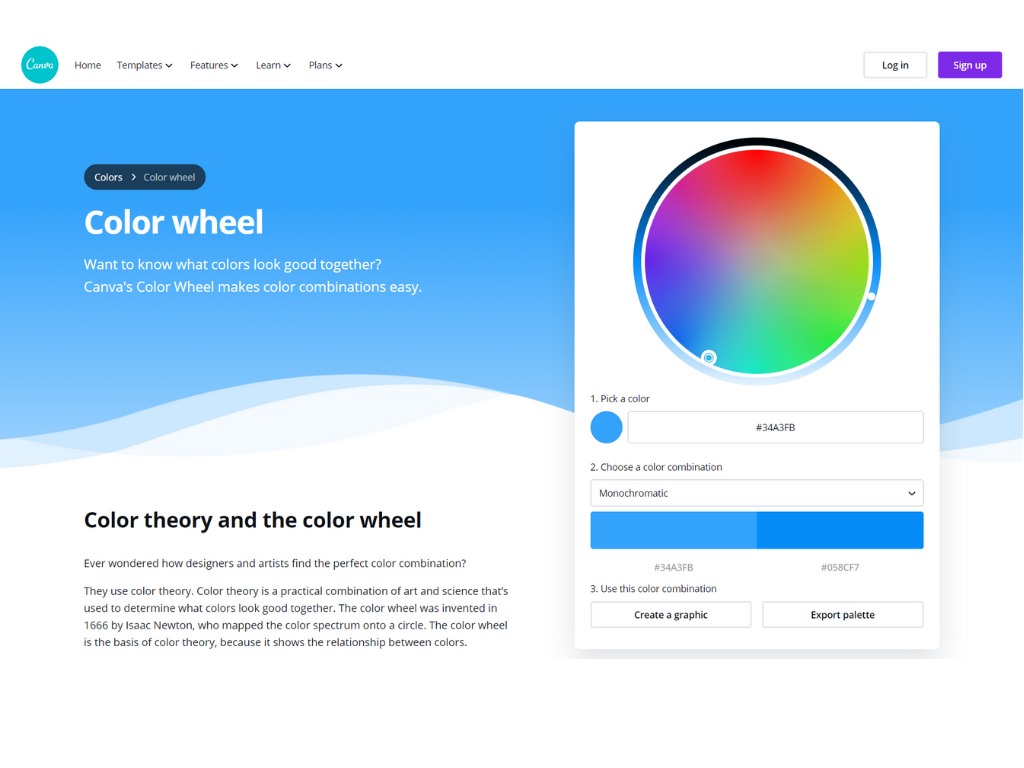
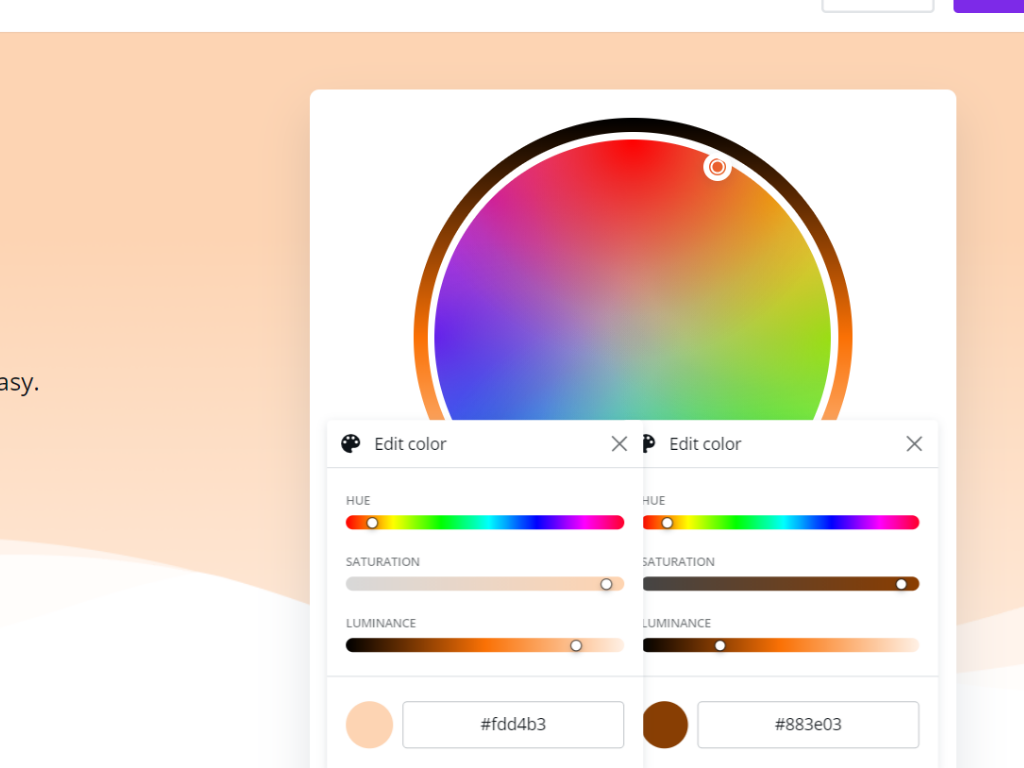
Personally, I don’t think this is different enough to use for most charts. So instead I click on each individual tile it gives me and select “Edit color.” This will give you some sliding scales.

I want to keep the change monochromatic, so the only thing I’m going to move is the luminance. On one I am going to take the base color and make it really light. On the other I’m going to go really dark.

So in my case, I will end up doing this two times for the blue and two times for the orange. This will give me 6 total colors (2 complimentary, and then 2 shade options for each color).

Once you figure out the colors, remember to write down the Hex codes.

Developing a color palette guide.

Having a whole bunch of handwritten hex codes is probably not super helpful.

So let’s turn it into a basic color guide using Canva’s regular design tools. I’ll start by creating a blank “Presentation (4:3).” This will be easy to print, share as an image, download to pdf, or even download to Power Point.

Once I create the presentation I just drop in a simple square element.

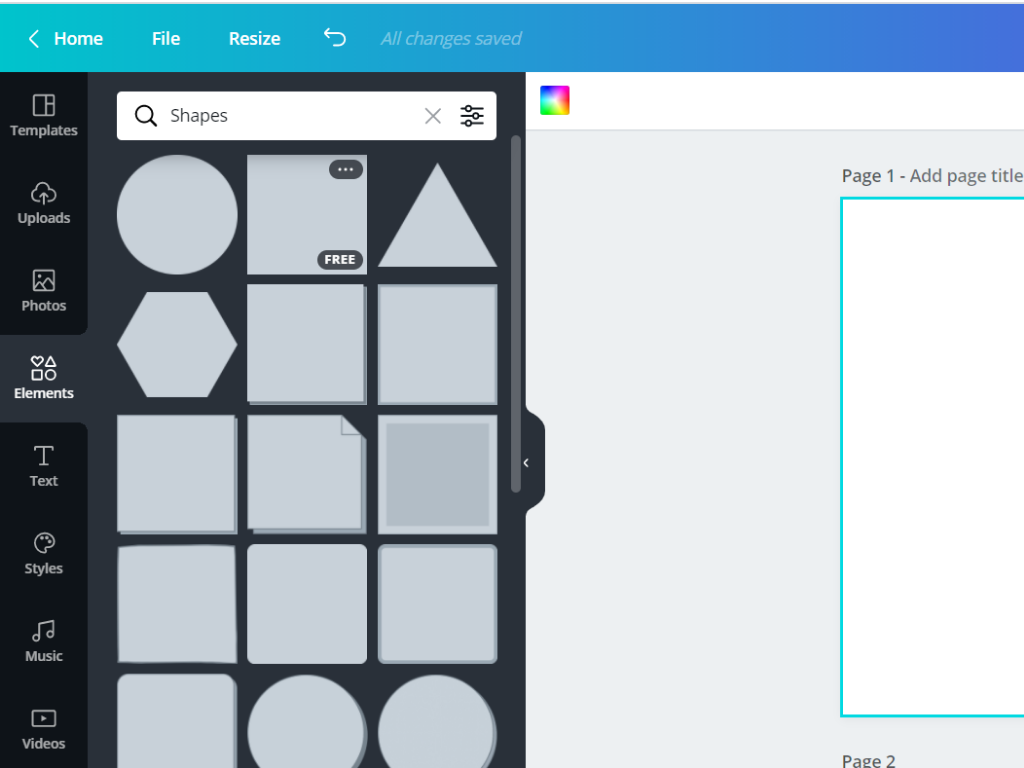
Then I’ll drop in more squares until I have a pattern that has two big blocks in focus (two blocks to the side of each) and then six blocks underneath.

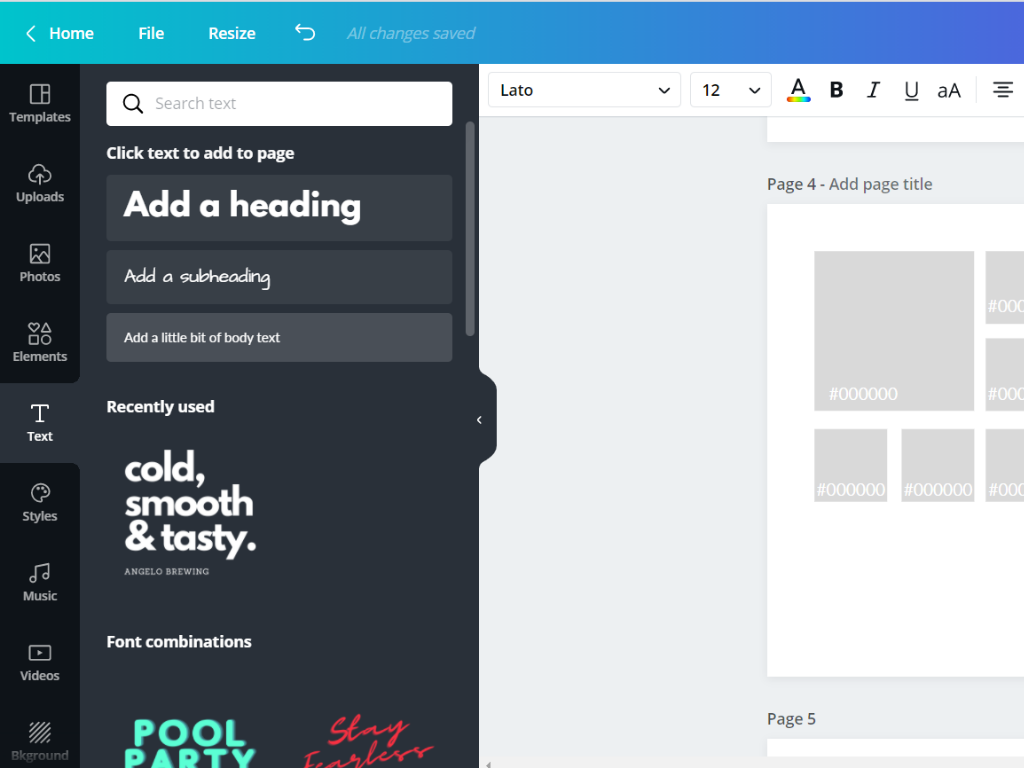
I’m going to want to put the hex codes into the design, so I also go ahead and add some body text in white to each of the blocks.

Now comes the easy part. You just click on the first square, then the color up top, and search for your hex code. You’ll also want to paste the code into your label.

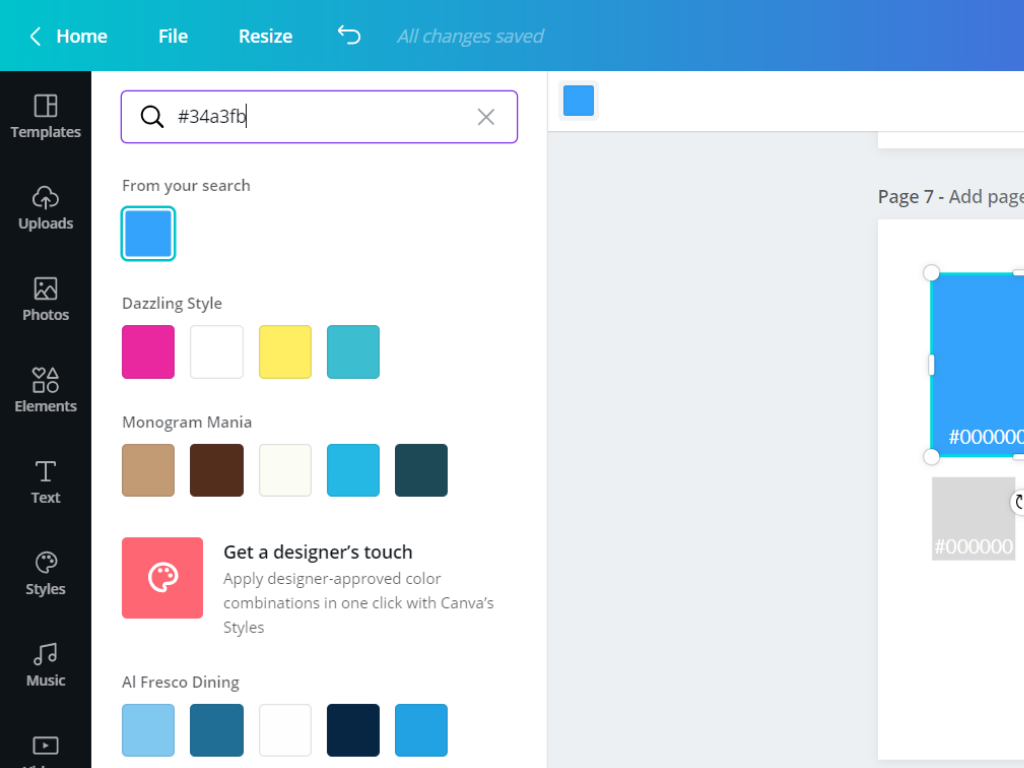
Now just keep repeating the process for your 6 colors.

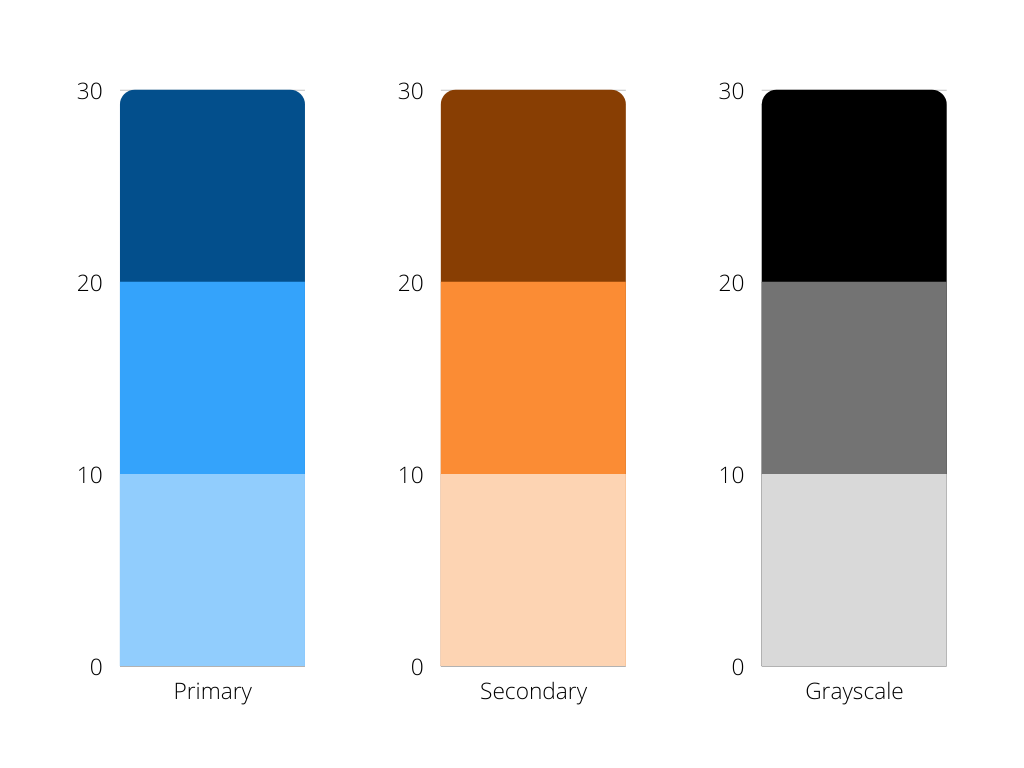
To round things out I also like adding a simple 6 color gray scale from Black to White. That’s why I put the six blocks on the bottom.

All told, we will have two complimentary colors, 2 additional shade varieties for each, and then 6 grayscale blocks.

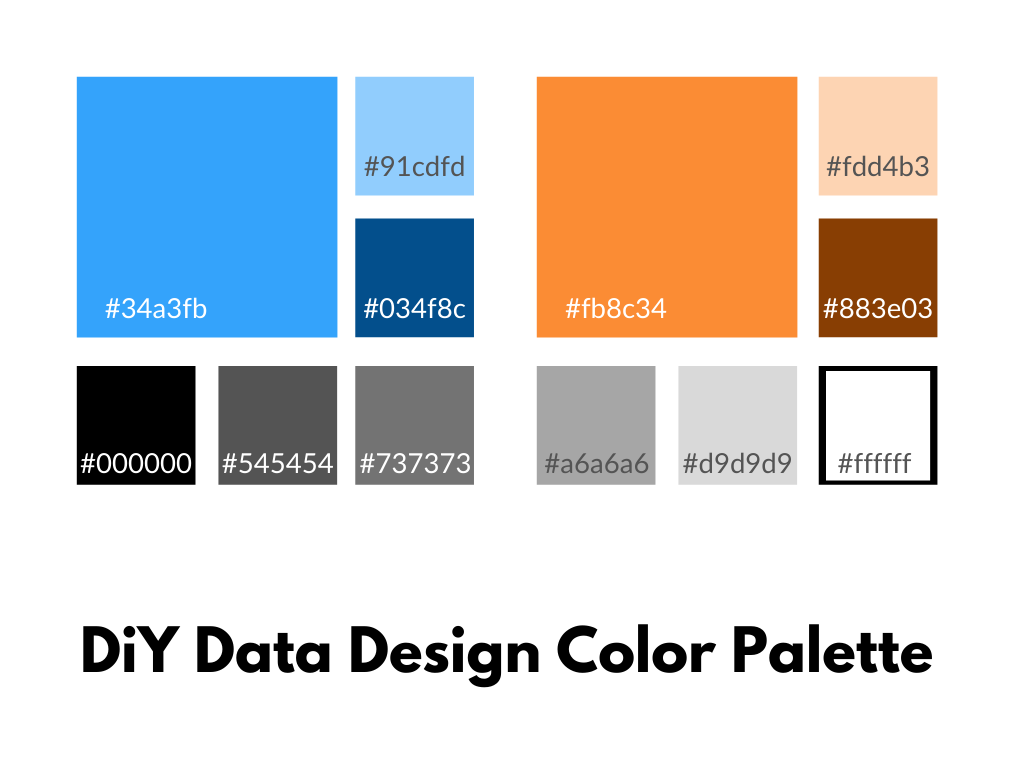
This color collection will give you a lot of variety when it’s time to create your charts.

You’ll want to go ahead and download your color guide. I like to download it as a simple PNG.

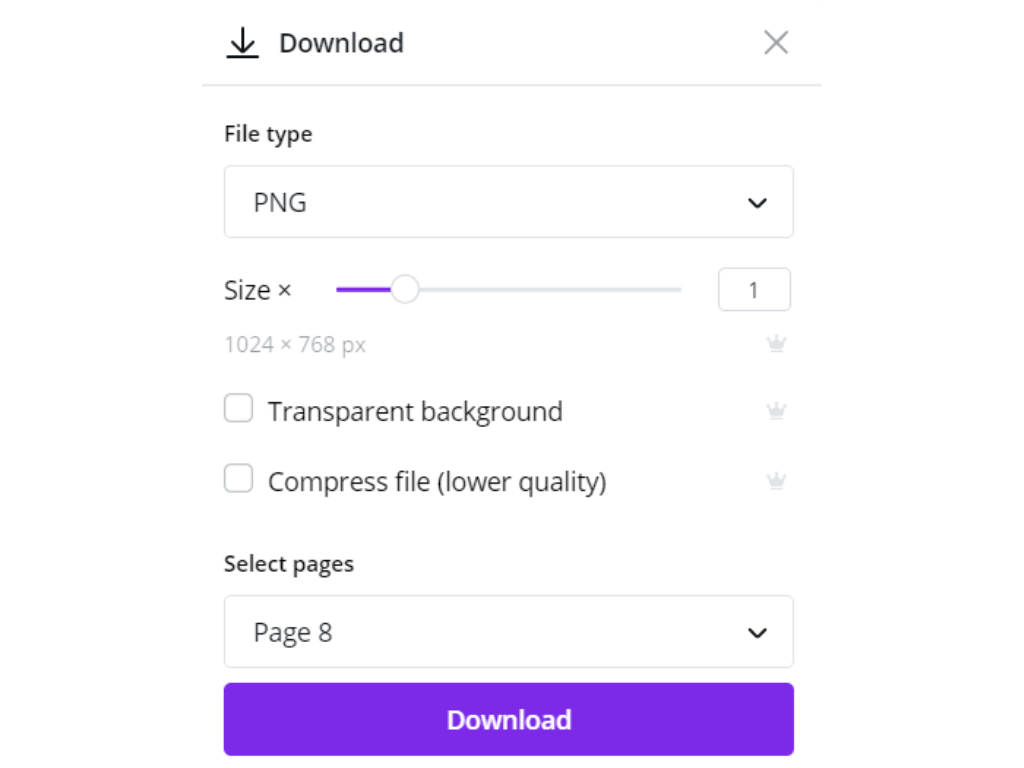
Canva has also added support for downloads directly into Power Point. Which is perfect for pretty much everyone who spends most of their time in Excel, Word, and PowerPoint.

Accessibility Checks

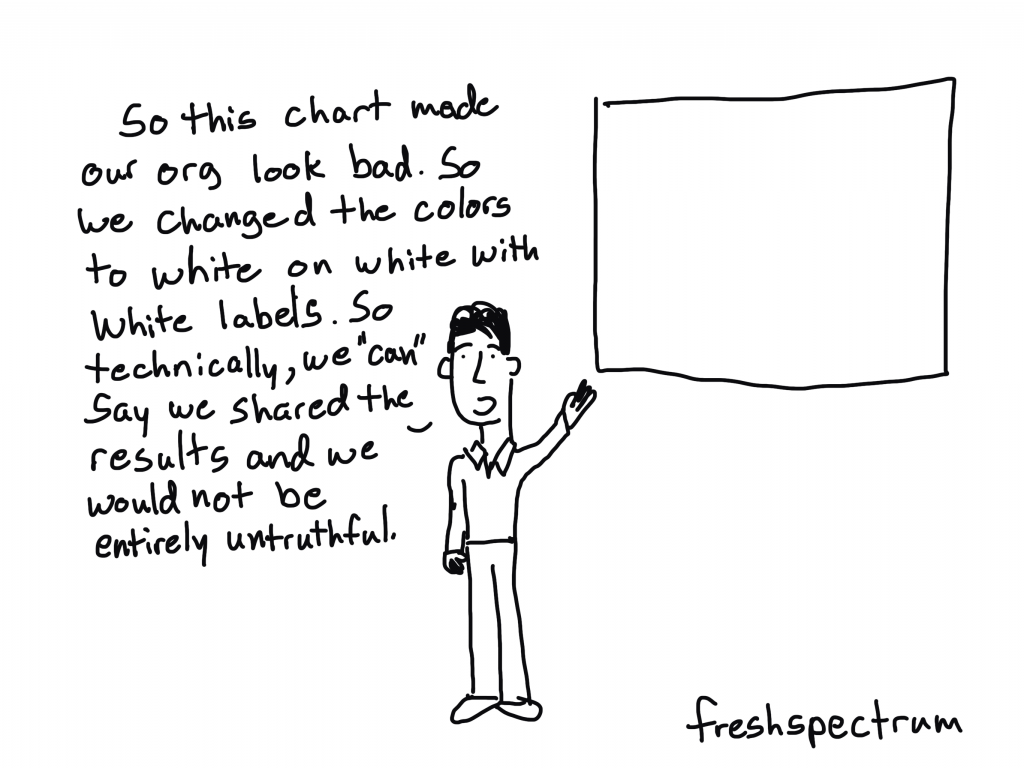
When using color in charts and visualizations it’s good practice to not only use color. Meaning, color should not be the only thing that differentiates different categories.

But we should also check our colors for issues in differentiation due to common color blindness. Here is one color blindness simulator you can use to upload your color guide and check it out.

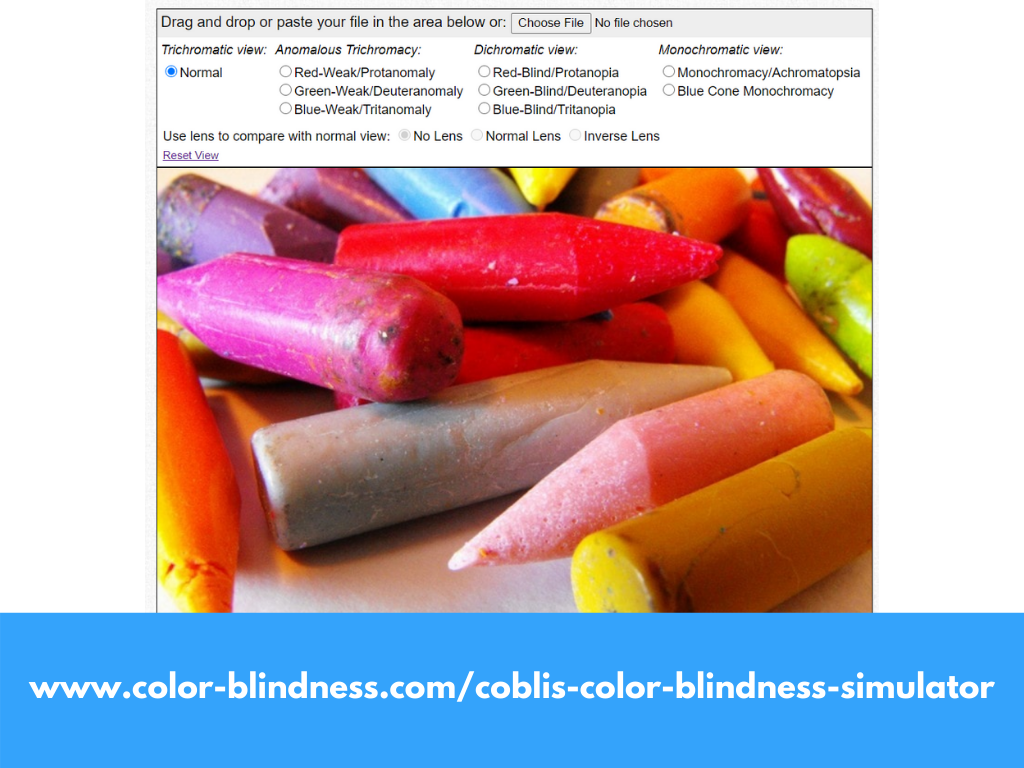
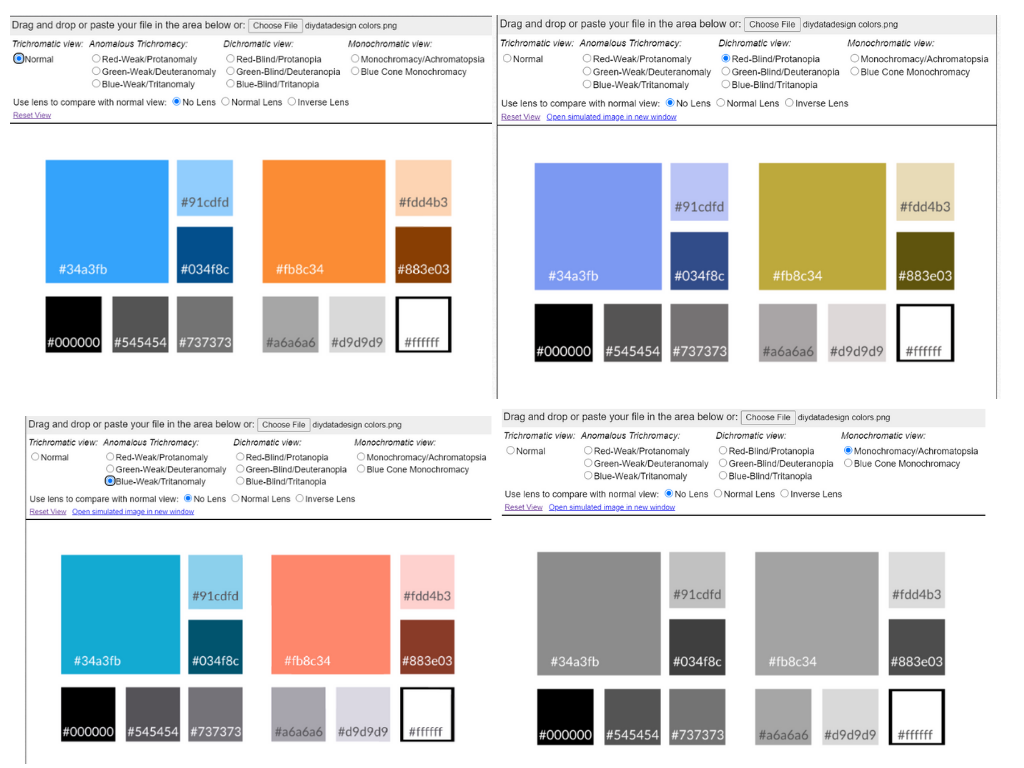
As you can see, my colors do not fair too poorly. The important piece here is having the ability to differentiate.

One additional thing to note is that as different as two colors look it’s the shade that matters when an image gets printed in black and white. If you know your charts will be printed in black and white it’s a good idea to vary not only colors but shades.

Written by cplysy · Categorized: freshspectrum

Dec 03 2020

Webinar Notes: Ethical Storytelling

Panelists: Amy Costello & Frederica Boswell

Hosted by: Nonprofit Quarterly

  • Tiny Spark podcast
  • Sophie Otiende, Activist and Advocate, HAART Kenya:
    • non-profits “parade and exploit” the people they are claiming to help
    • e.g., asking someone who has been assisted by an NPO to share their story – the organization holds power over the victim – can that survivor give proper consent about telling their stories?
    • “survivor porn” – why do we need a person to come and tell us that these horrible things are bad?
    • people don’t talk to survivors about the risks and impacts of telling your story. People live in an ideal world where they think that if they tell their story, people will be compassionate. But that’s not true – some people will abuse those who tell their stories, or we just forget about the person and move onto to getting the next survivor’s stories
  • we are interested in the whole person -not just their trauma
  • not everyone wants to be called “survivor” or “person who formerly experienced homelessness” or “recovering addict” – how does the person whose story is being told want to be represented?
  • the person whose story it is should be a full partner in the storytelling
    • ensure they are in the loop at all developments in the storytelling and being extra sure at every step that they are comfortable with any details that are shared
    • never want to surprise someone with details about their story being made public
  • don’t want to engage in trauma porn – just sharing the trauma in isolation
    • figure out what the message is – e.g., in a story on the Me Too movement in the charitable sector, the message was that serial predators are hiding in the charitable sector and their institutions are protecting them
    • figure out what the purpose of telling the story is – things like holding organizations to account or highlighting resilience
  • when conducting interviews, establish trust and intimacy
    • be fully present in the interview
    • ask follow up questions, based on really listening to them, rather than just following the interview guide in order
    • don’t drive the interview – the interviewee should have autonomy and control. The story is hers, not the interviewer’s
    • interviewer’s job is to help the interviewee feel safe
  • we should let people know what their rights are – that they can say “no” to answering our questions
  • interviewing “experts” (e.g., professors who study a topic)
    • isn’t someone who has years of experience living with homelessness an expert on the subject?
    • “professional” “experts” are often well rehearsed when you interview them – you have to push them to be real, rather than just being on auto-pilot
  • think about the stereotypes you may be perpetuating with your storytelling

Written by cplysy · Categorized: drbethsnow

Dec 03 2020

Webinar Notes: Beyond the Board Statement: How Can Boards Join the Movement for Racial Justice?

Sheila Matano, who is the VP of the board of the BC Chapter of the Canadian Evaluation Society (CESBC), who is also the chair of our Diversity, Equity, and Inclusion (DEI) committee, told me about this two-part webinar series. Like many boards, we are wanting to do better when it comes to doing our work in an inclusive way, and we didn’t want to just put out a board statement that says “Black Lives Matters” but then just go on operating the way that we always have. So I was excited to check out this series for some concrete ideas about how we can do this well. And I was not disappointed!

Panelists: Robin Stacia (RS) https://sageconsultingnetwork.com/meet-our-ceo/ and  Vernetta Walker (VW).

Hosted by: Nonprofit Quarterly

Part 1: Date: June 22, 2020

Watch part 1 here. Watch part 2 here.

Here are my notes from the webinars.

My takeaways:

  • board statements need to state a commitment to what you are going to do
  • it’s not about waiting out the uprising until you can go “back to business”
  • how can boards use their influence in a way that aligns with their mission?
  • the work needs to be done by the whole board – it’s not to be on the one Black person on your board to own this work. It can be retraumatizing for them. And Black people are tired from fighting for centuries – white people need to step up.
  • look at your board composition – we need a diverse board and a coalition of all of us

Understanding our history:

  • we are a post-colonial society – there was a narrative that “natives” were “savage” –> white supremacy –> allowed white people to enslave Black people
  • slavery did not end – it just evolved
  • there is still a presumption of danger re: Black and brown people
  • truth and reconcilitation/justice/reparation are sequential – the truth must come first
  • as boards, we need to tell the truth about what we’ve ignored, overlooked, and benefitted from

Debunking Myths

Myth: “It’s just a few bad actors”

  • RS: this myth “minimizes the centuries long struggled that Black, brown, indigenous people have experienced”
  • it is a system of racism:
    • restricts every aspect of life for Black, brown, and indigenous people (healthcare, criminal justice, politics, education, wealth – everything)
    • institutional policies/practices/laws/regulations designed to benefit and create advantages for white people and oppress and disadvantage Black, brown, and indigenous people
    • exists no matter your age, location, socioeconomic status
  • VW: we have a lot to unlearn
    • we’ve been socialized to not talk about race
    • boards should talk about why they are so uncomfortable to talk about race
    • boards should learn about unconscious bias
    • do you have authentic relationships with Black and brown people? Because we’ve been separated
    • COVID-19 and this uprising = perfect storm, because people had time to reflect and feel the pain
    • we can’t show up effectively for the board work if you haven’t done the individual work

Myth: People try to replace “Black Lives Matter” with “All Lives Matter”

  • VW: saying “Black Lives Matter” is not saying “only Black Lives Matter” – it’s saying “Black Lives Matter too”
  • there is violence against Black bodies, often by state actors
  • lots of people have heard that “race is a social construct”, but they don’t get it. They think there are differences between the races that justify the violence, but there are not.
  • “waking up Black” has a level of stress that is measurable – decreased life expectancy, gaps in educational acheivement, maternal mortality, criminal justice system involvement – bias and systemic racism leads to all of this
  • RS: people misunderstand “racial equity” – it means the state where my racial identity doesn’t have an impact on me -e.g., I can go to the bank or go birdwatching and my racial identity does not dictate the outcome

A board statement alone is not enough

  • When they polled the webinar audience, about 3/4 said that their board had issues a statement in the wake of the BLM protests, but only 1/4 said that their board had an indepth conversation about the issues
  • VM: some statements just say something to the effect of “we stand with you”, but nothing about what they will actually do
    • good statements will say what they are doing and what they commit to doing
    • there was a backlash if you didn’t put out a statement, and there was also a backlash if your statement didn’t have any teeth – it shows that people are paying attention
    • put putting out a statement for the sake of public perception is not good

Questions to ask when if and when you do speak out:

These are taken verbatim from their slide:

  1. How does your statement acknowledge the historical injustices of structural and systemic racism?
  2. How do you use the document to bring about awareness concerning systemic and structural racism to your audiences?
  3. How does the statement align with your organization’s mission?
  4. Is your organization willing to be an ally in supporting the work? If so, how?
  5. What is the call to action and committment to the work? Examples can include:
    1. How do you plan to alleviate barriers and create access to opportunities to bring about equitable and just outcomes?
    2. How do you plan to leverage the various forms of capital that are at your disposal to address the issues?

Source: Robert L. Dortch, Jr. Vice President, Programs & Innovation, Robins Foundation

As I look at these questions, I think that not only are they useful for our work on the CESBCY board, but they can also be helpful for me to think about how I do my teaching.

Resources

  • The Racial Equity Institute’s Groundwater Approach to explaining structural racism.
  • Equity in the Centre’s Awake to Woke to Work: Building a Race Equity Culture

Written by cplysy · Categorized: drbethsnow

Dec 03 2020

Comment on Can evaluators be the bridge in the research-practice gap? by Kari Reitz

Thank you for your post. This is one of the motivations I had for becoming an evaluator. I agree that we are in a unique position to bridge this, and may do so.

What specific activities can help bridge this divide? Standardized rubrics for measurement come to mind but curious if you have other examples?
How does bridging these communities fit into the process of evaluation and evaluator competencies?
What could incentivize those activities? How can researchers, programs, funders, or policy benefit?

I am very interested in your dissertation and hope these questions can help!

Written by cplysy · Categorized: danawanzer

Dec 01 2020

Data Placemats & Emergent Learning Tables

Data Placemats & Emergent Learning Tables: Tools to Meaningfully Engage Diverse Perspectives in Evaluation Sensemaking

Image created by Veena Pankaj, Innovation Network

In an earlier post that highlights Reflections on the Intersection of Evaluation and Emergent Learning, I shared insights generated through my application of Emergent Learning principles and tools to my work. Through this experience I came to realize that the true intersection between evaluation and emergent learning lies in the interpretation of data and its use for reflection and learning. Data interpretation is a key part of the evaluation life cycle. It’s the space where we start to make meaning of and draw conclusions about the data collected through the evaluation. Often, this data is an accounting of the experiences and observations of community members and other stakeholders who aren’t typically involved in the sensemaking conversation.

I believe that involving different stakeholders in the interpretation process, those most connected to the programs, initiatives, and systems we are evaluating, invites a diversity of perspectives that can strengthen insights and lead to new ways of moving forward.

This post focuses on using data placemats within the context of emergent learning, as a vehicle to meaningfully involve stakeholders in the sensemaking process (to learn more about data placemats, check out this article).

The Data Interpretation Meeting

As part of the multi-site health equity initiative that Innovation Network is evaluating, our evaluation team conducted approximately 60 interviews with participating community members. As we analyzed and reflected on the data, I realized that we were only capturing a part of the story…

To truly understand and leverage the data into meaningful action, we would need to involve those that are connected to the communities and the communities themselves in the sensemaking process.

While I often involve the client and relevant stakeholders in the interpretation of data, I usually do a fair amount of data interpretation in advance and feel pressure to come up with insightful findings and recommendations of my own. For this evaluation, I scheduled a full-day, in-person data interpretation meeting with foundation staff and members of the technical assistance/coaching team.

The purpose of this meeting was to use the emergent learning table as a means to share evaluation data, create space to add additional observations and experiences, and collaboratively engage in conversation to generate meaningful insights and new ideas for moving the work forward.

Through this conversation, I wanted to gather the experiences, interpretations, and reflections of the individuals that were working closely with the communities.

The Emergent Learning Table

4QP’s Emergent Learning Platform

The emergent learning table helps groups articulate their best collective thinking about what it will take to be successful by providing a platform to engage stakeholders in a process designed to 1) reflect on data, 2) generate insights, 3) establish hypotheses, and 4) move towards action. Through this platform, conversation is organized into four quadrants:

  • Quadrant 1: Ground Truth/Data (discussion of experiences and stories)
  • Quadrant 2: Insights (an opportunity to collaboratively reflect on the data to highlight patterns and generate insights)
  • Quadrant 3: · Hypotheses (an opportunity to generate new ideas for moving forward)
  • Quadrant 4: Moving to action (making a plan to test new hypotheses)

For more information on emergent learning tables, checkout Fourth Quadrant’s Guide to Emergent Learning Tables.

While I was initially apprehensive about using a new approach for the interpretation process, I was also excited about the possibilities it could create. Our team had lots of data to share and we would be engaging with a group of people that were truly involved and invested in the outcomes of this initiative. What better group of people to engage in this conversation!

Through interviews and surveys, our evaluation team collected a large amount of data. The interviews in particular yielded some great qualitative data.

How could we share this information in a way that could facilitate the sense-making process so participants can readily comprehend the data and surface insights?

Data Placemats

I often use data placemats as a way to organize the evaluation data into topic areas to help meeting participants understand and make sense of data.

The visual nature of the data placemat makes it easier for participants to digest information, enabling them to more readily engage in productive conversation around the data.

For this meeting, we used a combination of data placemats and an emergent learning table to facilitate the data interpretation meeting. We created a total of seven data placemats, each focusing on a specific thematic area that emerged from the evaluation team’s preliminary analysis:

Each placemat contained a combination of interview quotes organized around sub themes and supporting charts and graphs. The placemats were used as a vehicle to discuss data during the Quadrant 1 conversation.

Using data placemats to help participants understand and make sense of the data allowed us to facilitate a conversation that flowed from data to insights to hypotheses to action.

Adapted from 4QP’s Emergent Learning Platform

What did this make possible?

Moving to Action. Using the Emergent Learning Table as a platform for data interpretation made it possible for the group to go beyond insights to action. This is where evaluation often falls short. The collaborative nature of the conversation and involvement of multiple stakeholders helped increase buy-in to the hypotheses that were generated. This buy-in helps ensure hypotheses are followed through and tested.

Renewed sense of purpose. Going through the quadrants together gave folks in the room a renewed sense of purpose. While many of the insights generated involved issues associated with structural racism and the devastating impacts of white privilege, the group did not feel deflated. Rather, the group worked together to identify existing barriers and brainstorm new ways of moving forward. Coalescing around a common goal/framing question helped inspire a commitment to reflection and ongoing learning.

Creating space for transformation. All too often, grantees and community members experience evaluation as transactional and one-sided and are viewed primarily as subjects of data collection. For evaluation to be truly reflective of the of the experiences and learnings that are emerging from the ground, we must treat recipients of program services (e.g. grantees and community members) as learning partners not just as individuals called upon for data collection. Inviting the subjects of data collection to the sensemaking table as experts in their own lived experience along with other forms of knowledge and expertise, creates the possibility for transformation through collaborative conversation grounded in data and experience.

What did we learn?

Power of collaborative conversation. Inviting a diverse group to the table helped leverage the knowledge and experience of each person and added depth to the conversation. Each person that participated in the data interpretation meeting had their own experiences, observations, and insights to contribute. This was especially pronounced when different technical assistance providers reflected on their experiences working with their designated communities. By having multiple perspectives at the table, we could learn from each other’s experience and work together to identify emerging patterns in the data and the stories that were being shared.

Engaging a diversity of voices. The emergent learning table discussion involved foundation staff, community coaches, and technical assistance providers. The diversity of perspectives led to more meaningful conversation captured by the stories and experiences of those in the room and helped generate new hypotheses grounded in experience.

Moving forward, I would like to broaden the table by inviting community members into the sensemaking conversation to gather their perspectives on this work. By engaging a diversity of perspectives in these conversations, we will be able to leverage the experiences and knowledge of individuals across a broader cross-section of the community and work towards developing a more holistic understanding of what it takes to advance health equity in communities.

The emergent learning table demonstrated the power of incorporating real-time, collaborative reflection in the evaluation sense-making process. Data placemats offered a way to share data collected through the evaluation to help participants digest large amounts of information to meaningfully engage in collaborative sensemaking and idea generation.


Data Placemats & Emergent Learning Tables was originally published in InnovationNetwork on Medium, where people are continuing the conversation by highlighting and responding to this story.

Written by cplysy · Categorized: innovationnet

  • « Go to Previous Page
  • Go to page 1
  • Interim pages omitted …
  • Go to page 215
  • Go to page 216
  • Go to page 217
  • Go to page 218
  • Go to page 219
  • Interim pages omitted …
  • Go to page 304
  • Go to Next Page »

Footer

Follow our Work

The easiest way to stay connected to our work is to join our newsletter. You’ll get updates on projects, learn about new events, and hear stories from those evaluators whom the field continues to actively exclude and erase.

Get Updates

Want to take further action or join a pod? Click here to learn more.

Copyright © 2026 · The May 13 Group · Log in

en English
af Afrikaanssq Shqipam አማርኛar العربيةhy Հայերենaz Azərbaycan dilieu Euskarabe Беларуская моваbn বাংলাbs Bosanskibg Българскиca Catalàceb Cebuanony Chichewazh-CN 简体中文zh-TW 繁體中文co Corsuhr Hrvatskics Čeština‎da Dansknl Nederlandsen Englisheo Esperantoet Eestitl Filipinofi Suomifr Françaisfy Fryskgl Galegoka ქართულიde Deutschel Ελληνικάgu ગુજરાતીht Kreyol ayisyenha Harshen Hausahaw Ōlelo Hawaiʻiiw עִבְרִיתhi हिन्दीhmn Hmonghu Magyaris Íslenskaig Igboid Bahasa Indonesiaga Gaeilgeit Italianoja 日本語jw Basa Jawakn ಕನ್ನಡkk Қазақ тіліkm ភាសាខ្មែរko 한국어ku كوردی‎ky Кыргызчаlo ພາສາລາວla Latinlv Latviešu valodalt Lietuvių kalbalb Lëtzebuergeschmk Македонски јазикmg Malagasyms Bahasa Melayuml മലയാളംmt Maltesemi Te Reo Māorimr मराठीmn Монголmy ဗမာစာne नेपालीno Norsk bokmålps پښتوfa فارسیpl Polskipt Portuguêspa ਪੰਜਾਬੀro Românăru Русскийsm Samoangd Gàidhligsr Српски језикst Sesothosn Shonasd سنڌيsi සිංහලsk Slovenčinasl Slovenščinaso Afsoomaalies Españolsu Basa Sundasw Kiswahilisv Svenskatg Тоҷикӣta தமிழ்te తెలుగుth ไทยtr Türkçeuk Українськаur اردوuz O‘zbekchavi Tiếng Việtcy Cymraegxh isiXhosayi יידישyo Yorùbázu Zulu