• Skip to main content
  • Skip to footer
  • Home

The May 13 Group

the next day for evaluation

  • Get Involved
  • Our Work
  • About Us
You are here: Home / Archives for allblogs / cameronnorman

cameronnorman

Jan 22 2020

Visual Thinking

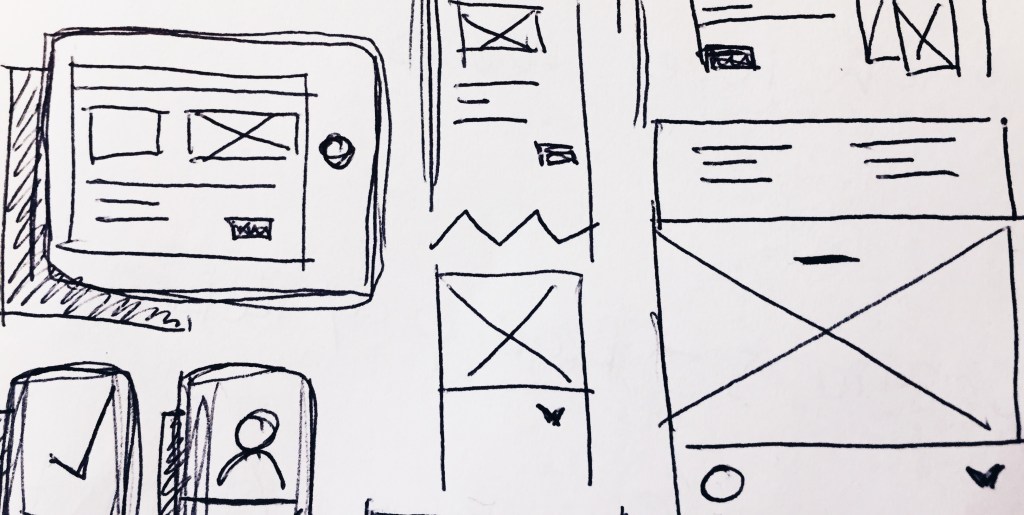
Service and product design involves creating something, envisioning it’s use, consideration of its effects, and hopefully seeing it achieve a goal. When we are creating or planning our project we need to consider all of that on top of the many ideas we have about what that product or service ought to involve. That is a lot to hold in our heads at one time.

This is why designers often rely on visual thinking and communication to help illustrate these ideas as systems. The benefits of this approach are many and include:

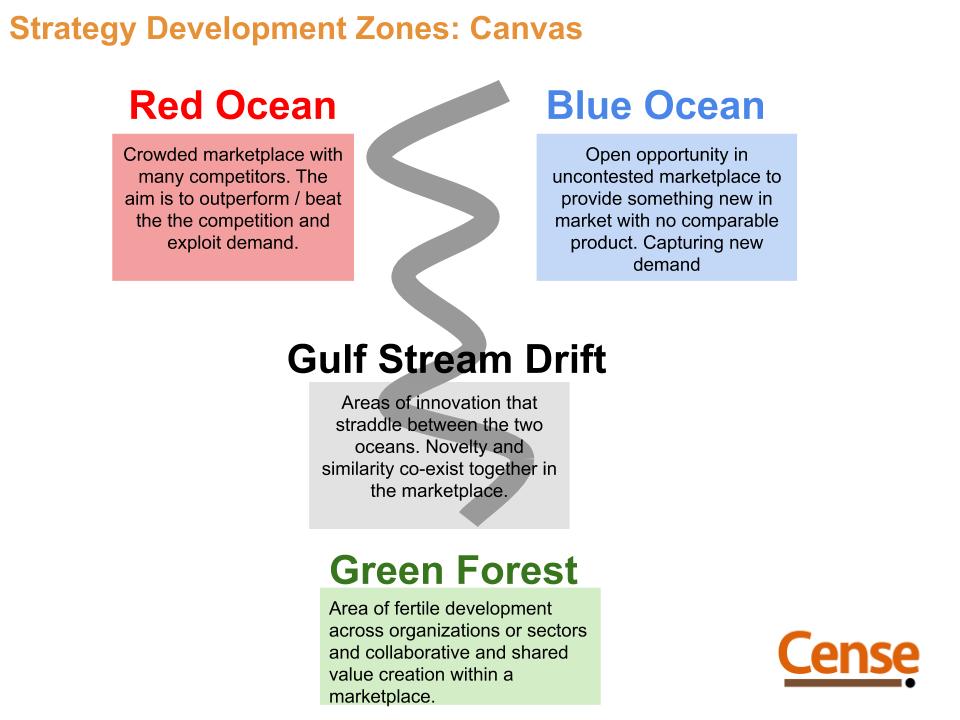
  • Providing a way to communicate your thoughts in multiple dimensions. Time, space, sequence, and effects are all different considerations for service design and visualizing that allows us to see these all in one space. Our language is linear, visualizing allows for linear and non-linear effects.
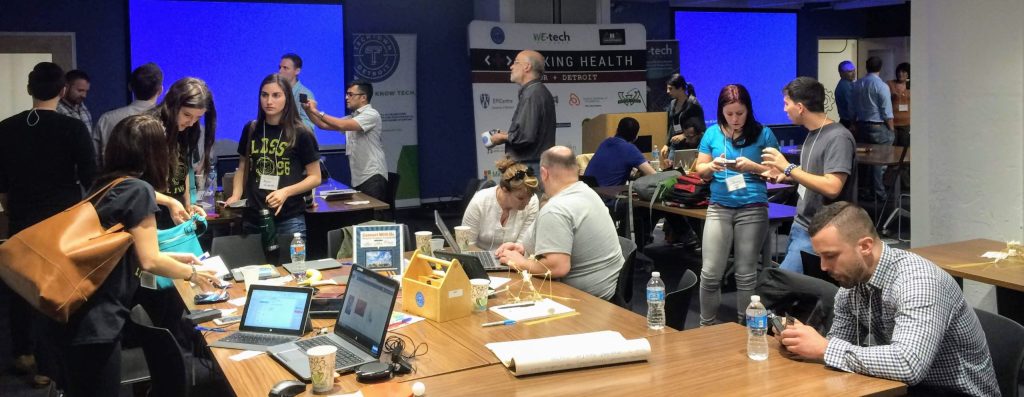
  • It creates a space for everyone to participate. Whether you are a skilled visual communicator or someone who hasn’t drawn anything by hand in 20 years, nearly everyone can draw. Visual thinking tools can provide a means to literally get people working on the same page. Simple methods like the Sketch Map are easy to employ and get everyone sharing ideas together.
  • Visual language – such as that illustrated by XPlane in their useful guide to visual thinking transcends spoken words and allows us to communicate even when our shared spoken language isn’t strong.
  • Visual thinking allows us to use metaphors, express complex emotions, and connect physical and emotional things together during a service journey in a way that is difficult to convey through oral or written language.
  • Visuals provide an artifact that can be interrogated, explored, and reviewed from many different perspectives allowing people to point to objects, relationships, and structures and ask about their purpose, illustration, and meaning without requiring much technical understanding of the problem-domain (allowing outside and alternative perspectives to meaningfully contribute).
  • It also provides a means to generate a shared understanding of the system boundaries, components, and purposes that guide your development of the service. It gets people on the same page metaphorically and literally.

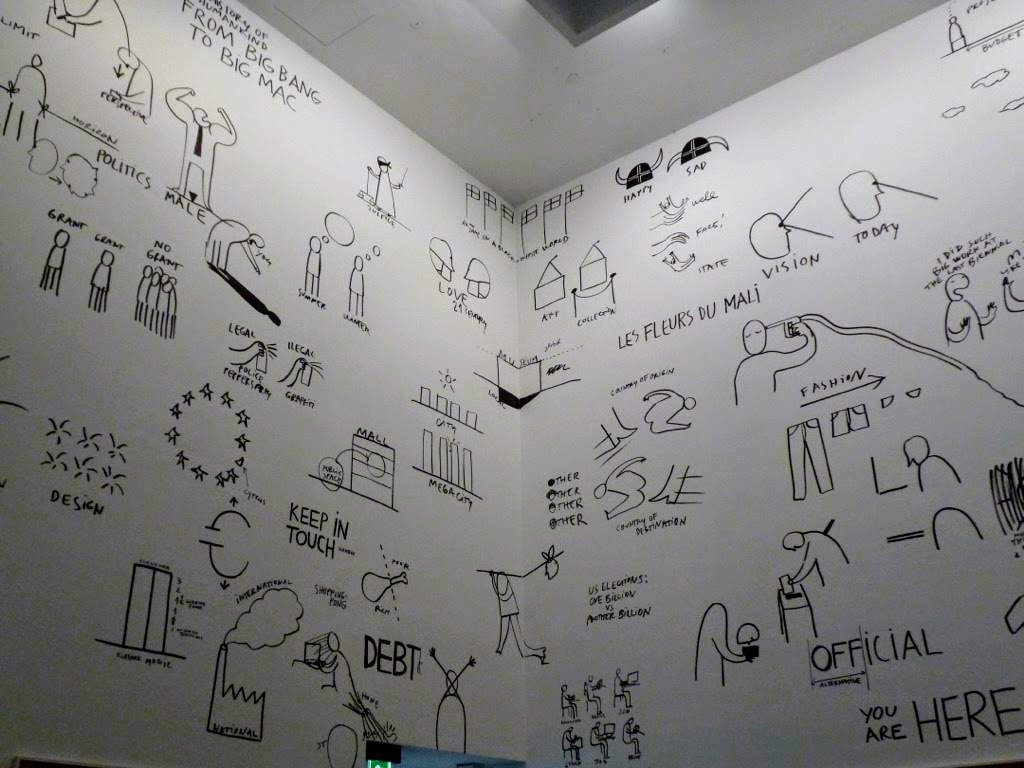
Visual communicator Angelika Skotnicka provides a strong case for why we want to consider visual thinking and how it is done from the perspective of graphic recording.

Consider ways to bring in visual thinking to your project planning, service design, evaluation, and strategy development. It is low-risk, high-reward and is an engaging, low-cost, and often enjoyable way to generate enormous insight quickly and effectively.

Want to learn more? Contact us and we can help you bring your ideas to light visually and more.

Written by cplysy · Categorized: cameronnorman

Dec 09 2019

Innovation Strategy: A Tool

Innovation development and execution are highly affected by what kind of environment you operate in. For innovators in business, the public sector, and healthcare questions abound like:

How can we determine what kind of market — whether it’s products, services, and policies — do we want to focus on? What does innovation look like in each of these? How do we align who we are with what we want to do?

We have developed a new tool for helping you navigate the various markets you are in, could be or would like to be in. The tool is available by clicking on the link.

Blue Ocean Strategy Framework

One of the popular approaches to conceptualizing the domains of organizational strategy is the Blue Ocean strategic model developed by Chan Kim & Renée Mauborgne. The model distinguishes Red Ocean from Blue Ocean environments or marketplaces where businesses compete**.

(** or any organization seeking to differentiate itself in the marketplace of ideas and attention — it’s not just for profit-seeking ventures)

The Blue Ocean Strategy Framework presents a dichotomy between zones of competition and makes the distinction that organizations are either creating their own path or competing within existing contexts.

This dichotomy is useful for business but neglects much of the work that is done within social innovation and public sector innovation where there are spaces of co-creation and collaboration that exist with and among partners by design and necessity. In these areas the need to work together across contexts and often in ‘co-opetition‘ where organizations who might compete for resources at one moment might also rely on those others to succeed.

To help understand this we’ve developed a useful framework (or canvas, when used as a tool) for considering two additional areas to address when developing a strategy. This framework — presented visually below — introduces two new zones of strategy that complement the red/blue ocean strategy.

Beyond Oceans

The two additional zones include the Green Forest and an interstitial area akin to the Gulf Stream or Atlantic Drift ocean currents that carry water from both zones, greatly influence the climate beyond them and provide a unique ecosystem between them.

The Green Forest is an environment that feeds off the ocean and the nutrients from the currents. It’s those areas of collaborative innovation where no single organization can create a true difference on its own and where there might not even be an advantage to doing so.

Organizations might operate in many different areas depending on their size and configuration, however, the projects and work that is done and the strategy required to generate it might require the kind of mapping and zonal ‘marking’ that allows it to avoid confusion and discover the needs and challenges it faces more effectively.

Consider using this model in your work. None of these are ‘good’ or ‘bad’ rather they describe environments and contexts of strategy that can guide your innovation development and deployment. Knowing what environment you are working within allows your organization to better strategically align its planning, resources, and operations to suit that context and succeed.

Note: Are you interested in exploring different strategic domains and want some help applying this framework to your organization? Contact us and we’ll show you navigating these different terrains can help you see more and do more in your organization than you ever thought possible.

Photo by Aviv Ben Or on Unsplash and by Fezbot2000 on Unsplash

Written by cplysy · Categorized: cameronnorman

Nov 26 2019

Breaking the Ice

Meetings, events, and other facilitated face-to-face gatherings only work if people engage with each other. Doing this requires some kind of interest or ability to connect with one another in person. While there are certainly some people who have little difficulty engaging with new people in unfamiliar settings, many struggle.

This is where the icebreaker comes in.

Software and services firm Atlassian has prepared a great list of practical exercises to help spice up the usual icebreaker. These can be taken as they are or adapted for use at your next meeting or event.

Surprise

The first cluster of these uses the notion of ‘surprise’ to get people talking about something that is low risk but also gets people curious. For example, questions like these are nearly impossible to predict answers to and also can enlist some creativity in responses without necessarily revealing too much about a person.

  • What animal would choose to be, and why?
  • What is your superhero name?

Fun

Another theme within these techniques and tools is fun. One of the approaches to fun is to leverage surprise with an activity that allows people to share in an experience. An example is co-creating something. While design often looks to create the best of something a fun way to engage small groups is to create the worst of something.

This approach is similar to the program flipping exercise we do as part of the Design Loft Experience where we ask participants to design a program in a way that takes the current expectations and makes them a little worse. Do it over and again and you create a space for fun, creativity, and a chance to explore an issue in further detail.

Make your next meeting different and engaging by introducing surprise and fun to the way that people connect with one another.

Written by cplysy · Categorized: cameronnorman

Oct 08 2019

Developmental Evaluation Preparedness

Pilots have a pre-flight check before they fly a plane. A developmental evaluation journey requires the same kind of preparedness.

Developmental Evaluation (DE) is an approach to strategic learning designed for understanding and supporting innovation. This approach to data-driven learning requires a specific set-up to do well. While we need a mindset, skillset, and toolset to do DE, we also need a receptive system to make it all work.

Here are the things you can do to lay the groundwork for doing DE and making it a success. Think of this as your pre-flight checklist for a journey of learning together.

These are attributes and may be found within individuals, but it’s better if they are distributed widely across the organization.

Mindset

The most important aspect of a Developmental Evaluation is creating the right mindset. This mindset is focused on complexity, adaptation, and development (vs. improvement, linear growth). A list of statements to examine whether you have the right mindset is available on Censemaking and can provide a start.

Some other mindset questions include:

  1. Openness to experience. A DE will likely take a journey that can’t be fully predicted, much like a road trip. An openness to a non-linear pathway toward a preferred destination and the willingness to adapt the path and the destination based on evaluation data and evidence is key.
  2. Tolerance for ambiguity. Few of us enjoy uncertainty, but we all need to deal with it when working on a DE.
  3. Self-awareness. We often get in our own way. Understanding how we think and the biases and perspectives we hold is important to knowing when they serve us and when they are a barrier to innovation. Mindfulness is a part of this quality.
  4. Patience. This is a skill and mindset quality. Knowing that things will unfold at a time and pace that might change is useful — and requires patience in just knowing that.
  5. Evaluative thinking. This is a form of thinking that gets us connecting our activities, outcomes, and effects and asks three key questions about how we know something (and what to do about it).

Skillset

Developmental evaluation is not for the unskilled. While many of the qualities inherent in a DE are natural to people, they are not commonly practiced in organizations. DE is an approach, and while a skilled evaluator might have many methodological skills to do much of what is in a DE, without the following skills — with the evaluator, the evaluation team, the organization, or all of them — you won’t likely succeed.

  • Facilitation. A DE is a collaborative endeavour. You need facilitation skills to engage the diversity of perspectives in the system and coordinate the discussion, feedback, and opportunities for everyone to engage with these perspectives.
  • Sensemaking. Sensemaking is a participatory process that involves taking data that may be difficult to understand, ambiguous in its conclusions, or incomplete and helps people make sense of what it means for the organization within the present context and strategic needs. Sensemaking for DE helps guide decision-making and strategy.
  • Complexity and Systems Thinking. A distinguishing feature of DE is the use of applied thinking from systems science and complexity to guide the entire process. This means creating designs and processes that are sensitive to detecting emergent properties, network effects, organizational behaviour (like self-organization), and non-linear or algorithmic change dynamics.
  • Dynamism. Complexity also requires that an evaluation be designed with consideration of the dynamics of the program, actors, and system. This means adapting or developing from a moving position, not a static position. It also involves designing evaluations that take into account the growth pattern and evolution of a program that suits the system. It’s about a design for changing conditions.
  • Visualization. System complexity is made more so by the inability to effectively ‘see’ the systems in our heads – there’s too much information. The ability to create system maps, visualize the dynamics and relationships within it, and facilitate discussion of those systems is critical to understanding where a program fits within it all. Visualization can be sophisticated or relatively simple in nature.
  • Design. What makes DE distinct is that it is about making modifications to the program as it unfolds using evaluation data to guide the strategy. These modifications require design and the skills — like with evaluation — require designing a program while it is moving. These developmental design skills are often overlooked and bring together service design and innovation with elements of systemic design.

Toolset

The toolset is the least specific of the three ‘sets’ for DE. Almost any method can support a DE, although unlike other approaches, rarely will there be a case where a single method — interview, survey, observation — will work on its own. A multi-method or mixed-method approach to data collection is almost always necessary.

Some additional tools or methods that are not common are ones we’ve advocated for and either developed ourselves or borrowed from other contexts. Three of the most important of these are:

  • The Living History Method. This meta-method brings together artifacts that inform the program’s early development and evolution. It recognizes that the present program is shaped by where it came from and that such a history can influence where things are going. Unless these conscious or unconscious patterns are recognized it is unlikely they will change. This method also helps record decisions and activities that often get missed when creating an innovation.
  • Dashboards. The wealth of potential information generated from a DE and available at our fingertips can overwhelm even the most skilled evaluator. Creating dashboards using simple tools and technologies can help organize the various streams of data. It also can allow someone to gain a sense of where there may be simple patterns laying within a complex layer of data.
  • Spidergrams. The spider diagram is a simple visualization tool that can work well in a DE as it helps pull various data points together in a way that allows comparison between them AND the ability to dive deep within each data stream.

Some additional perspectives on doing DE can be found in the guide (PDF) published by the McConnell Foundation by Elizabeth Dozois and colleagues.

Next time you are considering a DE, look at your present inventory of mindsets, skillsets, and toolsets to see if you have the right resources in place to do the work you need to do.

Need help? Contact us. We can help you set up a Developmental Evaluation, do one, or both. We’d love to hear from you.

Photo by Lucia Otero on Unsplash

Written by cplysy · Categorized: cameronnorman

Sep 27 2019

Systems Diagrams Made Simple

Sketch diagrams are powerful tools for visualizing complex programs and systems. This simple technique literally gets people on the same page.

Mapping out a service or product ecosystem can be a complicated endeavour. There is the entire field of systemic design that focuses on tools and strategies to engage users for starters. There are approaches like synthesis mapping and service design canvases that can help us walk through the various aspects of a system to find points of leverage, threat, and opportunity.

Nearly all of these methods and tools require user orientation and training — sometimes a little, sometimes a lot. However, in many of our engagements, particularly in healthcare, we find the time (and attention) is so limited it becomes difficult to engage participants using methods that require considerable instruction.

It’s here that we introduce a technique and tool called the system sketch map.

Sketch mapping

A sketch map is a multimedia system map that is created by using any form of representation such as blocks and arrows, stick figures, or elaborate illustration and can be developed at any moment. A sketch map gets participants past the challenge of having to learn a technique or representation convention and can be particularly useful for those participants who feel unskilled at drawing or visualizing their thoughts.

This works well with professionals who may find themselves uneasy about using visual media or do not consider themselves ‘creative’. (Note: Everyone can draw. It’s important to emphasize that this is not an art project).

The exercise works like this:

Begin with the instructions: Draw your system.

That’s it.

Some guidelines: 

  • Any visual formalism can be used. One can even combine visual approaches together.
  • Emphasize the simplest media possible: Pens and paper (or crayons), sticky notes (or stickers) are among the best tools because they are flexible, colourful, and can be combined easily. These are also inexpensive and easy to obtain.
  • Large format paper (e.g., newsprint) or whiteboards are best to use as a canvas to facilitate group participation
  • Group participation is key
  • There are no right or wrong ways to do this. Whatever participants wish to include in that system is all that matters.
  • Give participants a time frame (usually 30 – 50 minutes works best) and try and ensure there are between 4 and 6 people in the group.
  • Emphasize DOing over THINKing. It’s easy for groups to try and do this ‘right’ and analyze everything. The use of simple, inexpensive materials allows people to create ‘do-overs’ easily, erase material, revise and recreate things.
  • Lastly, strive for ‘good enough’ and ‘coherent’ over ‘excellent’ and ‘complete’ (which are highly relative in this context).

What is interesting is that the participants define what their system is and what goes in it. In making these choices it becomes evident what they see as most essential, important, or relevant.:

A completed sketch map then allows everyone (the facilitator and participants) afterward to ‘interrogate’ the map (not the map makers) and ask questions like “does this choice of colour mean anything?“, “is the distance between these two things represent some kind of scale?“, “what might be missing from all of this?”

This interactive discussion process allows everyone to explore what gets placed at different positions, sizes, in different colours, and what gets included and left out of the map. It allows for the use of symbolism (conscious or not), metaphor, and representation without having to shape or bias the participants toward using a particular way of visualizing the system.

What it is, is what it is.

This simple technique can yield enormous insights into the assumptions, structures, relationships, actors, and core components associated with a system and do so within one or two hours and with a small budget.

For more information about sketch mapping and how it can help you with your work or just for more on innovation methods, tools, and strategies, feel free to contact us. We’d love to hear from you and can help.

Photo by Danae Paparis on Unsplash and Kaleidico on Unsplash

Written by cplysy · Categorized: cameronnorman

  • « Go to Previous Page
  • Go to page 1
  • Interim pages omitted …
  • Go to page 18
  • Go to page 19
  • Go to page 20
  • Go to page 21
  • Go to Next Page »

Footer

Follow our Work

The easiest way to stay connected to our work is to join our newsletter. You’ll get updates on projects, learn about new events, and hear stories from those evaluators whom the field continues to actively exclude and erase.

Get Updates

Want to take further action or join a pod? Click here to learn more.

Copyright © 2026 · The May 13 Group · Log in

en English
af Afrikaanssq Shqipam አማርኛar العربيةhy Հայերենaz Azərbaycan dilieu Euskarabe Беларуская моваbn বাংলাbs Bosanskibg Българскиca Catalàceb Cebuanony Chichewazh-CN 简体中文zh-TW 繁體中文co Corsuhr Hrvatskics Čeština‎da Dansknl Nederlandsen Englisheo Esperantoet Eestitl Filipinofi Suomifr Françaisfy Fryskgl Galegoka ქართულიde Deutschel Ελληνικάgu ગુજરાતીht Kreyol ayisyenha Harshen Hausahaw Ōlelo Hawaiʻiiw עִבְרִיתhi हिन्दीhmn Hmonghu Magyaris Íslenskaig Igboid Bahasa Indonesiaga Gaeilgeit Italianoja 日本語jw Basa Jawakn ಕನ್ನಡkk Қазақ тіліkm ភាសាខ្មែរko 한국어ku كوردی‎ky Кыргызчаlo ພາສາລາວla Latinlv Latviešu valodalt Lietuvių kalbalb Lëtzebuergeschmk Македонски јазикmg Malagasyms Bahasa Melayuml മലയാളംmt Maltesemi Te Reo Māorimr मराठीmn Монголmy ဗမာစာne नेपालीno Norsk bokmålps پښتوfa فارسیpl Polskipt Portuguêspa ਪੰਜਾਬੀro Românăru Русскийsm Samoangd Gàidhligsr Српски језикst Sesothosn Shonasd سنڌيsi සිංහලsk Slovenčinasl Slovenščinaso Afsoomaalies Españolsu Basa Sundasw Kiswahilisv Svenskatg Тоҷикӣta தமிழ்te తెలుగుth ไทยtr Türkçeuk Українськаur اردوuz O‘zbekchavi Tiếng Việtcy Cymraegxh isiXhosayi יידישyo Yorùbázu Zulu