• Skip to main content
  • Skip to footer
  • Home

The May 13 Group

the next day for evaluation

  • Get Involved
  • Our Work
  • About Us
You are here: Home / Archives for allblogs / evalacademy

evalacademy

Apr 13 2022

Criteria Based Ranking in Developmental Evaluation

Developmental Evaluation is widely implemented and the preferred option for programs that address complex problems such as poverty and homelessness. There is a growing body of literature on Developmental Evaluation (DE) and more and more evaluators are embracing this approach (myself included!).  

For the past six months, my colleagues and I have been involved in DE. We have helped a client make important decisions using multiple evaluation tools, including surveys, document reviews, and Criteria Based Ranking (CBR).

In this article, I will explain what Criteria Based Ranking is and how we used it in Developmental Evaluation.  


What is Criteria Based Ranking?

CBR is a much simpler form of Multiple-Criteria Decision Approach, which comes from operational research, a discipline that deals with the development and application of advanced analytical methods to improve decision-making.   

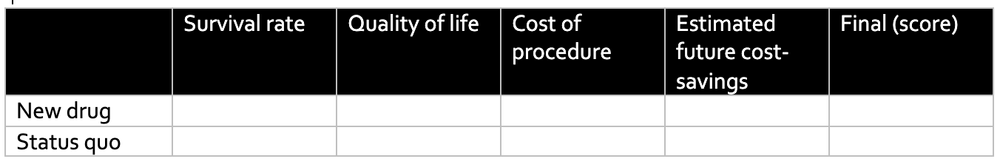
Both CBR and Multiple-Criteria Decision Approach evaluate multiple and often conflicting options, such as cost versus quality. For example, in a publicly funded healthcare system, when comparing the benefits of a new drug to the status quo, decision makers need to weigh the health benefits and economic impact of both options. It is difficult to compare cost versus effectiveness directly. CBR allows us to have a final numerical number (rank), while accounting for both criteria.    

For the DE project, we are supporting a team of community leaders that aim to improve services for seniors within the city. The decision they were confronted with was: out of the many problems and challenges seniors face, which ones should the project prioritize and use in their engagement strategy? To address this question, we first completed a document and literature review and identified 20 priority areas.  

Next, we helped them further narrow down the priority areas using a simple form of CBR. 


How to use Criteria Based Ranking in Developmental Evaluation

In CBR, the first step is determining relevant criteria you would like to use. In the healthcare example above, impact on health status (i.e., survival rate and quality of life) and on health care cost (i.e., cost of drug and estimated cost-savings of future healthcare cost) can be used to compare the new and the status quo drugs, and arrive at a final score.

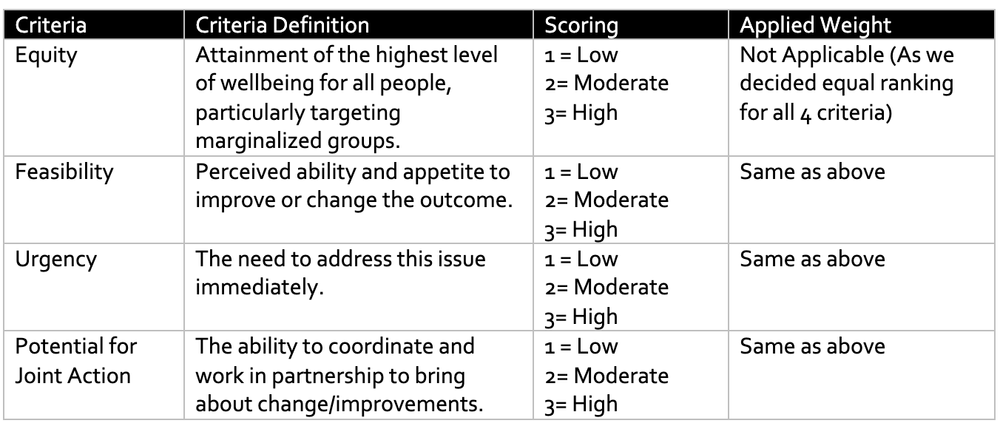
Next comes assigning a value for each criterion. For our DE project, the criteria the stakeholders picked were equity, feasibility, urgency, and potential for joint action and they decided that each of the criteria were equally important so were given the same weight. However, depending on the priority of the DE project, higher value can be assigned to some criteria if they are determined to be of higher importance relative to the other criteria.  

The final step in CBR is assigning numerical values to determine a rank. At this stage participants individually rate each of priority areas using the different criteria. 

For our DE project, using an online survey platform, we asked the stakeholders to rate the 20 priority areas from low to high using the four criteria shown below.  

We completed the analysis, and the results were surprising. Out of the 20 priority areas, the ones that stakeholders felt were sure to top the list were ranked lower and vice-versa. These results show that topic areas that often grab attention are not necessarily the ones that will be prioritized when using common principles (criteria).


Criteria Based Ranking is one tool evaluators can use to facilitate critical thinking and some level of precision in decision making, in Developmental Evaluation and other types of evaluations.

Check our other articles on Developmental Evaluation here, and here. If you have used CBR in your evaluation work, tell us about it in the comments.


Sign up for our newsletter

We’ll let you know about our new content, and curate the best new evaluation resources from around the web!


We respect your privacy.

Thank you!


Written by cplysy · Categorized: evalacademy

Mar 13 2022

The “mixing” in mixed methods

In evaluation, we use multiple types and sources of data, diverse methods of collection, or multiple evaluators to answer evaluation questions. Data integration is a way of merging these data from different sources through mixed methods. Data integration can enhance reliability in evaluation findings (e.g., by increasing the ability of findings to be replicated). It can also help to discover contradictions and inconsistencies that otherwise might not have been revealed between different sources and can clarify the results of an evaluation.  

The ability to synthesize large amounts of data to identify important information is an essential skill for evaluators. Depending on the scope of the evaluation, we often collect large amounts and different types of data, and we must triangulate them to get to the main evaluation findings. “Mixed methods” is intentionally using one data source with another, with the purpose of triangulating the results, whereas “multiple methods” is simply using different data collection strategies in the same program, but with no intention to “mix” or integrate them.  

To give you a simple analogy, “mixed methods” is like mixing coffee and milk together (e.g., latte), while “multiple methods” is having coffee and milk separately. They are both great but very different beverages.  

In this article, we discuss how qualitative and quantitative data can be integrated at the study design level, methods, or analysis level. 


Data integration at the design level

At the design level, data can be collected concurrently, or one approach can be used to inform the other.  

  • In exploratory sequential design, we can collect and analyze qualitative data and use the findings to inform upcoming quantitative data collection. A good example would be using interview or focus group results to design survey questions. This exploratory approach improves the survey as it helps to focus the questions on topics that are relevant or important to participants.  

  • Explanatory sequential design uses the findings of quantitative data to plan qualitative data collection. For example, a survey finding can be further explored using interviews to understand what, how, and why. This approach often leads to a much richer discussion as the evaluator already understands the underlying issues and can further explore those specific themes in interviews and/or focus groups.  

  • If we conduct the qualitative and quantitative data collection simultaneously in convergent design, the findings from one approach can still inform and drive change in an interactive approach. For example, using interviews and survey findings in multiple phases such that the data interact to inform subsequent versions and the final result. This approach is resource-intensive and requires many cycles of participation from respondents.  


Data integration at the methods level

Data integration at the methods level occurs when the qualitative data collection is linked to quantitative in the data collection or analysis.  

  • Data collection can be linked through the sampling frame (connecting) whereby participants for one method can be recruited/invited to participate in another method (e.g., recruiting focus group participants from survey respondents).  

I often use this approach in my evaluation practice where I recruit interview or focus group participants through surveys. It is often difficult to reach program participants thus, using one data collection effort to recruit for other methods reduces the burden on participants and minimizes evaluation cost. I use the app Calendly, which works like a dream to schedule interviews as the link to the app can be inserted at the end of the survey. Calendly will automatically show interested participants potential interview times and lets them schedule time that works for them.  

  • Other ways of integration at the methods level include embedding, which is linking data at multiple points (e.g., the use of the first round of qualitative data to understand and control for potential bias in an initial survey and using a second round of qualitative data to further explore survey results. In this example, there are two rounds of qualitative data collection and a survey between them. The evaluator uses the findings from each data collection effort to inform the next one) or bringing them together for analysis (merging). 


Data integration at the Interpretation and Reporting level

Data integration at the Interpretation and Reporting level often occurs in one of the following approaches:  

  • Narrative – describing the qualitative and quantitative findings in a report. The evaluator weaves the qualitative and quantitative findings together on a topic-by-topic basis or presents the findings in different sections.  

In my evaluation reports, I often do a combination of weaving and presenting in different sections. In the results section, I present the results of administrative data collection, surveys and interviews separately and bring them all together by general themes/topics in the discussion or key takeaway sections.  

  • Data transformation – one type of data is converted into the other type of data, then the transformed data is integrated with the other data and analyzed simultaneously. An example will be transforming the qualitative data into numeric counts and variables using content analysis to integrate with a quantitative database.  

  • Lastly, we can integrate data using joint displays, which incorporates the qualitative and quantitative data through visual means to present new considerations. The example below presents survey and focus group results side-by-side to provide comprehensive information. If you would like more information on joint displays, check out this article.  


Whichever approach you choose, integrating qualitative and quantitative data and triangulating the results often helps generate new insights and reliable evaluation results. Evaluators should consider which evaluations would benefit from mixed methods and carefully choose their data integration approach.  

Which data integration approach do you use often? Let us know in the comments.  


The data integration approaches listed here are a summary of the article “Achieving Integration in Mixed Methods Designs—Principles and Practices” by Michael D. Fetters, Leslie A. Curry, and John W. Creswell.  


Sign up for our newsletter

We’ll let you know about our new content, and curate the best new evaluation resources from around the web!


We respect your privacy.

Thank you!


Written by cplysy · Categorized: evalacademy

Feb 15 2022

Finding the Right Sample Size (the Hard Way)

In our previous article, ‘Finding the Right Sample Size (the Easy Way)’, we discuss the importance of determining the so-called “correct sample size”. Our recommendation for most applications was to use an online sample size calculator (check out our calculator HERE).

However, for those interested in calculating sample sizes by hand, or getting a better understanding of the math behind many of these sample size calculators, we outline the formulae used to calculate sample sizes. 


Estimating sample sizes (The Hard Way) 

Sample sizes can be estimated using statistical formulae by hand. While not recommended, it is important to have a basic understanding of how sample sizes are being estimated when using a tool. 

First, some definitions. 

  • Margin of error: The margin of error is how much you can expect your results to differ from the population of interest. Measured as a percentage, a smaller margin of error increases the chance that your results will be close to that of the population. Both 5% and 10% are commonly used margins of error. However, lower margin of errors will increase your sample sizes.  

  • Confidence level: The confidence level is a percentage the represents how confident you can be that the true percentage of a population (i.e., a measured value, such as participant responses to a survey question) falls within the margin of error. This value is usually 95%, but 90% and 99% are also common. Larger confidence levels will increase your sample sizes. 

  • z-score: A z-score is a value that determines how far a measured value is from the population value. z-scores can be determined from the confidence level using z-score tables (see Z Score Table for more information). 

  • Population proportion: The population proportion is the percentage of the population that has a specific characteristic. This proportion is usually determined from previous studies or research. Although, when unsure, using 50% works as an estimate. That is, 50% of the population falls below a specific point and 50% falls above a specific point. 


Calculating an estimated sample size 

The following outlines the specifics of Cochran’s sample size formula. Using the unlimited formula based on your own estimates of the z-score (based on your confidence level), population proportion, and margin of error, you can get an estimate of a sample size required for a population of unlimited size. However, this is not realistic as populations are finite. Therefore, you can take the sample size estimate from the unlimited population formula and insert it into the finite population formula. This considers the size of the population of interest and provides a better estimate of the sample size based on your needs.  

Unlimited population: 

where: 

  • n is the sample size 

  • z is the z-score 

  • p̂ is the population proportion 

  • ε is the margin of error (confidence interval) 

Example for unlimited population: 

where: 

  • z = 1.96 (Based on a 5% margin of error. Data are assumed two-tailed (i.e., a margin of error of 2.5% on each end of a normal distribution curve), thus a value of 0.9750 will be looked up within the z-score table.) 

  • p̂ = 50% or 0.50 (This value is often pulled from previous research/ literature. If unsure, use 50%.) 

  • ε = 5% or 0.05 (Same value used to get the z-score estimate but provided as a decimal/ percentage.) 

Finite population: 

where: 

  • n is the sample size 

  • z is the z-score 

  • p̂ is the population proportion 

  • ε is the margin of error 

  • N is the population size 

Example for a finite population: 

where: 

  • n = 385 (Value calculated using the infinite population formula.) 

  • z = 1.96 (Based on a 5% margin of error. Data are assumed two-tailed (i.e., a margin of error of 2.5% on each end of a normal distribution curve), thus a value of 0.9750 will be looked up within the z-score table.) 

  • p̂ = 50% or 0.50 (This value is often pulled from previous research/ literature. If unsure, use 50%.) 

  • ε = 5% or 0.05 (Same value used to get the z-score estimate but provided as a decimal/ percentage.) 

  • N = 1000 (This value is inserted if known and is often pulled from research/ literature or some prior background knowledge about the population of interest.) 


With the above formulae and examples, you will be able to calculate sample sizes on your own.

We would still suggest using an online calculator to do the heavy lifting, but having a better understanding of the math behind sample size calculation never hurts!


Sign up for our newsletter

We’ll let you know about our new content, and curate the best new evaluation resources from around the web!


We respect your privacy.

Thank you!


Written by cplysy · Categorized: evalacademy

Feb 15 2022

Finding the Right Sample Size (the Easy Way)

How many respondents do we need to take our survey? Whether it be survey respondents, program participants, or any other group of interest, evaluators are often posed with these “how many” questions. That is, what sample size is required to glean meaningful insight from the data being collected? 

The answer: it depends. 

Sample size determination depends on the questions being asked and the resources (e.g., time and money) allocated to answering these questions. However, there are tools available to calculate an estimated sample size that is large enough to provide statistically viable results, while small enough to be manageable. 

This article will briefly define sample sizes, their importance, and how to calculate them (or how to use a tool to calculate them).

These suggestions are valid for simple project designs (e.g., survey, administration data). Other resources should be consulted for more complex, research-based programs.  


Population v. Sample

Before getting to the calculation of sample sizes, we need to first be clear on the difference between a population and a sample. 

Population

A population includes all observations, or members, within a group of interest. For example, if we are interested in staff engagement within an organization, the population would include all staff within said organization. Further, if we were interested in staff engagement within the marketing department of the same organization, our population now becomes all marketing department employees. 

Sample

A sample is one or more observations (i.e., samples) taken from a population. Using the example above, if the organization employs hundreds of employees, it may be difficult to survey all staff. Therefore, we would take a random sample of staff across the organization in hopes that the sample is representative of the population. 

In most instances, sampling an entire population is not feasible. That is why smaller samples are taken from populations. These samples should be large enough to detect statistical differences within the data, but small enough as to not drain all program resources. The number of samples taken from a population is effectively the sample size. 


The importance of sample sizes 

Sample sizes are important for detecting statistically significant outcomes from your data. Generally, small sample sizes are less representative of the population of interest.

Small sample sizes are more variable and increase the likelihood of rejecting a hypothesis (i.e., fail to detect differences). On the other hand, large sample sizes are more likely to produce better statistical results but come at the cost of increased resource use and, potentially, ethical concerns from sampling more people or subjects than necessary. 

Small sample sizes

Pros:

  • Easier to collect 

  • Less resource intensive 

Cons:

  • Increased variability (e.g., outliers may skew results) 

  • Sampling is less reproducible (e.g., resampling less likely to produce similar results) 

  • Increased likelihood of accepting a false hypothesis (i.e., smaller sample sizes may detect significant differences in the data where no significant difference exists within the population) 

Large Sample Sizes

Pros:

  • Less variability (e.g., outliers less likely to skew results) 

  • Sampling is more reproducible (e.g., resampling likely to produce similar results) 

  • Increased likelihood of accepting the correct hypothesis

Cons:

  • More difficult to collect 

  • More resource intensive 

  • Ethical concerns (i.e., is it ethical to collect data from thousands of people where dozens or hundreds would suffice?) 

However, selecting the appropriate sample size is not as simple as choosing a random number. Sample sizes should be large enough to get accurate, statistically significant results, yet small enough to not overburden the project.


Estimating sample sizes (The Easy Way)

There are numerous methods for calculating sample sizes. The easiest way is to simply use a pre-made tool (check out our free sample size calculator HERE). 


Sample size calculator

Like many online calculators (Calculator.net or Survey Monkey), we use Cochran’s sample size formula (Cochran, W. G., 1977) to estimate sample sizes. Read Finding the right sample size (The Hard Way) for the statistics behind the calculation or use a sample size calculation tool for a quick and hassle-free sample size estimate.  


Sample size is not all that matters

Estimating a statistically significant sample size will help improve the validity of your analysis and results. However, sometimes these sample sizes will not be met due to logistics, ethics, or some other external constraint. Does this mean that your data are not valuable? Not at all. 

There will be times when you are unable to get the desired estimated sample size. While this may limit the statistical power of any statistical tests run on the data, it does not negate the data. The feedback on a survey can provide valuable insights, regardless of statistical significance. And perhaps generalizing to the general population is not necessary. The goal of the survey may be more relevant to a single time point or program, and the results are less about generalizability and more about getting direct feedback from a program. 

For example, when evaluating staff satisfaction using a survey, you may have a population of 100 and an estimated population size of 80 (assuming a 95% confidence level, 50% population proportion, and 5% margin of error). However, when you get the surveys back, you only receive 60 responses. This does not invalidate your results. While running statistical analyses may be limited by the sample size, you are still able to draw some insights from the data. You can get an understanding of satisfaction and dissatisfaction among the respondents which may reflect the current satisfaction of most staff. But generalizability may still be an issue. This is where triangulating your data can help. If you have other data (e.g., other outcome data, interviews, focus groups) that corroborate the results of the survey, you can have more confidence in the validity of the survey results. Tying in other quantitative or qualitative results with the survey data strengthens your findings and provides more confidence that the survey results are generalizable. 

Therefore, sample sizes should be addressed on a case-by-case basis. Make efforts to understand the needs of your evaluation, survey, or program to make the best decision with the data you were able to capture. What questions are you trying to answer and are you looking to generalize these answers at a population level? If not, there is likely some wiggle room in how many samples you should collect. However, using sample size estimate provides a “nice to have” where possible, as it will strengthen the conclusions drawn from your analysis. 


Sample sizes play an important role in detecting statistically significant outcomes. However, many factors play a role in estimating appropriate sample sizes.

This article provides some tools and formulae for estimating sample sizes for most basic project designs, such as surveys and administration data collection.

These tools will provide estimates for collecting appropriate sample sizes to glean meaningful statistical outcomes from the data.


Sign up for our newsletter

We’ll let you know about our new content, and curate the best new evaluation resources from around the web!


We respect your privacy.

Thank you!


References:

Cochran, W. G. (1977) Sampling techniques (3rd edition). New York: John Wiley & Sons. 


Written by cplysy · Categorized: evalacademy

Feb 14 2022

How to use Calendly to schedule interviews like a pro

Scheduling can be a nightmare. We have all had the experience of trying to schedule a time to meet with someone and the subsequent cascade of back and forth availability emails that ensue. Now multiply that by the number of people you need to interview in your evaluation (we are currently working on an evaluation where we are interviewing up to 60 people!).

Back in the day, we would have built a healthy line item in our proposal to account for the time required to schedule all those people. However, about three years ago we discovered a tool called Calendly that changed our interview scheduling process for the good.

This article describes how to use Calendly to schedule interviews in three simple steps.


What is Calendly?

But first, a bit more about Calendly. Calendly is a scheduling platform that allows you to set up and book meetings in a seamless, integrated way.

How does it do that you ask? First, Calendly connects to your calendar, so it automatically knows your availability. Second, it allows you to create ‘events’ and specifics around that event. For example, if you need to recruit people for a 30-minute interview you would set up a ’30-minute interview’ event.

Calendly also integrates with a number of other platforms like Microsoft Teams to automatically insert meeting links into meeting invites.

Still not completely sure? Let’s walk through three steps for how to schedule 30-minute individual interviews.


Steps to schedule interviews in Calendly 

Step 1: Create an Event in Calendly 

Sign-in to your account. Select the ‘Create’ button. It will give you the option to create an Event, choose a One-off meeting, or create a Meeting poll. Select ‘Event type.’ 

After selecting ‘Event type’ a window will open that will give you four different Event options.

For scheduling one-on-one interviews, you would choose the One-on-One option at the top. However, if you have multiple people on your team who would be conducting the interviews, then you would select the Round Robin feature. The Round Robin feature allows interviewees to see the availability of all the interviewers on your team whose calendars you have synced to Calendly. The other options, Collective and Group, could be used if you were setting up group interviews.  

Once you select the One-on-One option, a window will open where you can insert the details of your Event, including the event name, location and description. For the location, a drop down menu will appear that will give you the option to choose a physical location, phone call, or various online options (e.g., Google Meet, Microsoft Teams, Webex, Zoom, GoToMeeting, etc.). Alternatively, you can even select an option that asks the interviewee to select the location (remember when we did things in person?). 

When you hit ‘Next,’ another window will open where you can customize when interviewees book their interview. For example, if you need to complete the interviews in the next 30 days then you could indicate that. This is also where you could set the days and times people could choose for their interview, including date overrides (maybe you plan to take a day off!). You probably don’t want people to book back-to-back interviews, since some interviews can run long. To avoid back-to-back scheduling you can add time before or after an event to give yourself some buffer.

Once you’ve set up all the details for interviews you will have a custom Calendly link that is ready to share with your interviewees.

Step 2: Insert your Calendly link into the interview recruitment material 

When Three Hive conducts interviews, we often prepare an information sheet that outlines the specifics of the interview, including what we are asking interviewees to do (download a template here). This information sheet is a great place to insert the Calendly link.

However, if you are recruiting people via email you will also want to insert the link into the body of the email that goes out to potential interviewees (make sure to bold it and make it visible so people don’t miss it!) An additional option is to add a scheduling page to your website. We haven’t done this for interview scheduling yet, but it is an option in Calendly. 

Step 3: Send out the Calendly link  

When you send out the link out to your potential interviewees they will click on it (hopefully!) and be brought to your event page that will look something like this: 

Once the person selects the date and time that works for them, they will be brought to a form to enter their name, email and any other information they want to include to prepare for the meeting. The person is also given the option to ‘Add Guests.’

Once all the information is entered correctly they will receive a confirmation page and a calendar invitation that is sent directly to their email. The meeting will show up in the interviewer’s calendar – no back and forth trying to find times and locations.

Calendly also has features that allows you to build in automations, such as email and text notifications and thank you emails. All the interviewee and interviewer need to do is prep and show up for the interview.

Calendly really has been a game-changer for our consultancy. It has saved us so much time, but more importantly, also provided our clients (and evaluation participants) with a more seamless experience. Do you have some upcoming interviews you need to schedule for your evaluation? Give Calendly a try – I promise you won’t go back!


If you’re looking for some other ideas for ways to streamline your evaluation consultancy then check out this Eval Academy article: Business Tools You Need to Run Your Evaluation Consultancy.


Sign up for our newsletter

We’ll let you know about our new content, and curate the best new evaluation resources from around the web!


We respect your privacy.

Thank you!


Written by cplysy · Categorized: evalacademy

  • « Go to Previous Page
  • Go to page 1
  • Interim pages omitted …
  • Go to page 21
  • Go to page 22
  • Go to page 23
  • Go to page 24
  • Go to page 25
  • Interim pages omitted …
  • Go to page 43
  • Go to Next Page »

Footer

Follow our Work

The easiest way to stay connected to our work is to join our newsletter. You’ll get updates on projects, learn about new events, and hear stories from those evaluators whom the field continues to actively exclude and erase.

Get Updates

Want to take further action or join a pod? Click here to learn more.

Copyright © 2026 · The May 13 Group · Log in

en English
af Afrikaanssq Shqipam አማርኛar العربيةhy Հայերենaz Azərbaycan dilieu Euskarabe Беларуская моваbn বাংলাbs Bosanskibg Българскиca Catalàceb Cebuanony Chichewazh-CN 简体中文zh-TW 繁體中文co Corsuhr Hrvatskics Čeština‎da Dansknl Nederlandsen Englisheo Esperantoet Eestitl Filipinofi Suomifr Françaisfy Fryskgl Galegoka ქართულიde Deutschel Ελληνικάgu ગુજરાતીht Kreyol ayisyenha Harshen Hausahaw Ōlelo Hawaiʻiiw עִבְרִיתhi हिन्दीhmn Hmonghu Magyaris Íslenskaig Igboid Bahasa Indonesiaga Gaeilgeit Italianoja 日本語jw Basa Jawakn ಕನ್ನಡkk Қазақ тіліkm ភាសាខ្មែរko 한국어ku كوردی‎ky Кыргызчаlo ພາສາລາວla Latinlv Latviešu valodalt Lietuvių kalbalb Lëtzebuergeschmk Македонски јазикmg Malagasyms Bahasa Melayuml മലയാളംmt Maltesemi Te Reo Māorimr मराठीmn Монголmy ဗမာစာne नेपालीno Norsk bokmålps پښتوfa فارسیpl Polskipt Portuguêspa ਪੰਜਾਬੀro Românăru Русскийsm Samoangd Gàidhligsr Српски језикst Sesothosn Shonasd سنڌيsi සිංහලsk Slovenčinasl Slovenščinaso Afsoomaalies Españolsu Basa Sundasw Kiswahilisv Svenskatg Тоҷикӣta தமிழ்te తెలుగుth ไทยtr Türkçeuk Українськаur اردوuz O‘zbekchavi Tiếng Việtcy Cymraegxh isiXhosayi יידישyo Yorùbázu Zulu