• Skip to main content
  • Skip to footer
  • Home

The May 13 Group

the next day for evaluation

  • Get Involved
  • Our Work
  • About Us
You are here: Home / Archives for allblogs / evalacademy

evalacademy

Sep 07 2021

Six lessons from practicing “true” developmental evaluation


Remember when you were a kid and you heard there was going to be a new kid at school? The news spread like wild fire. Students were excited and intrigued by this new person. When the new kid arrived at school, many were eager to get to know them and figure out if the new kid could be their new friend. The more reticent school kids might have hung back and instead heard rumors about who this new kid is and what they are like. Some of those rumours turned out to be true and some not so true. 

Developmental Evaluation (DE) has been the evaluation world’s so-called new kid. Over the past ten years there has been excitement and intrigue around it. Some evaluators have explored DE as their new evaluation friend, while others remain unsure and intimidated by it. Just like the new kid at school, there remains misconceptions about what DE is and how it is actually practiced. 

 I have practiced evaluation for over ten years and throughout that time loosely thrown out the term “developmental” when describing an initiative. I have prescribed DE when it was not appropriate and I have not used DE when it was appropriate (I know I am not alone in this; I have heard many of you do it too!) DE has been overused and misconstrued so many times that now we are hearing, “but is it true developmental evaluation?” 

 I am now finally working on an evaluation that I believe to be true developmental evaluation (no really, I’m serious this time). The initiative and evaluation is in its early days. Yet, I have already had a very different experience than previous DE (and so-called DE) experiences and learned a number of lessons I’d like to share. 

In this article, I will outline my six lessons from my DE experience, including why I think it is true DE, but before we jump into that let’s quickly review what DE is. 


What is Developmental Evaluation?

According to the originator, Michael Quinn Patton, DE “supports innovation development to guide adaptation to emergent and dynamic realities in complex environments1.” Unlike more traditional approaches, it is embedded rather than detached, continuous rather than episodic, and has a goal of learning not judgment. 

My favourite metaphor to clarify how DE differs from other traditional evaluation approaches is the following Bob Stake metaphor:   

“when the cook tastes the soup, that’s formative; when the guests taste the soup, that’s summative….DE begins before cooking, when the chef goes to the market to see what vegetables are the freshest, what fish has just arrived and meanders the market considering possibilities of who the guests will be, what they were served last time, what the weather is like and considers how adventurous and innovative to be with the meal.”  


Lesson 1 – Just because it is called DE, doesn’t make it so

In the past, I have worked on evaluations where stakeholders have said they wanted DE; however, as the work progressed it became clear it wasn’t. For example, they have stated the purpose for the evaluation was for learning, but then continued to focus on funder needs and accountability-type questions. Or, the initiative may have already developed its model and was really just looking to improve it, not necessarily to develop it. I’ve also worked with clients who say they want “rapid feedback” but then indicate that rolling up the findings into an interim and/or final report is how the data should be reported. Some clients insist on DE, but then want a traditional, static evaluation plan with retrospective evaluation questions. This is not DE. 

 My current DE experience was different from the start. It started with a RFP that identified the need for a developmental evaluator. While this is not unique, what was unique was how the RFP articulated details that aligned with DE. The RFP described the vision for its work and outlined a high-level idea of what is needed to get there, including the need for data to inform the development and implementation of its work. It also outlined related DE concepts like complexity and systems change. It did not focus on us relaying our understanding of the initiative and spelling out a detailed evaluation plan.  After being shortlisted, our interview focused on DE concepts and our firm’s experiences with DE, particularly my knowledge and evaluator skills. That conversation really solidified that, if selected, it would be true DE.  

Lesson 2 – Drink Through a Fire Hose

The J.W. McConnell Family Foundation and the International Institute for Child Rights and Development have published A Practitioner’s Guide to Developmental Evaluation in this guide they state: 

 “your effectiveness as a developmental evaluator is determined, in part, by how well you understand the initiative and the broader context in which it is situated.”  

My client and I both understand this to be true. As a result, our first meeting didn’t have an agenda. The only purpose was having an unstructured conversation that went over the history of the initiative, where it is at now, what data has been collected, what questions they are struggling with, and where they think they might be headed. Through that discussion, we talked about various stakeholder groups, past conflicts that have arisen, and potential future conflicts that may occur. We recorded that session and I took oodles of notes that I still refer back to. During that conversation, there was reference to a number of documents that I combed through afterward to try and understand. It was like drinking through a fire hose, but slowly, after attending subsequent meetings and having multiple conversations, the stakeholders, language, questions, and broader context are beginning to make more sense. 

Lesson 3 – Make Friends

A Practitioner’s Guide to Developmental Evaluation also says that the quality of relationships determines the degree to which a developmental evaluator can access information and influence change. 

As an external consultant working virtually with clients, I cannot emphasize enough the importance of making friends (aka building relationships). But making friends takes time. Remember that new kid at school? It took a while to get to know each other and trust each other. 

A couple of things I did to try and speed up that process was to set aside a good amount of time at the first meeting with our client’s entire team to get to know one another. And, you guessed it, we used good old-fashioned icebreaker activities! Part of one of the icebreakers was telling them a story about me that highlighted why I’m an evaluator and what evaluation is to me. We also went around and had them present an object, why it was special to them and how it reminded them of evaluation.  

I also did a short presentation on DE to try and outline expectations for the evaluation and how it differs from traditional evaluation they might have been involved in previously. In that presentation, I focused on what it might mean for them. Here’s a snapshot of some of those slides:  

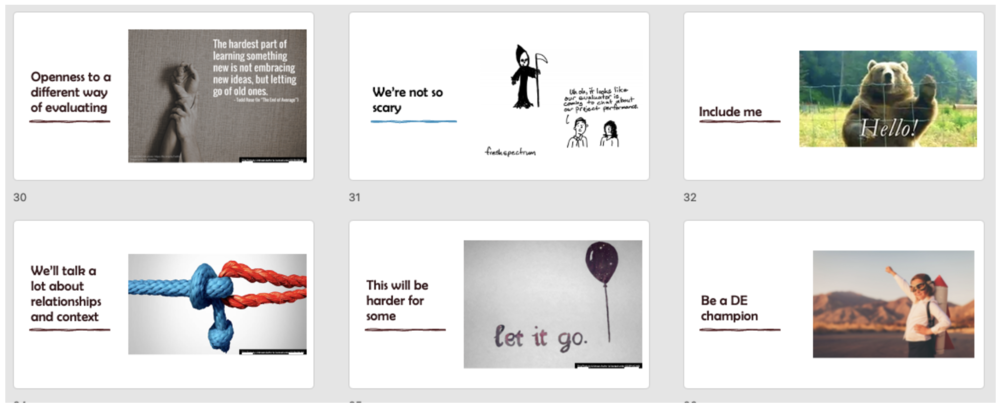
Take note of the “Include me” one. I have found that because I am not on-site people can forget about including me in important conversations and meetings. One solution for this is having an insider – a key friend who keeps me in the loop on what is happening AND reminds others to include me.

Learning #4 – Capture the gold nuggets

While drinking through the fire hose and making friends you will likely hear a number of questions that your clients are struggling with. You may hear phrases like: 

  • “how do we….?”  

  • “wouldn’t it be interesting to know….?”  

  • “I wonder if we….”  

  • “I don’t know how we’re going to….”  

  • “One of the things we need to figure out is….”  

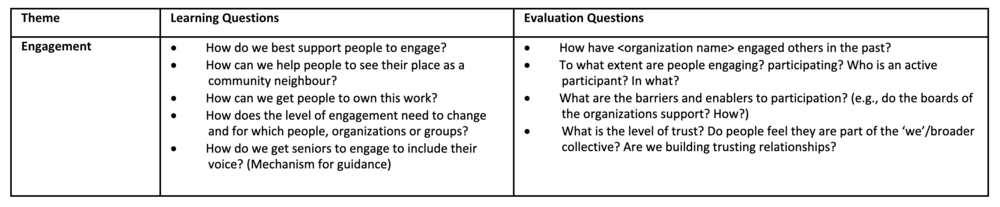
These are your gold nuggets. Pay attention to these nuggets and start capturing them. I often jot the questions down on my meeting notes, star them and then transfer them over to a question inventory. An abbreviated version is included below:  

Sometimes you might need to dig for the nuggets. You can do that by posing questions like:  

  • What questions are you struggling with? 

  • What issue(s) need clarity? 

  • Where is the energy and focus? 

  • What activity are people most animated about? 

  • Where are the quick wins? 

Learning #5 – Try to organize the chaos

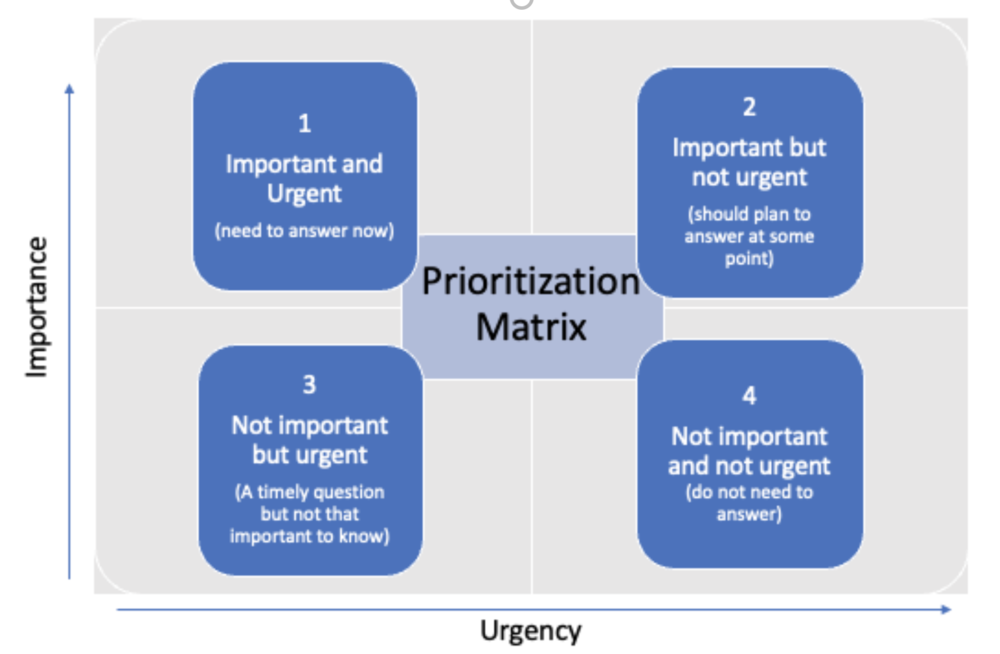
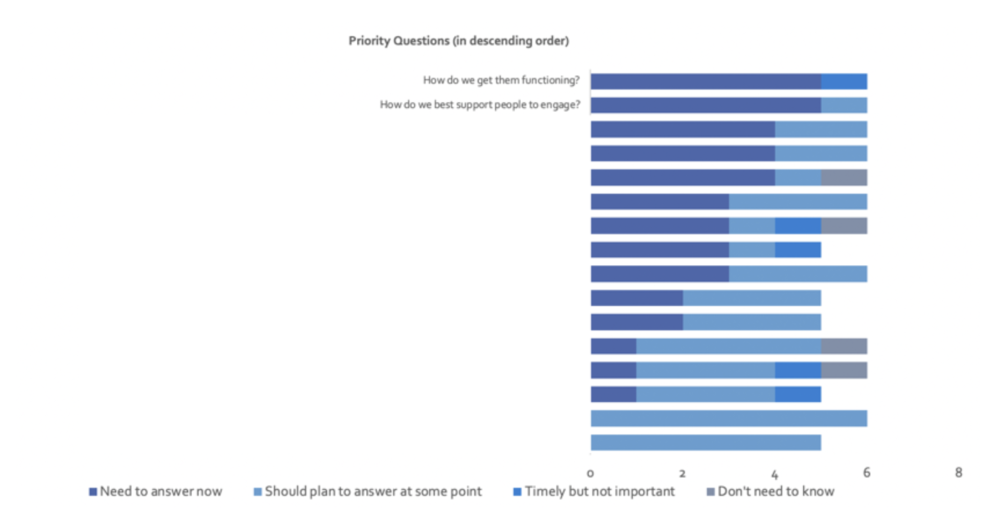
One of the key roles of a developmental evaluator is to help our stakeholders find their way through complexity. One way I’ve tried to do that is to take the list of questions I captured and work with the group to prioritize the questions we need answers to.

For this group, I asked which two questions we needed to answer in the next quarter. To identify these questions I uploaded the list of learning questions to our survey platform, Qualtrics, and then got them to rate each question according to urgency and importance. The questions were then analyzed and the two priority questions emerged. The figure below shows the matrix and the two priority questions (the remaining questions are blocked out from the graph).

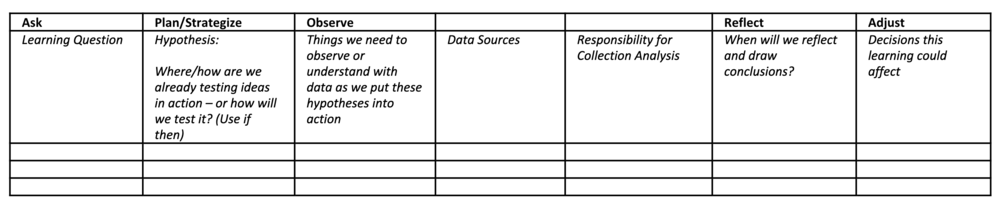
Now that we identified the two priority questions, we slotted them into a learning framework (see template below) and are beginning to answer those questions. Once we answer those questions the intent is to rinse and repeat (i.e. identify and prioritize the next questions to answer). The next questions might not even be on the original inventory – that’s the point of DE – to be responsive and adaptable as the initiative evolves and to uncover what you haven’t even considered before.

Learning #6 – Watch what you spend

Budgeting for DE and monitoring the costs is important. Prior to starting with our clients, we had an agreed budget and some loosely defined deliverables that would be included in that budget. However, if you do a good job of making friends and organizing the chaos you will find that your work will quickly snowball – pretty soon you will be included in every meeting!

My approach with this is to keep a close watch on what is being spent, update the client often on the budget, and discuss with them if/how to adjust their evaluation priorities and expectations. Another option would be to estimate the number of hours or FTE (if an employee) when scoping the project.


Those are my six lessons until this point. I am sure lessons seven through one hundred will emerge soon. Make sure to sign up for our newsletter so you don’t miss out!

Sign up for our newsletter

We’ll let you know about our new content, and curate the best new evaluation resources from around the web!


We respect your privacy.

Thank you!


Written by cplysy · Categorized: evalacademy

Sep 06 2021

Does my program need a dashboard?


One of the deliverables my clients often request is a dashboard. Those clients are looking for easy-to-understand, powerful insights at a glance. They want to be able to know what they need to know when they need to know it, then make evidence-informed decisions. And that’s great! That’s exactly the mindset needed to build a culture of evaluation. When I hear “we need a dashboard,” what I hear is “we need relatively current information that we can quickly understand and trust, and we want it on one page.”  

But a dashboard may or may not be the best way to fulfill that need. Here, I’ll clarify what a dashboard is, and what it isn’t, then provide a checklist you can use to decide if your program or organization needs one. 


What is a dashboard?

The term “dashboard” is common in business but the understanding of that term varies. A dashboard isn’t just a short report, and it’s not just an infographic. It’s:

  • A visualization of important metrics – and ONLY the important metrics 

  • Easy to understand 

  • Live – it isn’t old data, it’s what happened yesterday, or even what has happened so far today 

  • Updated through automated processes 

  • Often interactive – you can filter and segment the dashboard to find exactly what you need 

You can expect to see column charts, line charts, tables and minimal text in a dashboard.

A dashboard is NOT: 

  • Static 

  • Lengthy 

  • Text-heavy 

  • An infographic 

  • The only reporting product you’ll ever need 

United Way of Greater Toronto prepared the above infographic to demonstrate how it works. It’s a great infographic, and it’s not a dashboard.

When are dashboards helpful? 

Dashboards can be a great tool to help you keep up with the latest trends in your program. I would argue that a dashboard may be more helpful for program operations than it is for program evaluation. 

 For example, if your social media engagement is important for your program, seeing how many comments are generated every day may help you plan your next day’s posts. If it’s registration time, a quick glance at yesterday’s signups could help you decide whether to open up a waiting list. If your participants complete surveys after each visit, seeing last week’s results can inform how many staff you have at the front desk next week.  

 In a monitoring and evaluation project, it may be helpful to have a dashboard displaying the proportion of sites that have reported data, or the number of households approached to complete surveys. If you need the ability to sort and filter by site or by demographic, a dashboard might just be the best solution. 

 Remember that a dashboard needs an automated process to load and refresh data. That means that you need a data source and a method to continuously collect data. A true dashboard is most helpful when your program needs to know what’s happening urgently and regularly.  

What do you need to build a dashboard? 

The most important thing you need before building a dashboard is a very clear understanding of which metrics matter. Your team will need to come together to clarify what kinds of decisions need to be made, and which indicators support those decisions.

Each indicator will need a definition and a data source (our Performance Measures Definitions Template might be helpful). Indicators that require explanation are likely not a good fit for your dashboard; you’ll need to make sure you know your audience and how familiar they are with the content. This indicator selection process may not be easy, but it is foundational to creating a dashboard that works. Building the dashboard will likely be a significant investment of time and resources, so you’ll want to be sure it will meet your needs. 

Dashboards require a continuous source of data. Data may be gathered through registration processes, surveys, financial systems, client records or other existing administrative processes. For an effective dashboard, your program will need a clear plan with responsibilities assigned to specific team members to ensure that the right data is collected at the right time. 

 Next, you’ll need to build it. You may already have the tools and people in your office to do this work. Power BI is commonly used to create dashboards in-house, and an external consultant may use Power BI, too. You can use Excel, but it will require more manual effort; Power BI and Tableau are better suited for handling large volumes of data and creating the high-quality visualizations dashboard users want. There are also dedicated dashboard products such as Cyfe, Klipfolio, Sisense, or Geckoboard that might meet your needs.  

Hint: while we love using Canva, if that’s the platform you’re working in, you’re probably building an infographic, not a dashboard! 

You’ll probably want to test out a few versions of the dashboard and make edits based on feedback from the intended audience. If your site managers don’t understand what they’re being shown, the dashboard won’t be useful. Gather their questions, ask them to find glitches, then adjust as needed. As your program changes, you may find that revisions are necessary; it might be helpful to schedule a dashboard review to coincide with strategic planning or annual reporting. 

What are the alternatives to dashboards?

Does continuous data collection and digital automation sound like a bit much? You might not need a live, interactive dashboard. Depending on your information needs, your program might benefit more from concise, focused, monthly or quarterly reports.  

 Many healthcare, non-profit, and government programs have data that arrives slower, with decision points happening less frequently than businesses in the private sector. A lot of the dashboard literature to be found online speaks more to finance or retail companies; those companies may need to make daily modifications to their operations, while a youth after-school program may only need to reflect on data when doing annual reporting or applying for grants. Your financial team may find their QBO dashboard vital in tracking program costs, but your program planner might not have the same need for real-time data. 

Now that you’ve read about dashboards, consider whether your needs would be met by a report that is:  

  • Short 

  • Targeted at the information that helps you make decisions 

  • Delivered on a monthly or quarterly basis 

  • Easy for program staff to create with the software they already have 

Checklist: 

If you can check off most of the items below, your program might really need a dashboard. If not, consider concise, regular reporting instead. 

  • Defined audience 

  • Need for up-to-date information (daily or weekly) 

  • Shared understanding of what metrics should be prioritized 

  • Clear definitions of metrics 

  • Ongoing data collection processes 

  • Analytic software 

  • Budget for a consultant, or internal capacity to build the dashboard and automate data feeds 

  • Budget or internal capacity to troubleshoot issues 


If you’re still not sure whether your program needs a dashboard, consider a conversation with one of our evaluation coaches.  


Dashboard 

A visualization of up-to-date, meaningful quantitative data. Dashboards may contain many types of data visualizations, such as line charts, column or bar charts, pie charts, or tables. Dashboards are often interactive, allowing the user to filter and segment data. They should fit on one screen, allowing rapid understanding of the information. There should be very little text; each indicator should be clear enough that it does not require a narrative explanation. 

 Dashboards require a continuous, automated data collection approach.  

 Dashboards can be used to support performance measurement, communication, operational decision-making, learning and improvement. 


Make sure to sign up for the Eval Academy newsletter for more evaluation consulting experience shares.


Sign up for our newsletter

We’ll let you know about our new content, and curate the best new evaluation resources from around the web!


We respect your privacy.

Thank you!


Written by cplysy · Categorized: evalacademy

Aug 09 2021

Business Tools You Need to Run Your Evaluation Consultancy


Starting a company is daunting. Where do you even begin? When my business partner, Shelby Corley and I started Three Hive Consulting we had A LOT of questions. 

We knew (and still believe) that evaluation is a means for driving organizational impact, so starting an evaluation consultancy seemed obvious. What wasn’t as obvious was the HOW. How do we market ourselves? How do we determine our pricing structure? How do we find people to help do the work?  

Often it is some of those smaller, more operational type decisions that we’d get stuck on. How do we track our time?  How do we track accounts receivable and payable? How do we <insert business process>? 

This article will save you the hours of research and provide you with a list of tools that help us run our evaluation consultancy.  


1. Communication platform: Microsoft Teams

Microsoft Teams was a game-changer for us. Prior to using Teams, we were sending multiple emails a day to communicate with each other, struggling with versioning control on documents and spending way too much time trying to find where documents were located.

Now that we use Teams, we set up a team site for each evaluation project that organizes all the documentation and communication for that project in one spot. Our communication and workflows for each project are much more streamlined. Now we only use email for external communication.

Plus, more and more of our clients are using Teams and establishing us as guest users on their Teams site, which again means more streamlined external communication with them.

2. Time Tracking: Harvest

Let’s be honest: time tracking is a necessary evil as a consultant. I have to say that Harvest has made it a whole lot less evil. Prior to Harvest we used Excel, which was fine but not ideal.

What I like about Harvest is that I can have a timer on my desktop or even my phone that I can easily open to start tracking. It even lets you know when you may have forgotten your timer and nudges you to adjust it accordingly. The user interface when you log into the actual website is really helpful as well. There is one dashboard that shows us all our projects, our budget, what we’ve spent (billable amount and costs), and how much is left. We can also add contractors as users so all the project costs are tracked in one place.

We also use Harvest to invoice which makes invoicing easier for projects that are billed by the hour. Lastly, Harvest also integrates with our accounting software, which again streamlines processes.

3. Accounting platform: QuickBooks Online (QBO)

Prior to switching to QBO we were living in the accounting dark ages (think printing off receipts and other financial documentation and physically delivering that in an envelope to our accountant).

This antiquated process meant not only were we living in the dark ages in terms of process, but also just in the dark. We did not have timely insights into our finances to help guide our business decisions.

After switching to QBO it was like a light was turned on and we could finally see! Now we have a shared online platform where both business partners and our accountant can login to quickly and accurately assess what money is coming in and what money is going out and we can easily track what that looks like over time. We can even forward emails with receipts to QBO for automatic processing to lessen the bookkeeping workload.

4. Scheduling: Calendly

As evaluators, we are often scheduling meetings or interviews. I’ve eaten up a lot of time in the past emailing back and forth on potential meeting dates and times that would work to meet. Many companies will hire assistants or scheduling coordinators just to take on these tasks.

Calendly has saved us a tremendous amount of time and money by automating the scheduling and booking process. It makes scheduling interviews or focus groups so much easier for participants, too. Calendly connects with your calendar and is an add-in to your email. The email add-in means while you are trying to schedule a meeting you can just click on the Calendly button in your email and it will insert your availability (you also have the option to modify your availability if your calendar shows blocks that are inaccurate).

When you send the email to the recipient, they can then select the time and date that works and it will automatically schedule the meeting in both calendars. If you link to Microsoft Teams it will also insert the link that people need to use to join the meeting. Voila! No more emailing back and forth about who is available when.

5. Password Management: Zoho Vault

Managing passwords is the bane of my existence. Managing passwords in a company with multiple individuals gets even more complicated. In fact, all of the tools I have talked about in this article require passwords!

Thankfully Zoho offers a product called Zoho Vault that has helped make the password management process easier. With Zoho Vault, you sign-in to a “vault” that stores all your passwords for the various products. You can add people in your company as users and then select which ‘secrets’ (aka passwords) each person has access to and their access permission level to that secret.

6. Data Analysis: Excel, R, and ATLAS t.i.

Evaluation means we collect and work with a lot of data – both quantitative and qualitative. We still mainly use Excel for a lot of our analysis. You can run a lot of basic statistical analyses in Excel and also do some pretty incredible data viz in it. The best part with Excel is you don’t have to pay reoccurring fees to use it and everyone pretty much has it so you can also share reports made in Excel. For more complicated stats we use R, which is free! 

We also use Excel for some basic qualitative analysis. For any project where we need to manage and analyze larger amounts of qualitative data we use ATLAS.ti. ATLAS.ti has recently introduced a web-based platform that we expect will see continued rollout of the features we’re used to in the desktop version. 

7. Project Management: Excel and Microsoft To Do

We are still trying to figure out what project management tools will work best across Three Hive. We have tried a few like Harvest Forecast, but haven’t landed on one that fits quite right.

In the meantime, we use Microsoft To Do, which integrates with Microsoft Office 365 applications (i.e., Microsoft Teams), to plan and assign tasks. I’m told Microsoft Power Automate is also a useful tool that integrates with Office 365 that automates businesses processes and workflows, but we haven’t explored that yet.

8. Virtual Facilitation: Mentimeter, Mural, and Microsoft WhiteboardMural

In addition to being communicators, accountants, administrators, project managers, and analysts, evaluators also need to be good facilitators – my office is full of markers and sticky notes.

When the pandemic happened, I needed to figure out how to facilitate virtual whiteboard sessions. I’ve tried out Mural and really like it, but again once your free trial runs out you are stuck with yet another monthly charge.

Microsoft Whiteboard is a function that integrates with Microsoft Teams. I haven’t used it too much yet, but am keen to learn more. Another tool I have been using while facilitating to help engage with the audience is Mentimeter. If you need to wake people up, try a quick poll using Mentimeter to re-engage them.   


If you are just starting your evaluation consultancy and are a team of one you may not need some of these tools; Excel may be all you need. However, if your evaluation consultancy grows, you will find that your needs will too.

A growing evaluation consultancy means more people; more people means more processes and systems; more processes and systems means more tools to support people to do their best work. As Kevin Fishner of HashiCorp put it in this article:

“A company is a collection of both its people and its systems. People can come and go over the years, but the systems they put in place and gradually refine over time become part of the company – and companies ultimately compete based on if those systems are strong or not.”

Make sure to sign up for the Eval Academy newsletter for more evaluation consulting experience shares.


Sign up for our newsletter

We’ll let you know about our new content, and curate the best new evaluation resources from around the web!


We respect your privacy.

Thank you!


Written by cplysy · Categorized: evalacademy

Jul 30 2021

How to Deliver Bad Results


You’ve just designed, implemented, and analyzed a client satisfaction survey. Trouble is: clients are not satisfied. Uh oh. No one likes to deliver bad news.

However, there are some strategies that will help not only to soften the blow, but to make this a rewarding experience.


1. Don’t try to sugarcoat it.

In many cases, organizations hire evaluators so that they can improve, or to learn if what they are doing is hitting the mark. If there’s room for improvement, this is exactly what they’ve hired you for. Hiding bad results is not helping your client. While they may not be thrilled to learn about low satisfaction scores, or that their outcomes are not being achieved, they do need to know it so that they can make changes to their services. It may be tempting to frame data in a positive light:

“27% of clients thought your services were the best!”

But try to think about what would be most helpful to your client, and likely being more direct is the better strategy:

“73% of clients saw room for improvement.”

2. Don’t wait.

No one wants to be blindsided. Chances are, as you begin data analysis you may start to see some clues of negative results. Definitely by the time you are writing the report and working on some data viz you know what the results of the evaluation are. Don’t wait to share these!

Reading about poor outcomes for the first time in a pdf-ed final report may make your client feel defensive. Take away the element of surprise by dropping some hints in your regular meetings; allow them to get past an emotional response.

This will also give you an opportunity to assess their early reactions and think about how to frame their response when you deliver your report. Better yet, engage your client in the report writing process – the stakeholders likely have insights to share. Take a participatory approach to the data analysis and writing to maximize engagement and learning. 

3. Offer some action-oriented steps to help your client improve. 

So, the clientele said they see some gaps in services, or perhaps the service delivery model is not achieving the desired outcomes. Hopefully, your evaluation has uncovered some of the “why,” which can help you to frame some recommendations or lessons learned. What has your evaluation uncovered that will help your client to address those gaps? This is where the value of your evaluation really comes through – the “so what?”. Better Evaluation offers some great tips for drafting recommendations.

4. Supplement with other results.

Perhaps clients weren’t loving the services, and there is room for improvement, but likely you do have some positive results. Perhaps staff are really satisfied in their work, or part of the process is going really well. This approach is a nice balance to the bad news, without sugar-coating. Just because you’ve uncovered some bad results, doesn’t mean that’s all you need to focus on. Highlight the great outcomes as well.

5. Prepare to get lots of questions and time for discussion.

Poor evaluation results, while disappointing, are also interesting. Likely your client will want to know more. Their questions may actually lead to follow-up evaluations. At the very least, it will likely result in some rich discussion.

Be prepared to facilitate these discussions when you present the findings. Consider adding in some additional time to your presentation, and whether other individuals could/should be invited. Hearing from everyone may uncover new insights or point to some next steps for the organization.

Clients may ask a lot of questions. Be careful to answer according to the stories told by the data without bringing in your own biases. You may even want to plan for a follow-up discussion.


As an evaluator, one of our primary roles is to help programs or organizations understand if they are effective. Are they achieving the results they intended to? If they already knew the answer with certainty, they likely wouldn’t have hired you.

So, chances are, from time to time you will come across findings that clients are not satisfied, or a program is not performing well. As an evaluator, you can view those findings as a real opportunity.

While delivering the not-so-great news may not be the best part of your job, helping that group to uncover new insights and make changes based on your findings is very rewarding.

To learn more about applying evaluation in practice, check out more of our articles, or connect with us over on Twitter (@EvalAcademy) or LinkedIn.


Sign up for our newsletter

We’ll let you know about our new content, and curate the best new evaluation resources from around the web!


We respect your privacy.

Thank you!


Written by cplysy · Categorized: evalacademy

Jul 27 2021

Evaluation Roundup – July 2021

Welcome to our monthly roundup of new and noteworthy evaluation news and resources – here is the latest.

Have something you’d like to see here? Tweet us @EvalAcademy!

New and Noteworthy — Reads

Research vs. Evaluation

Ah, the age-old topic! This blog post by Viable Insights reflects on an activity with a group they were working with where they reflected on what evaluation is compared to research. In this post they outline five distinguishing features: 1) Underlying motivation, 2) Outcome use, 3) Generalizability, 4) Conclusive goals, and 5) Collaboration. Do you agree?

Evaluation Guru – A New Video Series

The Asian Development Bank’s (ADB) Independent Evaluation Department (IED) recently started a new video series called Evaluation Guru. The series illustrates, how to design, implement and manage evaluations. In the first episode, Nathan Subramaniam (Director of Independent Evaluation Sector projects) walks people through Evaluating Private Sector Operations in an 11-minute whiteboard video.

Systems Diagrams: A Practical Guide

Bob Williams recently released a book that outlines six approaches to system diagrams, including: 1) Rich Picturing, 2) Influence Diagrams, 3) Causal Diagrams, 4) Cynefin, 5) Viable System Model (VSM) and 6) Cultural-Historical Activity Theory (CHAT). The book provides an overview of each system diagram, their purpose, examples of what they look like, and steps on how to draw them.

Telling Your Story of Change

Tamarack Institute recently posted an article that discusses Solutions Storytelling. In this article, the author argues that the work non-profits do “carries enormous potential to be shared with a broader audience in the form of insights, and stories that offer concrete solution and reflection to many of the conversations our society is having right now” – enter Solutions Storytelling. In short, Solutions Storytelling is about bringing the same attention and rigor to stories about responses to problems as is often done with the problem themselves. As evaluators, Solutions Storytelling might offer a new approach for how to present our findings.

New and Noteworthy — Events

Tensions: A Dialogue

Organized by: Robert Wood Johnson Foundation (RWJF) & Equitable Evaluation Initiative (EEI)

Date: August 4, 2021

Moderator: Marcia Cone, Director of Practice Engagement & Evolution at Equitable Evaluation Initiative

CDC Applied Research and Evaluation Fellowship

Organized by: Centers for Disease Control and Prevention (CDC)

Application Deadline: August 18, 2021

Next-level logic models for your ATE proposal and beyond

Organized by: EvaluATE

Date: August 18, 2021

Presenter: Lyssa Wilson Becho

Working with values: values literacy for evaluation

Organized by: Australian Evaluation Society

Dates: August 20 & August 27, 2021

Facilitator: Keryn Hassall

Developmental Evaluation

Organized by: Clear Horizon Academy

Start Date: August 27, 2021

Written by cplysy · Categorized: evalacademy

  • « Go to Previous Page
  • Go to page 1
  • Interim pages omitted …
  • Go to page 27
  • Go to page 28
  • Go to page 29
  • Go to page 30
  • Go to page 31
  • Interim pages omitted …
  • Go to page 43
  • Go to Next Page »

Footer

Follow our Work

The easiest way to stay connected to our work is to join our newsletter. You’ll get updates on projects, learn about new events, and hear stories from those evaluators whom the field continues to actively exclude and erase.

Get Updates

Want to take further action or join a pod? Click here to learn more.

Copyright © 2026 · The May 13 Group · Log in

en English
af Afrikaanssq Shqipam አማርኛar العربيةhy Հայերենaz Azərbaycan dilieu Euskarabe Беларуская моваbn বাংলাbs Bosanskibg Българскиca Catalàceb Cebuanony Chichewazh-CN 简体中文zh-TW 繁體中文co Corsuhr Hrvatskics Čeština‎da Dansknl Nederlandsen Englisheo Esperantoet Eestitl Filipinofi Suomifr Françaisfy Fryskgl Galegoka ქართულიde Deutschel Ελληνικάgu ગુજરાતીht Kreyol ayisyenha Harshen Hausahaw Ōlelo Hawaiʻiiw עִבְרִיתhi हिन्दीhmn Hmonghu Magyaris Íslenskaig Igboid Bahasa Indonesiaga Gaeilgeit Italianoja 日本語jw Basa Jawakn ಕನ್ನಡkk Қазақ тіліkm ភាសាខ្មែរko 한국어ku كوردی‎ky Кыргызчаlo ພາສາລາວla Latinlv Latviešu valodalt Lietuvių kalbalb Lëtzebuergeschmk Македонски јазикmg Malagasyms Bahasa Melayuml മലയാളംmt Maltesemi Te Reo Māorimr मराठीmn Монголmy ဗမာစာne नेपालीno Norsk bokmålps پښتوfa فارسیpl Polskipt Portuguêspa ਪੰਜਾਬੀro Românăru Русскийsm Samoangd Gàidhligsr Српски језикst Sesothosn Shonasd سنڌيsi සිංහලsk Slovenčinasl Slovenščinaso Afsoomaalies Españolsu Basa Sundasw Kiswahilisv Svenskatg Тоҷикӣta தமிழ்te తెలుగుth ไทยtr Türkçeuk Українськаur اردوuz O‘zbekchavi Tiếng Việtcy Cymraegxh isiXhosayi יידישyo Yorùbázu Zulu