• Skip to main content
  • Skip to footer
  • Home

The May 13 Group

the next day for evaluation

  • Get Involved
  • Our Work
  • About Us
You are here: Home / Archives for allblogs / evalacademy

evalacademy

May 30 2024

Crafting Compelling Narratives: A Guide to Presenting Themes from Qualitative Data

This article is rated as:


In our previous article, Interpreting themes from qualitative data: thematic analysis, we introduced the concept of thematic analysis, provided you with a 5-step process to complete your analysis, and highlighted some common challenges with thematic analysis.

In this follow-up article, we explore how to present your themes effectively. Whether you’re developing a comprehensive final report, a concise summary report, an eye-catching infographic, or a presentation, how you present your themes can significantly affect the clarity and impact of your findings.

 Here are our 8 top tips to master the art of presenting themes from thematic analysis. Don’t forget to download our free infographic here!


Step 1: Understand Your Audience and Purpose

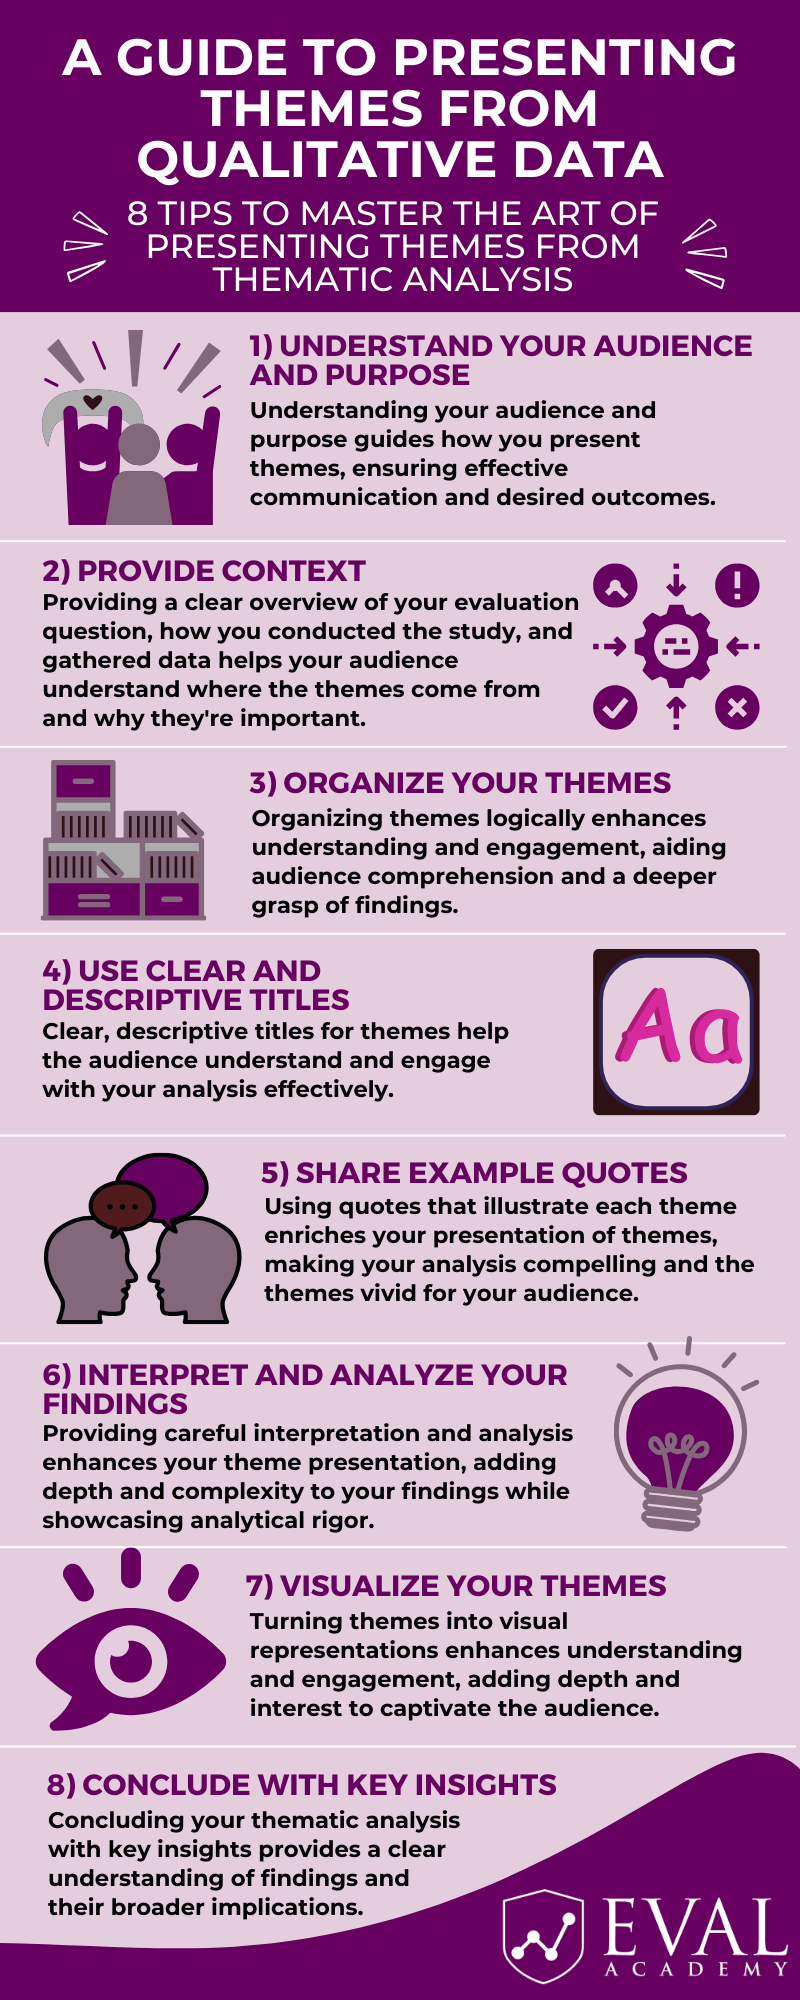
The first and arguably most important step in presenting your themes is understanding your audience and purpose. Before delving into the specifics of presenting your themes, it’s essential to consider who will be consuming this information and why.

Consider Your Audience:

  • Familiarity: Assess the understanding and experience of your audience with evaluation and qualitative analysis techniques. Do they possess a strong understanding of these concepts, or do they have differing levels of experience?

  • Audience Engagement and Relevance: Consider the diverse interests, engagement levels, and specific needs of your audience. You will need to tailor your presentation of themes and content to both captivate and resonate with their interests while ensuring that your analysis directly addresses their concerns and contributes meaningfully to their decision-making processes.

 Clarify the Purpose:

  • Desired Outcome: Determine what you aim to achieve with your thematic analysis. Are you seeking to inform, persuade, inspire action, or spark discussion?

  • Fulfilling Evaluation Questions and Objectives: Align your analysis with the broader objectives of your evaluation. How do your themes contribute to answering your evaluation questions or addressing your evaluation aims?

By taking the time to understand your audience and purpose, you can tailor your presentation of themes to effectively communicate your findings and achieve your desired outcomes. This foundational step sets the stage for the rest of your theme summary, guiding subsequent decisions regarding content, format, and delivery methods.

Now it’s time to move forward with writing and presenting the themes!


Step 2: Provide Context

Providing context is essential for ensuring that your audience fully comprehends the significance and relevance of the themes you present.

Provide an Overview of the Evaluation Questions:

  • Clearly State your Evaluation Questions: Articulate your evaluation questions or objectives. This establishes the foundation for your thematic analysis and provides clarity to your audience regarding the purpose of your evaluation.

  • Highlight the Significance: Explain the importance of your evaluation question and the broader implications of addressing it. This contextualizes your themes within the project or program being evaluated, aiding your audience in understanding the relevance and significance of your findings.

 Provide an Overview of the Methodology:

  • Outline Your Methodological Approach: Describe the methodology employed for conducting the thematic analysis, including the qualitative data collection methods utilized, such as interviews, focus groups, or document analysis.

  • Explain Your Analytical Process: Provide an overview of the steps undertaken to analyze the data and derive themes. Highlight any specific analytical techniques, whether inductive or deductive, and mention any software utilized for analysis.

  • Address Rigor and Trustworthiness: Discuss the measures taken to ensure the rigor and trustworthiness of the thematic analysis, such as inter-coder reliability checks, member checking, or reflexivity.

  • Discuss Data Saturation: If applicable, mention whether data saturation was achieved and its impact on the thematic analysis process.

Provide Supplementary Materials:

  • Include Appendices: Consider including supplementary materials, such as a copy of your codebook or a list of related themes, in an appendix of your report. This allows interested readers to delve deeper into the analytical details of your thematic analysis and enhances transparency and accessibility.

Offering a thorough overview of your evaluation question, methodology, and data collection process establishes a strong foundation for presenting your themes. This context helps your audience know the origin and importance of the identified themes which can enhance their understanding of your evaluation findings.


Step 3: Organize Your Themes

Themes within a thematic analysis are often presented in a narrative format. Organizing these themes is crucial to ensure a smooth flow in your narrative, making it easy for your audience to follow. This step is important in guiding your audience through the logical progression of your analysis, resulting in a coherent and understandable presentation of your findings.

Group Related Themes:

  • Identify Common Threads: Review your themes to identify any commonalities or relationships. Group themes that share similar characteristics or are conceptually related.

  • Create Theme Clusters: Consider clustering related themes together to form overarching categories or sub-themes. This structured approach provides clarity and coherence to your presentation.

Establish a Logical Flow:

  • Introduction and Overview: Begin by introducing the overarching themes and providing an overview of what will be covered. This sets the stage for a deeper exploration of each theme.


I see three main ways to structure your themes and analysis:

1)    Alignment with Evaluation Questions: This method focuses on organizing themes according to the specific evaluation questions they address, ensuring direct alignment with the objectives of the evaluation. It provides a targeted approach to presenting themes that directly respond to the research questions or outcomes.

2)    Sequential Presentation: This method involves organizing themes in a sequence that mirrors the progression of the evaluation or analytical journey. It presents themes in the order they were identified or developed during the analysis, providing a logical flow that reflects the process of exploration and discovery. Sequential presentation focuses on the order of identification or development as well as the weight of the themes and their prominence i.e., those that were the most prominent are discussed first.

3)    Chronological Order: This method entails presenting themes in chronological order to reflect the sequence of events captured in the data. It highlights temporal patterns or changes over time, offering insights into the evolution of themes within the context of the evaluated phenomenon. Chronological order emphasizes the temporal sequence of events.

When structuring themes and analysis for evaluation, it’s essential to consider factors such as the nature of the data, evaluation objectives, and audience preferences. For advisory groups or those deeply involved in the evaluation, a detailed approach focused on the alignment with the evaluation questions may be the most appropriate. While decision-makers may favour upfront, concise insights outlined through sequential presentation. Operational teams may benefit from practical, actionable recommendations tailored to their daily tasks as presented in chronological order. By aligning the presentation format with audience needs, clarity and relevance are maximized, enhancing the impact of evaluation findings.

  • Transition between Themes: Make sure your themes flow smoothly by using clear signals or phrases to transition between them. This keeps your analysis easy to follow and helps your audience stay engaged.

Logically organizing your themes helps people understand and stay interested. When your presentation is well-organized, it’s easier for your audience to absorb your analysis and get a deeper grasp of your findings.


Step 4: Use Clear and Descriptive Titles

Crafting clear and descriptive titles for your themes is essential for effectively communicating the focus and essence of each theme to your audience.

Craft Effective Theme Titles:

  • Capture the Main Idea: Ensure that each theme title succinctly captures the main idea or concept it represents. Aim to condense the essence of the theme into a few words or a brief phrase. Clear and descriptive titles serve as signposts that orient your audience and provide insight into the content that follows.

  • Grab their Attention: Create captivating titles that grab your audience’s attention and make them curious. Well-chosen titles can draw people in and encourage them to learn more about the themes discussed in your presentation.

  • Avoid Ambiguity and Complexity: Choose words and phrases that are clear, straightforward, and easily understood by your audience. Avoid jargon, technical terminology, or unclear language that may obscure the meaning of the theme. Keep it simple to make sure your message is clear.

By using clear and descriptive titles for your themes, you make your analysis easier to understand and more impactful. These titles act as a roadmap, helping your audience navigate through your thematic analysis and ensuring that your main points are communicated clearly. For example: “Understanding Engagement Levels: In-person programming supports higher engagement compared to online”.


Step 5: Share Example Quotes

Using real quotes from your qualitative data makes your themes more vivid and enhances how you present your findings. As we discussed in Interpreting themes from qualitative data: thematic analysis, you can set up a special “example quote” feature in your data analysis software to quickly highlight quotes that represent each theme, enabling easy retrieval while you write up your narrative. This can help to save time, streamline the quote selection process, and eliminate the need to re-read data excerpts later on.

Bring Themes to Life:

  • Select Meaningful Quotes: Pick quotes that clearly show what each theme is about. Choose quotes that capture the main ideas, emotions, or experiences related to the theme. These quotes should connect with your audience and help explain your analysis clearly.

 Represent Diversity:

  • Ensure Diverse Perspectives: Ensure that the quotes you select represent a diverse range of perspectives, voices, and experiences within each theme. This inclusivity adds richness and depth to your narrative.

  • Use a Variety of Sources: Draw quotes from various sources within your data, such as different interviewees, focus group participants, or document excerpts. This variety showcases the breadth of your analysis and reinforces the credibility of your findings.

  • Ensure Ethical Processes: Ensure that any ethical processes, such as removing identifiable features from quotes, have been followed. In projects with small populations, consider removing any unique turns of phrase or colloquialisms that could potentially identify the speaker.

Using quotes that illustrate each theme enriches your presentation of qualitative findings and helps your audience better understand your analysis. These carefully chosen quotes act as strong evidence, bringing your themes to life, and making your analysis more compelling.


Step 6: Interpret and Analyze Your Findings

Providing a thorough interpretation and analysis for each theme is crucial for enhancing the depth and impact of your thematic analysis.

Explain the Significance of the Theme:

  • Highlight Relevance: Emphasize how the theme contributes to the overall narrative of the findings. Discuss how each theme sheds light on key aspects of the program or intervention under investigation.

Explore Implications:

  • Discuss Practical Applications: Explain how insights from the theme can inform program directions or decision-making processes.

Demonstrate Analytical Rigor:

  • Demonstrate Depth of Analysis: Demonstrate the depth of your analytical engagement with the theme by going beyond surface-level description. Provide nuanced insights and interpretations that reflect your deep understanding of the data.

  • Reflect Critically: Critically reflect on the themes you’ve presented, recognizing any limitations or biases in your analysis. Discuss different ways to interpret the data or conflicting viewpoints, showing your dedication to thorough analysis and self-awareness.

Tell a Coherent Story:

  • Ensure Your Story Flows Smoothly: Make sure that your interpretation and analysis fit together smoothly to tell a clear story with your data. Blend themes, interpretations, and evidence seamlessly to create a persuasive and engaging narrative.

Connect to Existing Literature:

  • Integrate Existing Literature: If applicable, situate the theme within the existing body of literature on the topic.

  • Align with Relevant Theoretical Frameworks: Consider how the theme aligns with theoretical frameworks or conceptual models underpinning your evaluation if applicable.

By offering thoughtful interpretation and analysis, you enrich the presentation of your themes, adding depth and complexity to your findings and demonstrating analytical rigor.


Step 7: Visualize Your Themes

Visualizing your themes through charts, graphs, or thematic maps can significantly enhance the clarity and impact of your presentation of themes. Visualizations provide an alternative mode of understanding that complements textual descriptions. Incorporating visual elements can increase engagement and retention of information. Take a look at our article: 3 Easy Ways to Quantify Your Qualitative Data.

Choose Appropriate Visual Formats:

  • Select Visual Aids: Choose visual formats that are suitable for representing the nature of your qualitative data and the relationships between themes. Options include bar charts, line graphs, pie charts, scatterplots, or thematic maps (see our previous article for an example).

  • Match Complexity: Match the complexity of your data and analysis with the appropriate level of detail in your visualizations. Simple visualizations may suffice for straightforward themes, while more complex themes may require more elaborate representations.

Convey Complex Relationships:

  • Highlight Patterns: Use visualizations to highlight patterns, trends, or relationships between themes that may not be immediately apparent from textual descriptions alone. Visual representations can help reveal underlying structures or dynamics within the data.

  • Compare and Contrast: Employ side-by-side comparisons or juxtapositions of themes to facilitate comparisons and contrasts. This allows your audience to discern similarities, differences, or variations across themes more easily.

Customize Visualizations:

  • Tailor to Audience Needs: Customize your visualizations to match your audience’s preferences and needs, considering factors like their familiarity with visual data and cultural backgrounds.

Integrate with Narrative:

  • Visual Integration for Impact: Incorporate visualizations seamlessly into the narrative to support and strengthen key points and themes. Ensure they enhance your narrative rather than detract from it.

  • Narrative Alignment: Ensure that the visualizations you choose align with the narrative structure and contribute meaningfully to the overall coherence and flow of your argument.

  • Add Contextual Information: Include explanations, labels, and notes with your visualizations to help your audience understand the meaning and importance of the theme.

Based on my experience, infographics are generally enhanced by visuals like icons, images, and pie charts, while detailed visuals such as scatterplots and thematic maps are better suited for reports. By turning your themes into visual representations, you make ideas easier to grasp and more engaging. Thoughtfully selected visuals add depth and interest to your themes, making them more dynamic and captivating for your audience.


Step 8: Conclude with Key Insights

Wrapping up your presentation of themes with a synthesis of key insights is important for solidifying understanding and emphasizing the significance of your findings.

  • Highlight Main Findings: Summarize the main themes and findings that emerged from your thematic analysis. Provide a concise overview of the key insights gleaned from your data and their relevance in addressing your evaluation questions and objectives.

  • Explore Practical Applications: Consider practical applications of your findings and how they can inform decision-making, policy development, or future programming.

  • Identify potential areas for future evaluation: Discuss unresolved issues, areas needing further investigation, or opportunities for methodological improvement based on the insights from your thematic analysis.

Summarizing key insights from your thematic analysis wraps up your narrative with a clear understanding of your findings and their broader impact.


Conclusion:

Presenting themes from thematic analysis is not just about summarizing your findings but also about effectively communicating the richness and complexity of your data. By understanding your audience, organizing your themes thoughtfully, and providing context, interpretation, and visualizations, you can deliver a compelling presentation that showcases the depth of your research insights.

Written by cplysy · Categorized: evalacademy

Apr 30 2024

New Infographic: Steps for Developing an Outcome Assessment Survey

This article is rated as:


Eval Academy just released a new infographic: “Steps for Developing an Outcome Assessment Survey”


Who’s it for?

This infographic is for anyone looking to learn more about developing a survey for an outcome assessment.


What’s the purpose?

The Steps for Developing an Outcome Assessment Survey infographic will help you to:

  • Clarify the purpose of your survey.

  • Define your participants.

  • Draft your survey questions and responses.

  • Test your survey.


What’s included?

A one-page, downloadable infographic as a PDF file.


Download the Steps for Developing an Outcome Assessment Survey infographic now!


Learn more: related articles and links:

  • Survey Questions Infographic

  • Survey Question Types

Written by cplysy · Categorized: evalacademy

Apr 30 2024

Unlocking Impact: The Importance of Evaluation for Non-Profits

This article is rated as:


Evaluation isn’t just a buzzword; for non-profits focused on making a genuine difference in their communities, evaluation is indispensable. It’s the process that lets you measure how effective, efficient, and impactful your programs and operations really are. It’s about making sure your efforts are hitting the mark.

This article will offer you evidence about why evaluation is so critical for non-profits. We’ll share practical advice and an example from the field courtesy of Three Hive Consulting.


Book your consultation with Three Hive

So, if you’re part of a non-profit and keen on understanding how evaluation can elevate your work, you’re in the right place.


Why Does Evaluation Matter for Non-Profits?

Program evaluation supports non-profits in several ways:


Three Hive’s Tips for Effective Evaluation of Non-Profit Programs:

  1. Set Clear Goals: Before diving into evaluation, you should establish clear objectives and outcomes you aim to achieve, otherwise known as beginning with the end in mind. These objectives serve as benchmarks for measuring success and guide the selection of appropriate evaluation metrics.

  2. Encourage Collaboration: Involving partners from the beginning and throughout the evaluation process fosters buy-in, collaboration, and a deeper understanding of your organization’s impact. Whether it’s donors, beneficiaries, staff, or community members, their insights are invaluable for gaining diverse perspectives.

  3. Customize Your Approach: There’s no one-size-fits-all in evaluation. As a non-profit, you should employ a variety of quantitative and qualitative methods tailored to your unique goals and context. This may include surveys, interviews, focus groups, observations,  arts-based methods, or even participatory approaches involving community members. A tailored approach ensures more relevant and actionable insights.

  4. Foster Learning Culture: Shift the perspective on evaluation from a checkbox exercise to a valuable learning tool. Encourage your team to see evaluation as a chance to grow. Welcoming feedback and being willing to adapt based on findings can transform your programs and operations.

  5. Build Evaluation Capacity: Whether you’re managing evaluations internally or seeking external expertise, having the right skills in place is key. Train your staff on evaluation principles and techniques (don’t forget to follow Eval Academy on LinkedIn for free education and resources!), or hire an evaluation consultant to complement your team’s capabilities (find out more about how Three Hive can support you). You can also learn more about evaluating your own program through our new, online course: Program Evaluation for Program Managers. This ensures you’re well-prepared to translate evaluation results into effective action.

  6. Communicate Results Effectively: Sharing your findings is as important as the evaluation itself. Develop a clear, engaging way to present your results to stakeholders, using visuals and stories to highlight your impact and learnings. Effective communication can increase support, drive action, and demonstrate accountability.

  7. Plan for Sustainability: Consider how the insights from your evaluation will be used in the long term. Embed evaluation findings into your strategic planning to ensure that improvements are sustained, and that evaluation becomes an integral part of your organization’s rhythm. Check out our article on Evaluation Sustainability Plans.


Elevating Non-Profits: Real-World Experiences from Three Hive Consulting

At Three Hive Consulting, we’ve had the privilege of partnering with numerous non-profits on their evaluation journeys.  Our collaboration with the REACH Edmonton Council on the Bridging Together initiative serves as a testament to the transformative power of thoughtful evaluation. Three Hive conducted an evaluation of the Bridging Together initiative, aimed at enhancing outcomes for immigrant and refugee children and youth. This initiative involved a collective of youth-serving non-profits, each offering programming focusing on academics, sports, life skills, culture, and recreation.

Three Hive Consulting developed an evaluation plan, engaging stakeholders to define focus areas and questions. Data collection methods included interactive sessions, surveys, micro-interviews, social network analysis, and administrative data analysis. Despite challenges in data collection, the evaluation produced actionable information. The final report demonstrated the initiative’s success, aiding in ongoing planning, informing funders, and advocating for future support. This evaluation exemplifies how rigorous assessment can drive program improvements and justify investments in non-profit collaborations.


Some of our other non-profit clients include: United Way Alberta Capital Region, Canadian Mental Health Association BC, BGC Canada, Calgary Homeless Foundation, and Catholic Social Services.


Embark on Your Evaluation Journey

Evaluation isn’t just a checkbox; it’s a catalyst for growth, learning, and impact within the non-profit sector. By embracing evaluation practices rooted in transparency, accountability, and continuous improvement, your non-profit organization can amplify its effectiveness and create lasting change in the communities you serve.

If your non-profit organization is seeking guidance on evaluation strategies tailored to your unique needs, consider reaching out to Three Hive Consulting. With our expertise in evaluation for mission-driven organizations and commitment to fostering positive change, we’re here to support you every step of the way!


Learn more

Written by cplysy · Categorized: evalacademy

Apr 30 2024

New Template: Canva design templates for creating your own Theory of Change!

This article is rated as:


Eval Academy just released a new template, “Canva design templates for creating your own Theory of Change”


Who’s it for?

Whether you’re new to evaluation or if evaluation is your main role, this Canva design template is for anyone who wants to design a Theory of Change to be more visually appealing. To use this template, you will need to set up or log in to your own account in Canva.


What’s the purpose?

This Canva design template can be used to present your own Theory of Change for any type of intervention in a more distinct format. It’s great for sharing your Theory of Change with a wider audience, such as when you want to share your model on your website.


What’s included?

One customizable Canva template that provides you with the space you need to input your Theory of Change components.

Learn more: related articles and links

You can learn more about Theories of Change on Eval Academy through the following links:

  • Differences between Theory of Change, Log Frames, Results Frameworks and Logic Models – what are they and when to use them

  • What is Theory of Change in evaluation?

  • How to develop a Theory of Change for evaluation

You can also find many other templates in our list of resources to support you in planning and implementing an evaluation. Some of our most popular templates include:

  • Theory of Change Template

  • Theory of Change Tipsheet

Written by cplysy · Categorized: evalacademy

Apr 29 2024

Survey Design: Unsure about Unsure

This article is rated as:


Designing a quality survey isn’t as easy as it seems. I’m sure we’ve all been asked to take surveys that frustrate us for one reason or another. Maybe the answer we want to choose isn’t available, the questions are confusing and poorly worded, or maybe it’s just too long and tedious.

Understanding what can lead to respondent frustration and mitigating that risk is one way to ensure your survey will get answered! One of the common sources of frustration is when the response you want to give isn’t available to you.  This is where options like “Not Applicable”, “Don’t Know”, or a neutral response come into play. Let’s delve into when and how to use these options effectively.


Not Applicable

The “Not Applicable” option (often abbreviated N/A or NA) is useful when a question might not pertain to all respondents. Including a “Not Applicable” option can prevent respondents from abandoning the survey or providing an inaccurate response. Having a “Not Applicable” option, as opposed to leaving a question blank, is clearer when you are analyzing the data. Blanks are difficult to interpret: were the response options not adequate? Did they miss the question? Was the wording confusing? N/A gives you clarity when you are interpreting results.

To add even more clarity, you can add a description to the N/A option to ensure respondents understand what it means to select it:

You could also provide an orientation in your instructions, e.g., “If you did not use the service listed, please select ‘Not Applicable’.”

If your question type uses a Likert scale, typically, an N/A option would be outside of the Likert scale. That is, if your scale is 1 – 5, N/A would be a 6th option.

An option to avoid using a “Not Applicable” response is to use skip logic in a survey. First, ask your respondents IF something applies, e.g., “Do you do this, do you own this, do you have experience with this” and IF yes, ask questions about feelings/experience and IF no, skip to the next question. This is easier to do in digital survey formats than paper formats, which can be confusing.

Another consideration when using “Not Applicable” is data entry or data coding. You likely want to be able to differentiate “Not Applicable” from blank responses and even neutral responses.


Don’t Know/Unsure

The “Don’t Know” option is beneficial when a question requires specific knowledge. Including a “Don’t Know” option can prevent guesswork and maintain the integrity of your data.

“Don’t Know” can also be used when asking an opinion-based question (e.g., how much do you agree…). In this case, “Don’t Know” may be your anchor point in the middle of your other response options. This allows your respondents to report that they don’t have a clear stance. More on this in the “Neutral Response” section below.

“Don’t Know” can also be used when asking about a future prediction, e.g., if you want to know if your respondents plan to use a service in the next six months.

I think most often “Don’t Know” and “Unsure” can be used interchangeably, but sometimes minor differences matter. I propose that “Don’t Know” is more about knowledge and “Unsure” is more about feelings.


Don’t Recall

Similar to “Don’t Know” and “Unsure”, “Don’t Recall” is a useful option when you are asking about a memory, past experience, or behaviour.  Allowing respondents to select “Don’t Recall” reduces the risk of them reporting a false memory or a best guess.


Neutral Response

A neutral response, often labelled as “Neither Agree nor Disagree”, is a staple of the Likert scale. It allows respondents to choose a middle ground if they don’t have a strong opinion on a statement. However, there’s ongoing debate about the use of a neutral option. Some argue that it can lead to fence-sitting, while others believe it provides a valid choice for respondents without a clear opinion. Consider your survey goals and your audience before deciding to include a neutral option.

If you choose to omit a neutral option in a two-sided response list, you are doing what’s called “forced choice”, and your results may be more likely to provide you with insights and interpretations that align with the purpose of the survey. Sometimes that middle point gives respondents a way to answer quickly without thinking more deeply about their selection, leading to the potential that the collected data are not accurate.

Interpretation of the middle point can be problematic: does it reflect true neutrality or just indifference? Did the respondent not understand the question? Forced choice can offer more declarative data and reporting, but it can also turn off respondents who may genuinely be in that middle ground, and lead to more questions left blank.

Have you ever analyzed survey data and found that one or two questions have an abnormally high rate of neutral responses? This may actually be an indication that the wording is off, or you’re using a double negative that confuses people, so they select neutral in hopes of not being ‘wrong’.


Other, Please Specify

“Other, please specify” is a helpful option when you want to avoid short answer questions but know that your multiple choice or drop-down lists may not be exhaustive. If you know the top choices that are likely to be selected but know there may be some outliers, “Other, please specify” limits your need to analyze qualitative data and allows your respondents to give a true answer. I often use this for job titles or roles:


Summary

Including these middle-ground or opt-out response choices can help maintain data integrity and improve response rates. However, they should be used thoughtfully and sparingly, as overuse can result in non-committal responses and make it more difficult to find insights based on findings. However, they are absolutely necessary for some questions and if they’re missing, they can lead to frustration and survey abandonment, or worse, false responses.  Always pilot test your survey to ensure that these options enhance, not detract from, your data collection.

Have you heard of “satisficing”? It sounds like a made-up word but it’s not. Satisficing is when respondents give a “good enough” answer instead of cognitively taxing themselves to come up with a true-er response. It makes surveys easier to do because you don’t have to think deeply about each question, but it’s terrible for interpretation and findings!

Whether or not you choose to include these response options may involve considering your sample size and your target audience. If your sample is small and you want to avoid fence-sitting, forcing choices may be appropriate. If your target sample may already have some barriers or struggles with responding to a survey, allowing for some opt-out responses may also be appropriate.


Check out some of our other survey design content:

  • Survey Question Types — Eval Academy

  • Survey Design Part 1: Planning for your survey – A review of Designing Quality Survey Questions (2019) by Robinson and Firth-Leonard — Eval Academy

  • Survey Questions Infographic — Eval Academy

Written by cplysy · Categorized: evalacademy

  • « Go to Previous Page
  • Go to page 1
  • Interim pages omitted …
  • Go to page 4
  • Go to page 5
  • Go to page 6
  • Go to page 7
  • Go to page 8
  • Interim pages omitted …
  • Go to page 43
  • Go to Next Page »

Footer

Follow our Work

The easiest way to stay connected to our work is to join our newsletter. You’ll get updates on projects, learn about new events, and hear stories from those evaluators whom the field continues to actively exclude and erase.

Get Updates

Want to take further action or join a pod? Click here to learn more.

Copyright © 2026 · The May 13 Group · Log in

en English
af Afrikaanssq Shqipam አማርኛar العربيةhy Հայերենaz Azərbaycan dilieu Euskarabe Беларуская моваbn বাংলাbs Bosanskibg Българскиca Catalàceb Cebuanony Chichewazh-CN 简体中文zh-TW 繁體中文co Corsuhr Hrvatskics Čeština‎da Dansknl Nederlandsen Englisheo Esperantoet Eestitl Filipinofi Suomifr Françaisfy Fryskgl Galegoka ქართულიde Deutschel Ελληνικάgu ગુજરાતીht Kreyol ayisyenha Harshen Hausahaw Ōlelo Hawaiʻiiw עִבְרִיתhi हिन्दीhmn Hmonghu Magyaris Íslenskaig Igboid Bahasa Indonesiaga Gaeilgeit Italianoja 日本語jw Basa Jawakn ಕನ್ನಡkk Қазақ тіліkm ភាសាខ្មែរko 한국어ku كوردی‎ky Кыргызчаlo ພາສາລາວla Latinlv Latviešu valodalt Lietuvių kalbalb Lëtzebuergeschmk Македонски јазикmg Malagasyms Bahasa Melayuml മലയാളംmt Maltesemi Te Reo Māorimr मराठीmn Монголmy ဗမာစာne नेपालीno Norsk bokmålps پښتوfa فارسیpl Polskipt Portuguêspa ਪੰਜਾਬੀro Românăru Русскийsm Samoangd Gàidhligsr Српски језикst Sesothosn Shonasd سنڌيsi සිංහලsk Slovenčinasl Slovenščinaso Afsoomaalies Españolsu Basa Sundasw Kiswahilisv Svenskatg Тоҷикӣta தமிழ்te తెలుగుth ไทยtr Türkçeuk Українськаur اردوuz O‘zbekchavi Tiếng Việtcy Cymraegxh isiXhosayi יידישyo Yorùbázu Zulu