• Skip to main content
  • Skip to footer
  • Home

The May 13 Group

the next day for evaluation

  • Get Involved
  • Our Work
  • About Us
You are here: Home / Archives for allblogs

allblogs

Aug 29 2023

New Infographic: A Beginner’s Guide to Evaluation: A summary of introductory resources for new evaluators

This article is rated as:


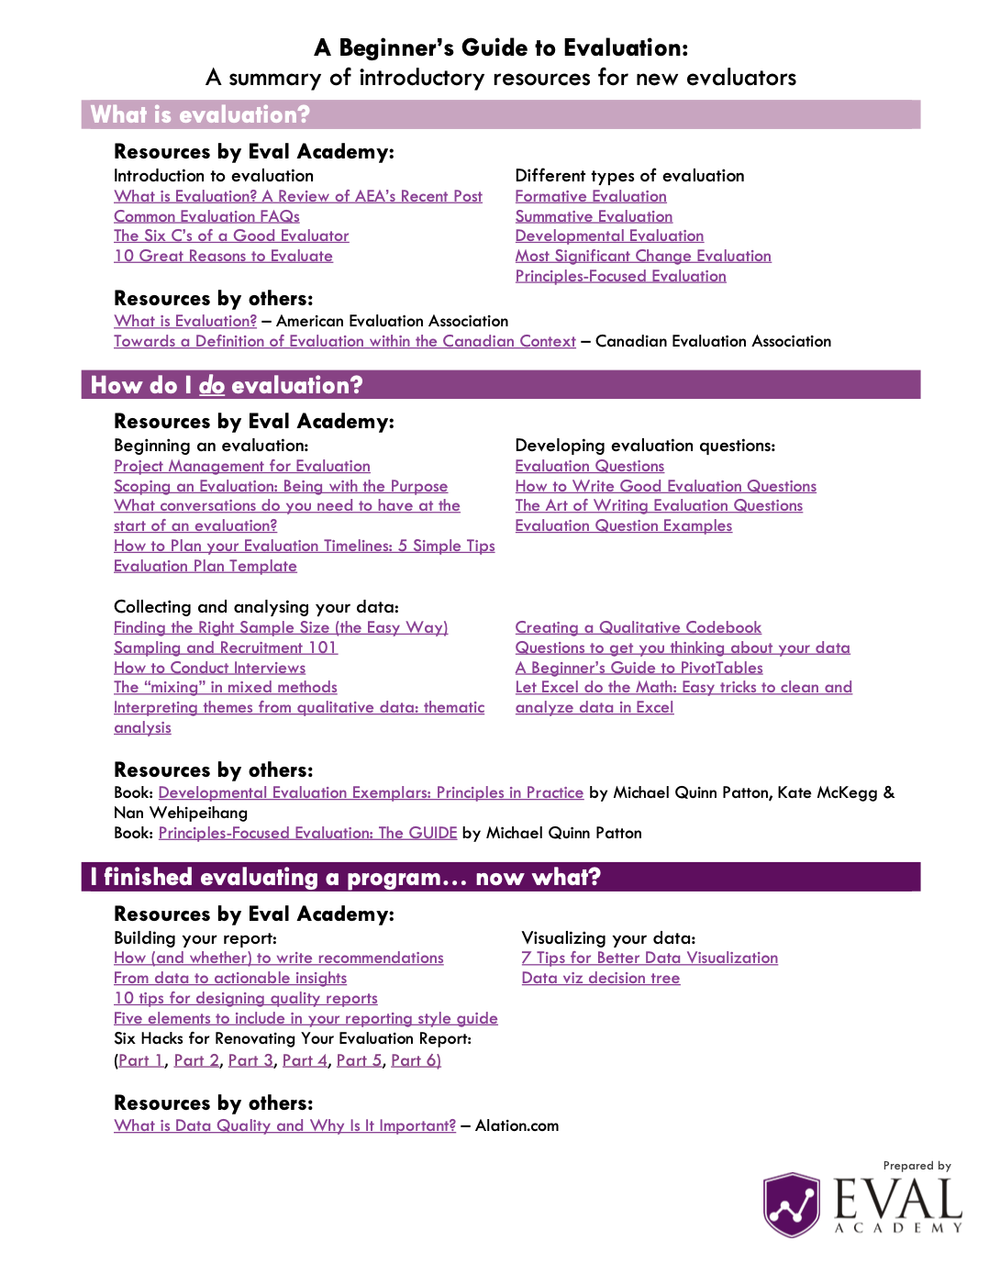
Eval Academy has released a new infographic “A Beginner’s Guide to Evaluation: A summary of introductory resources for new evaluators”


Who’s it for?

This infographic is designed for individuals who are new to the field of evaluation and are eager to explore it in more depth.


What’s the purpose?

Our goal with this infographic is to empower newcomers to the world of evaluation by guiding them toward essential resources that address three fundamental questions: 1) What is evaluation? 2) How do I do evaluation? And, 3) I finished evaluating a program…now what?


What’s included?

Within this concise, one-page downloadable PDF, you’ll discover a collection of hyperlinks that lead you to the most relevant resources, helping you quench your curiosity and expand your understanding of evaluation.


Join us in your journey of discovery and growth in the field of evaluation with this comprehensive and user-friendly infographic!


What do you think of our latest infographic? Let us know in the comments below!

Written by cplysy · Categorized: evalacademy

Aug 28 2023

Tools to Write in Plain Language

This article is rated as:


What is Plain Language?

Plain language is writing in a way that is easy for most people to understand. There are many ways to write in plain language. The goal of using plain language is always to be as clear as possible. 

Plain language can be:

  • Using words that most people would know

  • Leaving out extra details that are not needed

  • Using lists instead of blocks of text

  • Using headings to separate your ideas

  • Aiming to write at a grade 8 reading level or lower

  • Using the active voice rather than the passive voice

  • Using short and simple sentences without many commas


Plain language is not:

  • “Dumbing down” your writing

  • Using jargon, many acronyms, and insider language

  • Writing with words that are long and not commonly used

  • Using complex sentence structures and colloquial phrases

  • Something that is only used when writing for “uneducated” people


An example paragraph that does not use plain language:

“The purpose of a plain-language approach in written communications is to convey information that the audience needs to know in a way that they can easily understand. It should not be confused with an oversimplified, condescending style.”

 Written by the Government of Canada Communications Community Office

The same paragraph from the Government of Canada Communications Community Office that was rewritten by Chat GPT to use plain language:

“Using plain language in writing means sharing information in a simple and clear way, so that the audience can easily understand it. But it’s not the same as talking down to people or making things too simple.”

 Re-written by Chat GPT


 Why is it important to write in plain language?

Personally, I think it is always better to write with the goal of being as clear as possible. Why wouldn’t you want people to understand what you are saying? Furthermore, knowledge translation is an important part of being an evaluator. If your clients and the public can understand your evaluation findings, they will be more likely to use them.

 Other important reasons to write in plain language:

  • 48% of adults in Canada struggle with literacy

  • 17.9% of Canadians over 15 years old have a learning disability

  • 1 in 4 Canadians speak a first language that is not English or French

  • Plain language is more accessible for people with disabilities overall, such as those who use screen readers


What are the tools that can help me write in plain language?

You don’t need to be a good writer to be able to write in plain language. These days, there are many tools that can help you. If you work with sensitive information, make sure you check the privacy policy of a tool before using it.


1.     Artificial Intelligence (AI) Writing Tools

Any AI writing tool should be able to help you write in plain language. Many of them act as editors with the goal of making your writing easier to understand. The simplest one to use is probably Chat GPT. You can copy and paste any text into Chat GPT and ask it to rewrite it for you in plain language. It is also free to use. Just make sure that you are not copying and pasting any sensitive information.

 AI writing tools that can help you write in plain language:

  • Chat GPT (free version available)

  • Grammarly (free version available)

  • Microsoft AI Copilot (pending release)


 2.     Readability Tools

There are many tools that can help you check the readability level of your writing. You can use these tools to check on the reading level of your work, as you are writing it. Your goal should be to aim for a grade 8 level of readability. If you use Microsoft Word, you can view your Microsoft Word Readability Statistics for anything you write. It can show you the Flesch-Kincaid Grade Level for your writing. We recommend that you use readability tools as a guideline. Different tools calculate readability differently, so use your own judgement as well when you are writing.

Readability tools that you can use to check the level of your writing:

  • Microsoft Word Readability Statistics (included with any version of MS Word)

  • Hemingway Editor (free)

  • Readable


Where can I find more information?

  • 5 free tools for easy-to-read content

  • A Guide to Using Plain Language in Writing

  • Your guide to communicating clearly and effectively with plain language

  • Demand to Understand: How Plain Language Makes Life Simple


Tag ideas: Communication, Data Driven, Evaluation, Evaluation Practice, Evaluator, Report Writing, Reporting

Written by cplysy · Categorized: evalacademy

Aug 28 2023

New Infographic: Research and Evaluation

This article is rated as:


Eval Academy has released a new infographic “Research and Evaluation”!


Who’s it for?

This infographic is designed to offer insight into the distinctions between research and evaluation, catering specifically to individuals interested in programs that encompass both components simultaneously.


 What’s the purpose?

This infographic outlines the key stages of research and evaluation while emphasizing their primary distinctions. Additionally, it offers practical guidance on effectively managing a program that incorporates both these components throughout each of the major stages.


 What’s included?

You will be provided with a downloadable and printable PDF version of the “Research and Evaluation” matrix.


You can learn more about the difference between research and evaluation on Eval Academy through the following links:

  • Common Evaluation FAQs


 What do you think of our latest infographic? Let us know in the comments below!

Written by cplysy · Categorized: evalacademy

Aug 28 2023

Two Types of Tabulations: Formulas vs. Pivot Tables

You learned about two types of tables: datasets vs. tabulations.

Then, you learned about two types of datasets: contiguous vs. non-contiguous.

Now, let’s learn about two types of tabulations: formulas vs. pivot tables.

Tabulation Option 1: Formulas

Formulas and pivot tables are both correct… in different circumstances.

Here are the pros and cons of each approach so you can figure out which one you’ll need.

Formulas:

  • are necessary for tabulating numbers;
  • are faster for datasets with matching columns;
  • play well with quick vizzes;
  • give us full control over tabulations; and
  • give us full control over charts; but
  • involve a learning curve.

Formulas: Necessary for Tabulating Numbers

In Simple Spreadsheets, we talk about the calculations needed for different types of variables: nominal, ordinal, interval, and ratio.

When it comes to formulas, we can put these variables into two buckets: numbers and categories.

Numbers are test scores, ages, number of people, amount of money donated, etc.

For numbers, we need to tabulate them using descriptive statistics, which often aren’t possible with pivot tables.

Descriptive statistics for numbers might include:

  • Measures of central tendency (=average, =median, =mode)
  • Measures of dispersion (=stdev, =var, =min, =max, and range)
  • Characterizing the distribution (=skew, =kurt)
  • Quartiles (=quartile)
  • Percentiles (=percentile)
  • Outliers (There are multiple ways to define and deal with outliers; in many projects, we use +/- 3 standard deviations different from the mean)

Formulas: Faster for Datasets with “Matching” Columns

Years ago, I demonstrated how to tabulate satisfaction survey data with “matching” columns.

In the fictional-but-inspired-by-real-projects dataset, each survey question was in its own column.

Every survey question had the same options: strongly agree, agree, disagree, and strongly disagree.

In other words, this dataset had matching columns.

In this 5-minute video, you’ll see how we can write one formula, and then drag it down and across to quickly tabulate matching columns.

Formulas: Play Well with Quick Vizzes

Formulas feed seamlessly into at-a-glance visualizations, like spark lines, data bars, heat tables, and symbol fonts.

(Pivot tables don’t.)

Formulas: Give Us Full Control over Tabulations

Need to compare your numbers to a target?

Need to see how much the numbers have changed over time (e.g., percent change or percentage changes from month to month)?

These tabulations can be tedious or impossible with pivot tables.

Formulas: Give Us Full Control over Charts

We can make a billion different charts in Excel. Here’s an incomplete listing of the Excel vizardry that’s possible with good ol’ Excel.

Want to make a native chart? One of the common built-in charts, like bars, columns, pies, and lines? Pivot tables will feed into native charts just fine.

Want to make a non-native chart? Population pyramids, dots, lollipops, swarms, b’arcs, tile grid maps, diverging stacked bars, etc.? Advanced vizardry is only possible with magic tables, which have formulas underneath, not pivot tables.

For example, if you want to make a swarm plot (a.k.a. jittered dot plot), like this:

Swam plots are non-native charts, so we’ll need formulas behind the scenes to have full control over the chart’s creation and formatting, like this:

Formulas: Expect a Learning Curve

Sure, most people know the absolute basics, like sum and average.

But there are 450+ formulas and functions inside Excel.

Knowing which ones you need… at which point in the analytical process to use them… and how to use them… That takes training and practice.

Tabulation Option 2: Pivot Tables

Pivot tables are a drag-and-drop solution for tabulating our datasets.

In other words, we don’t have to write any formulas! No need to stress over jargon like “” or () or , or A1:A100.

Pivot tables are:

  • great for novices;
  • great for tabulating categories;
  • faster for cross-tabulations;
  • slightly faster for appended tables and recurring analyses;
  • way faster for mismatched columns; and
  • necessary for interactive dashboards.

Pivot Tables: Great for Novices

Let’s start with the biggest benefit of choosing pivot tables over formulas: there’s a minimal learning curve, so pivot tables are perfect for novices.

Here’s an older blog post that shows you how to get started with pivot tables within minutes. You’ll insert a brand new pivot table, and then drag and drop variables into the little boxes.

Sure, there are nuances:

  • switching the units from sums and counts;
  • double-clicking to explore mysterious entries and outliers;
  • placing two variables in the values box (e.g., counts and their percentages); and
  • refreshing the pivot table as new entries are added to the dataset.

But, anyone and everyone can learn the basics within minutes — supervisors who don’t have time to delve into the details of formulas, graphic designers who don’t need to conquer statistics, grantmakers who need to focus on the actual philanthropy and not statistical formulas, etc.

Pivot Tables: Great for Tabulating Categories

Formulas are great for numbers, because we’ll need to calculate descriptive statistics like mean, median, mode, standard deviation, variation, quartiles, percentiles, skewness, and kurtosis, among many others.

Pivot tables are great for categories, because we’ll need to calculate frequencies (like how many people).

Yes, we can also calculate frequencies with formulas (countifs, for example).

Pivot Tables: Faster for Cross-Tabulations

A regular ol’ tabulation might be the number of males and female employees.

A cross-tabulation adds another variable or two, like the number of male and female employees in each state.

Yes, we can do cross-tabulations with formulas, too (another perfect opportunity for countifs). But especially for novices, the drag-and-drop functionality is going to be faster than adding to an existing formula.

Pivot Tables: Slightly Faster for Appended Datasets with Recurring Analyses

Need to add to your dataset over time?

Maybe you collect daily outbreak data, like many public health agencies I work with.

Or, maybe you collect quarterly data from grantees, like many foundations I work with.

(Or some other time period — like weekly, or annually, or whatever.)

As you add to your dataset — your contiguous log — you can simply refresh your pivot table and it’ll incorporate the latest numbers. That means that the chart(s) linked to your pivot table will update with the latest numbers, too! Woohoo!

Yes, it’s easy to update formulas as we append datasets, too.

You simply create one anchor formula — the formula in the upper-left of your tabulation — and drag it across and/or downwards to fill all the cells, like this:

Pivot Tables: Way Faster for Mismatched Columns

Earlier, I said I prefer formulas for matching columns (e.g., all the columns contain agree-disagree response options).

I prefer pivot tables for mismatched columns (e.g., one column has agree-disagree options, another column has birthdates, another column has addresses, and so on).

It would be a huge pain to add so many different formulas along the bottom of my dataset! I might need countifs for one column, and sumifs for another column, and averageifs for another column… meh.

Pivot Tables: Necessary for Interactive Dashboards

To build interactive dashboards in Excel, you’ll need to create pivot tables, then pivot charts, then slicers.

To the best of my knowledge, interactive dashboards have to be built off pivot tables, not formulas.

Here’s an example of an interactive dashboard that’s linked to pivot tables:

The Bottom Line

There are two ways to tabulate your dataset: through formulas, or through pivot tables.

Formulas:

  • are necessary for tabulating numbers;
  • are faster for datasets with matching columns;
  • play well with quick vizzes;
  • give us full control over tabulations; and
  • give us full control over charts; but
  • involve a learning curve.

Pivot tables are:

  • great for novices;
  • great for tabulating categories;
  • faster for cross-tabulations;
  • slightly faster for appended tables and recurring analyses;
  • way faster for mismatched columns; and
  • necessary for interactive dashboards.

Neither option is terrible. Neither option is perfect.

As usual, there are pros and cons.

Your Turn

When do you tabulate your datasets with formulas vs. pivot tables?

This isn’t an exhaustive list of pros and cons. What am I missing??

Written by cplysy · Categorized: depictdatastudio

Aug 24 2023

Perspective Taking and Making

One of the myths of innovation is that something has to be new. It doesn’t. Something only needs to be new in context. This means that an old idea brought forth into a different or refreshed context can be innovative. For example, home visits and care by health practitioners have become innovative ways to address healthcare resource constraints. This approach to medicine and care is a very old way of working that was largely abandoned in the 20th century.

Perspective-taking and making is about seeing our present context through different factors. One method we use in our work is to look at an organization’s history and inventory of skills and knowledge to see what has been learned in the past (and potentially lost, forgotten, or ignored) that can bring fresh insights into the present.

An organization’s most unique value is its experience. No other organization- its people, resources, and accomplishments- has what it has. This can be ignored. To illustrate, a particular organization might operate within a market with many competitors or collaborators, but none will know or experience certain things. These things might be tied to physical location, staffing, timing of production, or something else. These experiences are often taken for granted but can benefit an organization seeking to grow, evolve, or pivot within a specific situation.

Implementation

This exercise can be done with an external consultant or a familiar person/group that knows the organization/team/people of interest but exists outside of it. That external individual or agent should be either at arm’s length, unfamiliar with the situation, or disconnected from the present context. To illustrate, consider a past mentor or teacher, a former collaborator, or a colleague from an outside firm. These are individuals who know enough about what you do but see what you do slightly differently than you do.

Engage them in a discussion about the present situation and approach the conversation as one of seeking perspective. Ask this individual or group:

  1. What does this look like to you?
  2. What opportunities do you see for me?
  3. What can I do to address this situation wisely?
  4. What assets or skills am I neglecting to use in approaching this situation?

The external person is more likely to see things that you don’t because they are less invested in the present situation while being invested in you. This gives them a greater or different set of options because their stakes are lower. They are less constrained by fear, bias, excitement, or perceived constraints than you are. This allows them to see some things more clearly while also drawing on their knowledge about you.

If you are engaging a consultant, they should spend time ahead of this exercise familiarizing themselves with the work you do, your history, and even interview or consult with people who are familiar with your work. They will combine their subject matter or process expertise with this information to help provide those different perspectives. This is the value of a different perspective.

This is how we approach our work with clients and it’s how you can be of value to those just outside your own circle.

Try this out, the perspectives you’ll see will help you escape a rut, a see new possibilities.

If you want help with this, let’s talk.

Image Credit: Nadine Shaabana on Unsplash

The post Perspective Taking and Making appeared first on Cense Ltd. .

Written by cplysy · Categorized: cameronnorman

  • « Go to Previous Page
  • Go to page 1
  • Interim pages omitted …
  • Go to page 76
  • Go to page 77
  • Go to page 78
  • Go to page 79
  • Go to page 80
  • Interim pages omitted …
  • Go to page 310
  • Go to Next Page »

Footer

Follow our Work

The easiest way to stay connected to our work is to join our newsletter. You’ll get updates on projects, learn about new events, and hear stories from those evaluators whom the field continues to actively exclude and erase.

Get Updates

Want to take further action or join a pod? Click here to learn more.

Copyright © 2026 · The May 13 Group · Log in

en English
af Afrikaanssq Shqipam አማርኛar العربيةhy Հայերենaz Azərbaycan dilieu Euskarabe Беларуская моваbn বাংলাbs Bosanskibg Българскиca Catalàceb Cebuanony Chichewazh-CN 简体中文zh-TW 繁體中文co Corsuhr Hrvatskics Čeština‎da Dansknl Nederlandsen Englisheo Esperantoet Eestitl Filipinofi Suomifr Françaisfy Fryskgl Galegoka ქართულიde Deutschel Ελληνικάgu ગુજરાતીht Kreyol ayisyenha Harshen Hausahaw Ōlelo Hawaiʻiiw עִבְרִיתhi हिन्दीhmn Hmonghu Magyaris Íslenskaig Igboid Bahasa Indonesiaga Gaeilgeit Italianoja 日本語jw Basa Jawakn ಕನ್ನಡkk Қазақ тіліkm ភាសាខ្មែរko 한국어ku كوردی‎ky Кыргызчаlo ພາສາລາວla Latinlv Latviešu valodalt Lietuvių kalbalb Lëtzebuergeschmk Македонски јазикmg Malagasyms Bahasa Melayuml മലയാളംmt Maltesemi Te Reo Māorimr मराठीmn Монголmy ဗမာစာne नेपालीno Norsk bokmålps پښتوfa فارسیpl Polskipt Portuguêspa ਪੰਜਾਬੀro Românăru Русскийsm Samoangd Gàidhligsr Српски језикst Sesothosn Shonasd سنڌيsi සිංහලsk Slovenčinasl Slovenščinaso Afsoomaalies Españolsu Basa Sundasw Kiswahilisv Svenskatg Тоҷикӣta தமிழ்te తెలుగుth ไทยtr Türkçeuk Українськаur اردوuz O‘zbekchavi Tiếng Việtcy Cymraegxh isiXhosayi יידישyo Yorùbázu Zulu