• Skip to main content
  • Skip to footer
  • Home

The May 13 Group

the next day for evaluation

  • Get Involved
  • Our Work
  • About Us
You are here: Home / Archives for cplysy

cplysy

Aug 22 2022

When a Course is More Than a Course: 3 Ways “Great Graphs in Excel” Was Beyond Graphs

Last year, I finally enrolled in the Great Graphs in Excel course. After 2 years of thinking about it. And thinking I’m retired and I don’t really make graphs anymore. But I knew I had 10 years of mentoring data I wanted to analyze by the end of 2021.

Beyond Graphs 1: I made a Great Graph after just a Few Course Modules

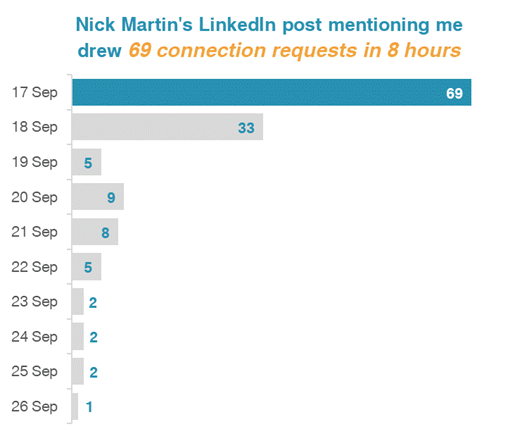
Soon after the course started, I brought Ann data about who connected with me on LinkedIn after I was listed as one of Nick Martin’s 9 Amazing Humans to Follow. Nick has a HUGE network and I got over 69 connection requests in the first day. And requests continued for more than a week!

So I made a graph to go with a post on LinkedIn, applying all the learnings from the first few course modules.

Sue Griffey's horizontal bar chart showing the number of LinkedIn connection requests she received each day.

Beyond Graphs 2: 2 Things I Learned in 10 Minutes of Help in 1 Office Hour Session

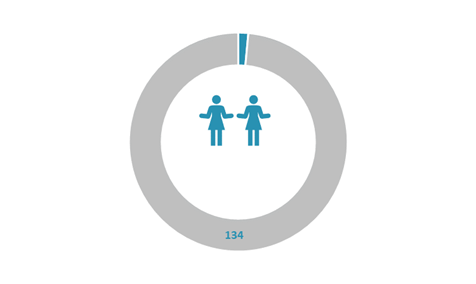
I examined the few data variables on the LinkedIn connection requests. My impression was validated. Only 2 of 136 requests had a personalized message (despite LinkedIn experts emphasizing the need to personalize connection messages).

I tried different ways to display this finding (waffle chart, pie chart, and this one). Luckily, Office Hours were the next day. (Office Hours are a CAN’T MISS opportunity for immediate feedback!)

Sue Griffey's donut chart with miniature people icons in the center.

Ann took one look and exclaimed, “Ooh, let’s try the WeePeople font!” (Well, maybe not exactly like that!)

She then quickly used WeePeople to show the data.

Learning 1: More relevant and representative visuals with icons showing diverse silhouettes

Sue Griffey's icon array showing 136 tiny human-shaped icons.

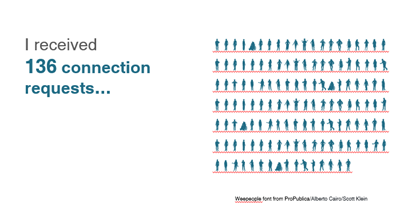
(Hooray – No more using just the standard male icon.)

And then Ann taught us all how to make a gif which was even more effective at telling the “only 2 of 136 people” story.

Learning 2: Using a gif can give readers a quick result from your data

Sue Griffey's animated icon array showing that she received 136 connection requests on LinkedIn, but only 2 included a personalized message.

And, for those who follow LinkedIn stats to see how their posts engage, the post with the bar graph got 4,765 impressions and the 2nd post (the next day) with the gif got 8,778 impressions!

Beyond Graphs 3: Now I’m Applying a Mental Checklist to Graphs and Charts

No – not only to the few graphs I’m making.

The course taught me and heightened my awareness to look at all the visual elements in the many graphics we see each day. There was so much learning from the course modules. And then many great opportunities in Office Hours to learn from what others were working on.

Here are things I find I am automatically looking for in these graphics:

  • Color choice(s)
  • Is it a Traditional or Storytelling title?
  • The clarity of the data message
  • Is the graph or chart the best for that message and the data being used?
  • What elements could be removed for better clarity?

And a Beyond Graphs Bonus: Consistency and Efficiency

I consider myself a digital pioneer. But I didn’t know what I didn’t know, even being a longtime Word, PowerPoint, and Excel user.

I jumped into the course, and my efficiency increased in the first week! The course started – not with graphs – with ensuring basics including branding by setting my color and font defaults.

And then, a couple weeks later, I set up branding for a 3-part seminar series I did for Waey, the Association for Community Health in Saudi Arabia.

A screenshot of the Theme Colors that Sue Griffey set up in her Microsoft products.

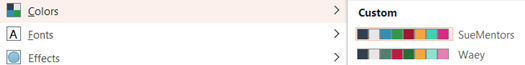
And I now have the consistency across Excel, Word, and PowerPoint and across my different PCs. What a difference!

This is just the tip of the iceberg of everything I am doing differently after Great Graphs – Excel!

Ann’s wise counsel and breadth of experience shared unstintingly!  

Connect with Sue Griffey

LinkedIn: https://www.linkedin.com/in/suegriffey/

Twitter: @SueMentors

Youtube: https://www.youtube.com/channel/UC-rjWX4ZmTdo0S3ssKbut_A

SueMentors Resources: https://suegriffey.fyi.to/suementors-resources-for-your-professional-presence

A no-cost short course: Build and Update Your Professional Presence in 4 Steps at this page: https://www.linkedin.com/company/4-steps-to-build-update-your-professional-presence

Written by cplysy · Categorized: depictdatastudio

Aug 18 2022

Last Chance to Download – The Reporting Revolution

I think the book is done. Depending on the response, there may be a second book to follow-up this one. But for now, I’m done writing.

In 5 days, on August 23, I will taking the free download offline as I prepare the book for publication. But until that day, you can download the book for free using the following link.

The Reporting Revolution: A little book for researchers and evaluators who give a sh*t.  
Screenshot of the eBook landing page.

Click here to go to the download page.

Here is what’s inside currently as of August 18:

  • Introduction – A Little Story
  • Chapter 1. The Big Why
    • Why are we still reporting like it’s 1999?
    • Our reports tell everyone else a story about our profession.
    • Seeing our work through our audience’s eyes.
    • Unintentional gatekeepers.
    • Mindset change – Noun report to verb report.
    • Not just better, faster too.
    • Make it easy.
  • Chapter 2. Finding Your Audience
    • Who is in your audience?
    • Activity: Naming your Audience
    • Your Big 3 Audiences
    • Activity: Three Bucket Audience
    • The Audience Growth Saturation Point
    • Audience Reach Splash Model
    • Measuring your Audience
    • Audience Building or Serving?
  • Chapter 3. Developing YOUR Modern Reporting Strategy
    • Rule #1 – Everyone is overwhelmed.
    • Activity: The Overwhelmed Reader
    • The Default Reporting Strategy
    • Activity: What is Your Organization’s Reporting Strategy?
    • Towards a Practical Strategy
    • 1:3:25 Strategy
    • Flagship Report Strategy
    • Comprehensive Blog + Social + Email Strategy
    • Audience Borrowing Strategy
    • Email Newsletter Strategy
    • Webinar Series Strategy
    • Learning Community Strategy
    • Creating a YOU Strategy
  • Chapter 4. Building YOUR Report Design Systems
    • The HiPPO Problem
    • Activity: Finding the HiPPO
    • Developing your Design Process
    • Reducing HiPPO Problems
    • The Status Quo Problem
    • The Power of Double Delivering
    • Choosing your Reporting Software Stack
    • Your Modern Software Stack
    • Creating a Simple Style Guide
    • Report Writing, Report Design, and Report Illustration are Three Different Steps
    • Developing an Asset Library
    • Building out Templates
  • fin – A Call to Action
    • If Not You, Then Who?

Written by cplysy · Categorized: freshspectrum

Aug 17 2022

Let’s Build a Partnership

Recently, the Association of Social Work Boards (ASWB) published data on the 2022 pass rate for the ASWB licensing exam. The analysis concluded major disparities in pass rates for Black test takers, older adults, and other marginalized groups. The data were published as a result of years of advocacy and pressure from the National Association […]

The post Let’s Build a Partnership appeared first on Nicole Clark Consulting.

Written by cplysy · Categorized: nicoleclark

Aug 13 2022

Free Resource Library relaunch, now with more cool stuff.

I just relaunched my free resource library, here is what you’ll find inside.

Limited Time Downloads and Events

As of today you’ll only find one time limited download, my in-process book The Reporting Revolution.

This section will change often as some resources I share only stay free for short amount of time. I’ll try to always keep at least one thing in this section, it could be anything from a free course module to an upcoming webinar.

eBooks, Guides, and Cartoons

This is my catch all section for most of my resource downloads. Currently it includes the following:

  • UX Evaluation [PDF]
  • Virtual Community Building 101 [PDF]
  • How to create a basic logic model [PDF]
  • A Quick Guide to using Zoom [PDF]
  • Evaluation Presentation Favorites [PowerPoint]
  • Finish the Cartoon: Engaging Stakeholders [PowerPoint]
  • Evaluation Illustrated Full Cartoon Collection [Dropbox Folder]

The Evaluation Illustrated Cartoon Collection is newly shared. Originally you would have had to buy the book to get full access. Now you can get access to downloadable copies of all 114 cartoons for free.

Free Courses

Right now I only have one free course but I do have a couple others in mind.

YouTube Channel & Tutorial Links

I have my recent tutorial posts listed out by category (i.e. Excel, Canva, Evaluation) you’ll also find a link to my YouTube channel which features videos not always shared on this site.

Enjoy!

Use this link to check it all out.

And please feel free to share with your friends!

Written by cplysy · Categorized: freshspectrum

Aug 09 2022

Principles: Evaluation, Strategy and More

Over at our sister site (Censemaking), we are publishing a series on Principles-Focused Evaluation. The series is looking at the basic building blocks that underpin the approach and will describe how to use it.

We will be posting some additional materials here at a later date.

But before one starts out using principles, it’s essential to understand what they are and why they matter.

Principles in Practice

When we look at principles in practice we first need to look at the definition of the term.

PrincipleDownload

As we can see from above, principles are guides for conduct. They are touchstones that can inform planning and action in the face of uncertainty. If we were sure about causes and consequences, we could rely on rules. When we are uncertain, principles will have to do.

Principles are also evaluable.

Michael Quinn Patton has riffed on this role of principles in his GUIDE Framework for Principles-focused Evaluation.

As Patton writes on Principles-Focused Evaluation,

Principles-focused evaluation examines (1) whether principles are clear, meaningful, and actionable, and if so, (2) whether they are actually being followed and, if so, (3) whether they are leading to desired results.  Principles are derived from experience, expertise, values, and research.

Principles, Values and Strategy

Principles reflect our values. Values are about what has meaning for us, what we invest in, and subsequently, what has value. That is why we can evaluate good principles.

The first step in developing principles is determining what you value.

The second step is determining your values. Values are the beliefs we hold that guide our actions and shape our identity.

Thirdly, connect the two; this is strategy.

Drawing on the GUIDE framework above, consider reflecting on what you value, your values, and how (or if) they are connected. We work with many organizations with a gap between their stated values and desires and their actions. Much of our work is on closing this gap with our clients. The reasons are often that we let our environment shape our actions without connecting them to values or value.

We find many clients do things with low value yet are a product of legacy systems in place to accomplish something else. By clarifying our values and determining what has value, we can change this by design.

This is what strategic design is all about.

So now you know why principles, strategy, and design are all related.

If this is something that you want help in doing, let’s talk. This is what we do.

Photo by Amrit Sangar on Unsplash

The post Principles: Evaluation, Strategy and More appeared first on Cense Ltd. .

Written by cplysy · Categorized: cameronnorman

  • « Go to Previous Page
  • Go to page 1
  • Interim pages omitted …
  • Go to page 118
  • Go to page 119
  • Go to page 120
  • Go to page 121
  • Go to page 122
  • Interim pages omitted …
  • Go to page 304
  • Go to Next Page »

Footer

Follow our Work

The easiest way to stay connected to our work is to join our newsletter. You’ll get updates on projects, learn about new events, and hear stories from those evaluators whom the field continues to actively exclude and erase.

Get Updates

Want to take further action or join a pod? Click here to learn more.

Copyright © 2026 · The May 13 Group · Log in

en English
af Afrikaanssq Shqipam አማርኛar العربيةhy Հայերենaz Azərbaycan dilieu Euskarabe Беларуская моваbn বাংলাbs Bosanskibg Българскиca Catalàceb Cebuanony Chichewazh-CN 简体中文zh-TW 繁體中文co Corsuhr Hrvatskics Čeština‎da Dansknl Nederlandsen Englisheo Esperantoet Eestitl Filipinofi Suomifr Françaisfy Fryskgl Galegoka ქართულიde Deutschel Ελληνικάgu ગુજરાતીht Kreyol ayisyenha Harshen Hausahaw Ōlelo Hawaiʻiiw עִבְרִיתhi हिन्दीhmn Hmonghu Magyaris Íslenskaig Igboid Bahasa Indonesiaga Gaeilgeit Italianoja 日本語jw Basa Jawakn ಕನ್ನಡkk Қазақ тіліkm ភាសាខ្មែរko 한국어ku كوردی‎ky Кыргызчаlo ພາສາລາວla Latinlv Latviešu valodalt Lietuvių kalbalb Lëtzebuergeschmk Македонски јазикmg Malagasyms Bahasa Melayuml മലയാളംmt Maltesemi Te Reo Māorimr मराठीmn Монголmy ဗမာစာne नेपालीno Norsk bokmålps پښتوfa فارسیpl Polskipt Portuguêspa ਪੰਜਾਬੀro Românăru Русскийsm Samoangd Gàidhligsr Српски језикst Sesothosn Shonasd سنڌيsi සිංහලsk Slovenčinasl Slovenščinaso Afsoomaalies Españolsu Basa Sundasw Kiswahilisv Svenskatg Тоҷикӣta தமிழ்te తెలుగుth ไทยtr Türkçeuk Українськаur اردوuz O‘zbekchavi Tiếng Việtcy Cymraegxh isiXhosayi יידישyo Yorùbázu Zulu