• Skip to main content
  • Skip to footer
  • Home

The May 13 Group

the next day for evaluation

  • Get Involved
  • Our Work
  • About Us
You are here: Home / Archives for allblogs / depictdatastudio

depictdatastudio

Oct 24 2024

How to Put Numbers AND Percentages in Graph Labels in Excel

Want to put both the numbers and the percentages inside your Excel graph’s labels, like this?

Text boxes are clunky and time-consuming.

Instead, we’ll create Helper Cells with concatenated values.

What’s Inside

  • 0:00 Intro
  • 0:33 Dataviz On The Go
  • 0:42 Why not text boxes??
  • 1:42 Pie example
  • 5:42 Donut example
  • 7:42 Bar example
  • 12:28 Advanced: Nested IF with left, mid, right
  • 14:42 Your turn

Materials

Download the Excel file: https://depictdatastudio.ck.page/numbersandpercentagesingraphlabels

Transcript

Ann K. Emery: [00:00:00] How do you put numbers and percentages inside your graph labels? In this video, you’re going to learn how to do this.
We’re going to go through two different workarounds, three different chart types, so you’ll know how to do this for pies, for donuts, for bar charts.
And you can also download the Excel file that I’m using. Just look below the video, you’ll see a link to download it for free. Obviously, you’re going to learn more if you follow along with me and you do it yourself, that’s going to be way better than just watching me do it, which would be really boring too.
I’m Ann Emery. You’re watching Dataviz On The Go, the series where you learn dataviz time savers inside everyday software like Excel.
And speaking of being on the go, I was in South Africa just a few days ago teaching dataviz and one of the participants there raised his hand and he was like, Ann, How do I add the numbers and the percentages inside my chart labels? And I walked over to his laptop and he showed me a [00:01:00] column chart that he had.
It had about 10 different columns going across and he had numbers and percentages and I was like, you already did it. What do I need to help you with? And he was like, well, but then it was text boxes manually put on each of those 10 columns, which must’ve taken him like 10 minutes to do, right? That’s way too much time.
Um, he was explaining how. When he updated the data each month, the text box location didn’t change with the height of the column. So he had to manually adjust the placement and that’s way too much work. So I’m not going to show you how to do this with text boxes. I’m going to show you the better way behind the scenes.
It involves a little bit of a learning curve, but I guarantee you in the long run, it’s going to be way faster. All right. Open up your Excel file if you haven’t already, and let’s go through each of these chart types together. So what you’re going to do along with me is you’re going to highlight the gray section of the table.
It’s a little counterintuitive. You might be tempted to highlight the numbers and the percents. [00:02:00] We’re just going to do the numbers. You’re going to go to Insert, and we’re going to add a 2D pie chart. Okay. These are the default settings that Microsoft gives us, and we’re going to make it look like this one over here.
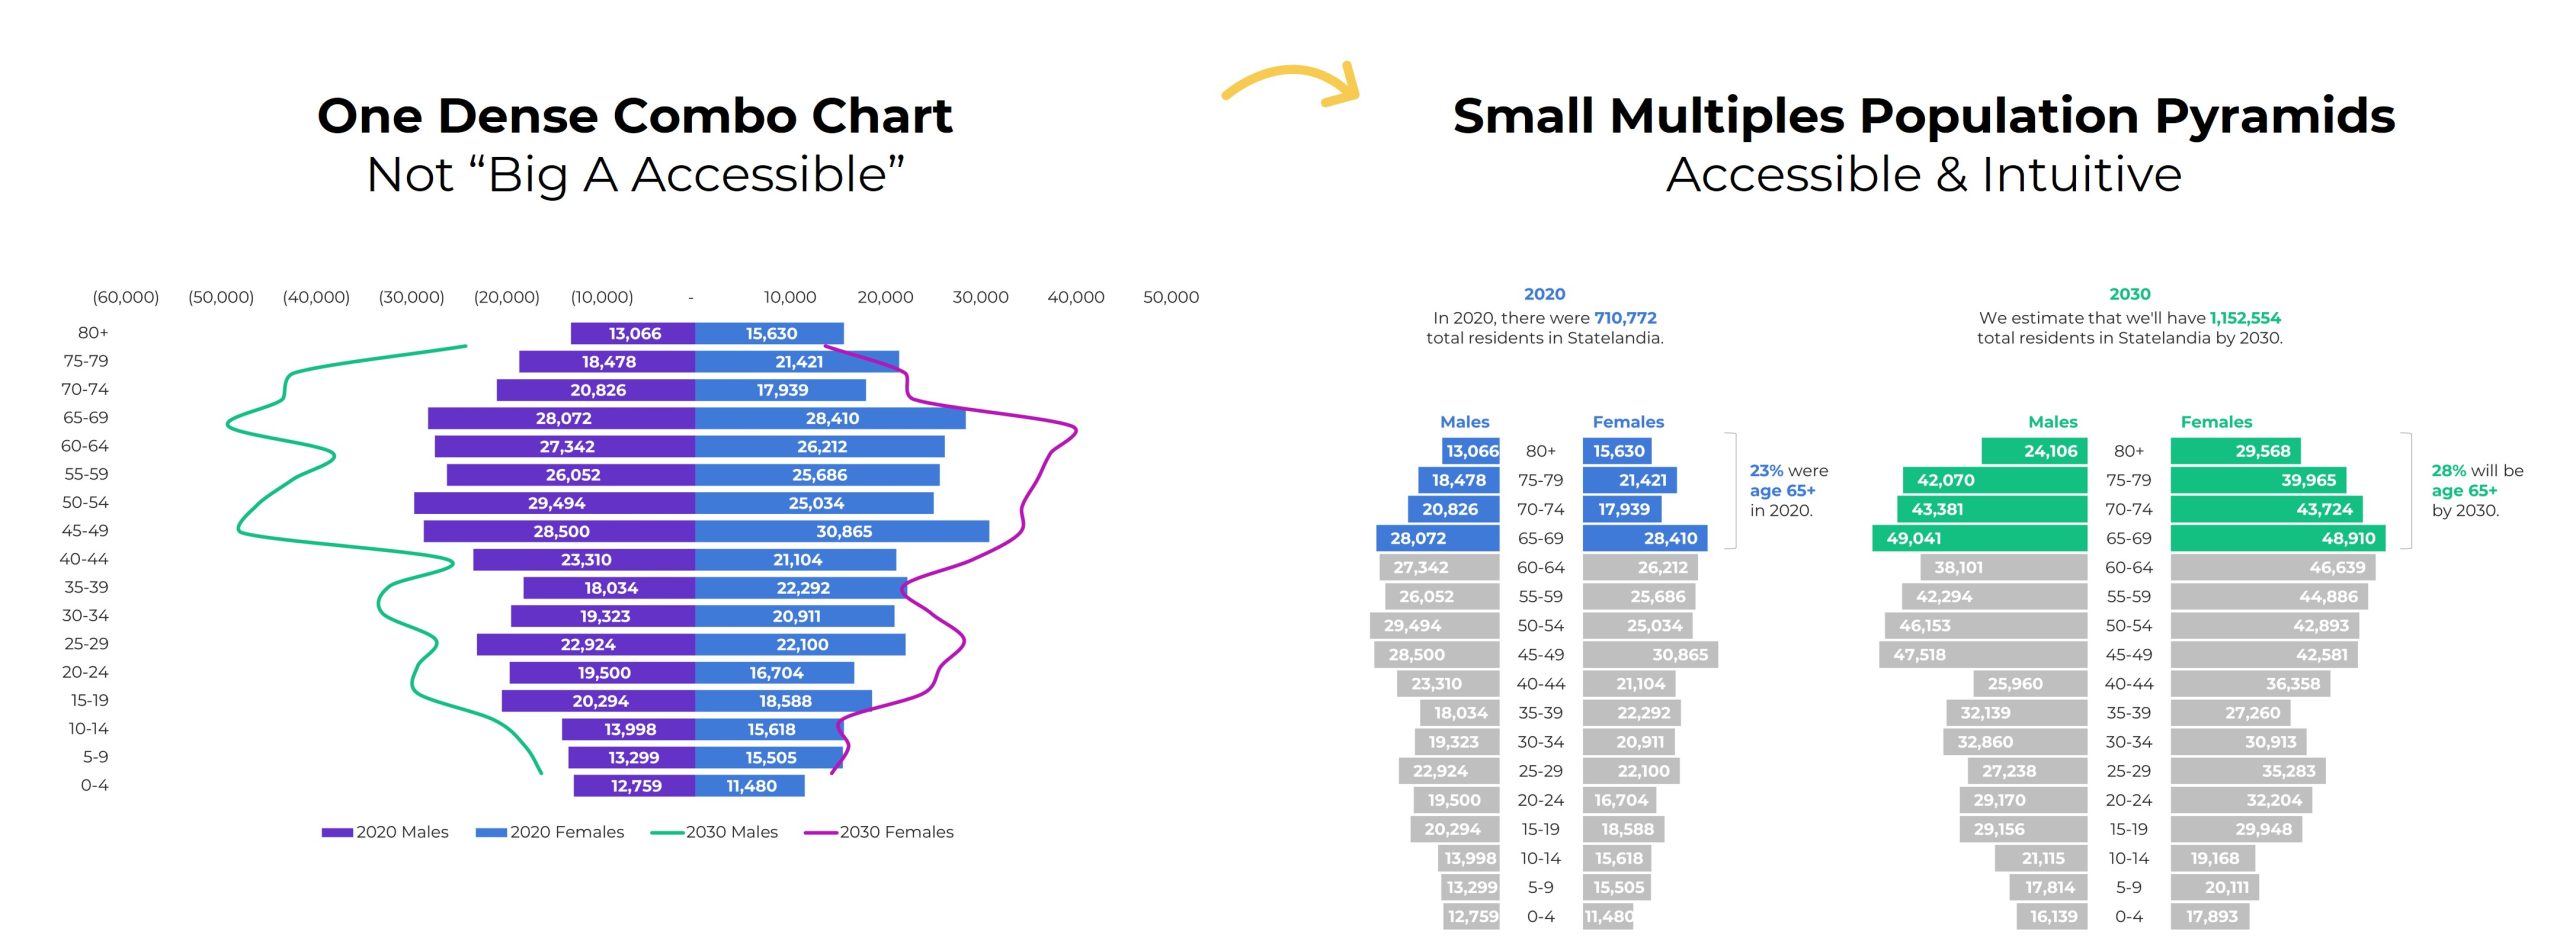
If you have questions about big A accessibility or little A accessibility, just comment below the video and I will certainly point you in the right direction. I have hundreds of blog posts and YouTube videos and conference presentations all about accessibility in dataviz. This video is just about the labels, so I’m going to try to hold back from talking too much about the formatting and just show you the number percentage combo here.
Okay, so how you do this is you click on any one of the pie slices here, do a right click, add data labels. Then you click on the labels, any one of them, right click, [00:03:00] format data labels. Labels are kind of annoying because you have to add them and then you have to format them. It’s not my choice. That’s just how it is.
It feels like a little more work though, doesn’t it? Right? Add format. When you click format, it’s going to pull up the sidebar and you’re just going to click the percentage box. That’s basically it. The value, a number in this case, and the percentage. There are a few more formatting things that you’re probably going to want to do while we’re in here.
For example, you can add the category name. Okay. So it looks like We’re not going to do the iZigZag, which is also not colorblind friendly or grayscale friendly. We don’t do legends in dataviz. I’m going to delete this built in chart title for now. Okay, it’s getting a little closer to the model right here.
And let me go back to that format menu. We did category, we did value, we did percentage. I’m going to uncheck leader lines. Those [00:04:00] are little gray connecting lines that show up sometimes if you manually drag the label too far away, they just add clutter. I’m going to delete those. The separator. Right now, it’s category, comma, number, comma, percentage.
I’m going to do new line. And the label position, I’m going to put outside end. You might have to manually drag things just a little bit, like maybe you’d have to shrink down your pie chart. Here I am showing you all the edits when I promised myself I wouldn’t, but I didn’t want this one to be cut off, right?
Okay, and then the final thing you might want to do is maybe you make the word Colored and bold. So how you do that, I’ll zoom in to make sure you can see exactly where I’m clicking, cause it’s really small, right? When you click on the label, it looks like nothing happened. You kind of have to like click a couple of times and then depending on where your mouse is, a different section is going to be dark gray.
Can you see that? It’s just, it’s such a slight difference, like a medium gray [00:05:00] versus a light gray. Do you see that? You like, right? The one that’s a little bit darker. So the one that’s a little bit darker, the category label, you can, you have to like, Oh, it’s so hard to click on the right spot. You have to highlight it, highlight the word you have, and then you can make just the word colored.
To match the slice it corresponds to, right? To remove guesswork. And colored font should be bold to make sure it passes accessibility standards. You go through it again, right? Double click on just that first one. Highlight it. That one’s gonna be that second theme color. And bold, etc, etc. Same thing on donut charts.
Okay. Scroll down on your spreadsheet. Let’s practice this again so that it feels more fluent for you. You highlight just the number, you go to insert, you pick out your chart type. Let’s do a 2D donut. If you highlight percentage, if you’re like, duh, [00:06:00] I’ll just do it this way. I’m just going to do it better or something or different.
Um, it’s not going to work. It’s going to show you this nested donut where it has the numbers and then the percentages. And that’s weird. Why would you want your chart to look like that? Okay. We don’t want that. We want just a regular old donut chart. That’s how you highlight just the numbers. You’re going to add the labels and then format them.
So you click on the slices or wedges of the donut, right click, add, click on the labels, right click, format, very similar menu as before. Click category. You’ve got value already. Click percentage, uncheck leader lines, change the separator. We’ll do new line and then Can you place them outside? No, you can’t.
Isn’t that annoying? So you have to manually Right. There’s not the position or location section down here. I just manually drag them, you know, just like a little bit [00:07:00] kind of over here. And then sometimes I get frustrated that this takes a while, but it takes about this long. Delete this part. You’d make it colored, probably delete this, et cetera.
Right. There’s a little bit more formatting to do. You might have to like, I just can’t help but format this for you. Anyway, that’s why I have the completed version. So you can see up to Ann Emery standards, what it should look like. So, pies and donuts. Pretty easy, right? You add the labels, you format them, and you look for the little square checkbox that says percentage.
Pretty darn easy, behind the scenes. Bar charts. They’re a little bit different. We need the second workaround for these. So, for bar charts, we are going to highlight the gray area Just like before, go to insert. This should look familiar, right? Let’s add a 2D bar chart like this, but we want it to look like the number and the [00:08:00] percent.
We can try, we can try the same thing. It’s not going to work, right? Click on the bars, right click, add data labels. Click on the labels. Right click. Format. Where’s the percentage checkbox? It’s not there. That percentage checkbox is only there for pies and donuts. It’s not there for bar charts and a bunch of other chart types.
So we have to use that second workaround. And the workaround is gonna be Helper cells.
We are going to type in exactly what we want here and then whatever is sitting in these cells is going to feed in here. Okay.
Just for kicks, I’ll show you what, uh, what these do. Click on your labels, right click, format. Pulls up the window. Value from cells. This is one of my [00:09:00] favorite boxes. Click that. Ignore this little pop up for a second. All you do is you highlight your helper cells, you click okay, and it shows you the helper cells, comma, the value.
So here is hi at the top of the table, that is hi down there, right? Here is I’m and there’s I’m down there and the value. But you wouldn’t keep this, you would do a little more formatting of course, like you would just remove the value and the leader lines. You can type in whatever there. And it feeds into the label.
Isn’t that nice? So if you want number percent, should I show you the long way? Uh, I’ll show you the long way. And then the short way you could manually, this is a long way. You could manually type in. Uh, this, and then it shows up right there. Whatever’s in the helper cell [00:10:00] goes over there. Now, am I going to tell you to manually type stuff in?
Absolutely not. Absolutely not. You’re going to do a concatenation. You’re going to say equals this and. This ampersand, it is really smushed. It’s the number smush the percent altogether. It’s two, two, four, two, and then it’s 0. 384. It’s all these digits from this division, right? From the numerator and denominator living here behind the scenes.
So you go back in and edit this. If you’ve seen concatenation before, you know how to do this, right? If you’re new to concatenation. Welcome. Hopefully this opens up a whole new world for you of formatting control that you have for your dataviz behind the scenes. Formatting for this would be like, um, what would we have to do?
The number and, uh, quotes. Open parentheses, whoops, quotes, space, open [00:11:00] parentheses, quotes, and the B61 and C61, those are specific locations. Those do not get quotes, but everything else does get quotes. So if I want space, open parentheses, it has to have double quotes around it. And then everything’s just separated by the ampersand, okay?
Number, space, parentheses, percent. It’s not going to be perfect, but we’re getting closer. Number space, open parentheses percent. And you just go back through and you edit it again and again. So let’s add this, uh, let’s do a times a hundred and then we’re going to round this to a decimal place and we’re going to add what else?
Percentage symbol, closing parentheses. Okay, we’re getting closer and closer. Because I do this for a living and I’m very, very picky about my graph labels, I would also go through and do [00:12:00] one more layer of editing where I add the comma, the thousands separator comma, and I would do that using a nested if and left mid and right.
But, That really deserves another video. If you want though, you can look in this answer key and the formula that you’re going to see is going to be much longer because I have nested if and left mid right. Okay. What if, speaking of if, uh, another variation would be what if you have like a Big digits, right?
Like these are little digits, three and four digit numbers. If you have big, big, big digits, like currency, I work on a lot of grant making projects with foundations. They have things like project amounts and they’re often in the millions or tens of millions, sometimes. Same idea where you’d add some helper cells.
This is actually, here’s a really long, there’s, this [00:13:00] nested, if left, mid, right. It gets a lot longer. And the same idea, you could just highlight, insert your bar chart. Does this look familiar now? That’s why I want to show it to you twice. Add the labels, right click, whoops, got to click on them, right click, format, value from cells, select the helper cells you would have made.
Okay, uncheck, uncheck value, uncheck leader lines, and then you do a little bit more formatting so it would look something like this. One downside to using concatenated helper cells is the labels are all the same format. So you can’t make just the number bold and purple or just the percentage. It’s all or nothing.
Um, so I, I don’t love that, but you know, it’s like that, of course there are variations of this, right? Like if you have like really, really, really big numbers, things [00:14:00] like in the millions, you could also write longer formulas, if statements with left, mid and right, so that something like 123 just says 123 K or millions might say 1.
27 M for million. And then your finished version could look, you know, something like this, right? It’s really, really hard to do that, uh, with text boxes. It’s really clunky. You might make typos. You have to manually adjust it all the time. And you can’t just right click and check, check the percentage box.
So I hope that the concatenation, even though there’s a little bit of a learning curve, I think it’s going to save you a lot of time in the end. All right, it’s your turn. Let me know what types of questions you run into. Let me know if you apply it and how this works in your data set.

Written by cplysy · Categorized: depictdatastudio

Oct 15 2024

Why Isn’t My Map Working?!? 10 Excel Troubleshooting Tips

I have a love-hate relationship with maps in Excel…

Pros of Excel Maps

  • If you’re only making maps once in a while (i.e., you’re not a full-time cartographer), Excel maps are great because you don’t have to purchase/download/install/learn any specialty mapping software.
  • Fast to make. Get started here: https://depictdatastudio.com/how-to-make-maps-in-excel-file-to-download/
  • Works in Excel, PowerPoint, and Word (so it’s easy to copy/paste maps between those Microsoft programs, too).
  • Easy to add your own branding (with Theme Colors and Theme Fonts).

Cons of Excel Maps

  • Excel only makes heat maps by default (a.k.a. filled maps, choropleth maps). With behind-the-scenes tricks, you can also make hex maps, tile grid maps, tile grid trendline maps, and more.
  • Currently only works with Microsoft 365. Time to upgrade, if you haven’t yet.
  • Stickwithitness required. These work best for high-level U.S. maps (e.g., states). The smaller the geography (counties, zip codes), the more troubleshooting required. Making non-U.S. maps? Even more troubleshooting required. You’ve been warned. If you’re not tenacious, turn back now.

Can I Make Excel Maps for Places Outside the U.S.?

Yes!!!

When I was teaching data visualization workshops in South Africa, a woman from Eswatini asked whether she could map her country’s four regions.

After class, I attempted to make a quick YouTube video from my hotel room. I was planning to create a table with some pretend numbers… highlight those values… and insert a map.

And then I ran into all sorts of problems! Boo, Excel. I lost an hour to troubleshooting. I watched other YouTube videos. I read help forums. Here’s what I found.

10 Troubleshooting Tips for Excel Maps

In this video, you’ll learn the top 10 ways that Excel maps can get messed up.

Do you have more tips? Please comment and let us know.

What’s Inside

  • 0:00 Intro
  • 1:10 Dataviz On The Go
  • 2:16 Making a new map – What didn’t work
  • 2:56 (1) Make sure you’re on good internet
  • 3:38 (2) Convert to Geography (or not)
  • 5:20 (3) Make sure your headers are (correctly) labeled
  • 6:02 (4) Convert to an Excel Table
  • 6:45 (5) Spelling
  • 7:13 (6) Leading or trailing spaces
  • 7:54 (7) Special characters
  • 8:19 (8) Add higher-level geographic details in a column(s) to the left
  • 9:35 (9) Check alternative/former names
  • 10:06 (10) Check language translations (e.g., both English and siSwati spellings)
  • 10:30 Repeating the 10 troubleshooting tips
  • 13:46 Your turn
  • 14:13 Personal note from Ann

Download the Excel File

It’s here: https://depictdatastudio.ck.page/troubleshootingmapsinexcel

Read the Transcript

Ann K. Emery: [00:00:00] This video is turning out to be a hot mess. It was supposed to be a video like “Yes, you can make non US maps in Excel.” I made a YouTube video a while back, I’ll link to it right here. And it was about making maps in Excel. If you’re new to maps, you can watch that one first. It’s a great getting started video.

I had a US example. People commented like, “can I make non US maps?” Yes, you can. It was supposed to be that video, but then I ran into all sorts of issues. And this has turned into a, “I lost an hour of my life troubleshooting, so you don’t have to” video. And I’m going to show you 10 different things that I had to try to get this map to work.

And you’re going to just go through each of these items methodically with your map. And then at the end, please comment and tell me what the fix was. And hopefully we’ll all learn from each other.

I have a love hate relationship with Excel maps, as you [00:01:00] might be able to tell from, uh, my tone. I’m a little bit frustrated at the moment with how much troubleshooting we have to do sometimes.

So hopefully this video will just, you know, speed it up for everybody.

And by the way, if you’re new here, I’m Anne Emery. You’re watching Dataviz on the go. And I’m here in Johannesburg. Did I say that? I’m teaching a two day class and one of the women in the class, she was based in Eswatini, which you might know as Swaziland.

We had people from all different African countries in my class and we were making some maps and she raised her hand and she was like, “can I make maps for my country for the four regions of Eswatini in Excel?” and I was like, “yeah, of course.” And that’s the video this was supposed to be, right. Of, uh, making the Eswatini regions.

But I’m going to show you what I tried and what didn’t work. Right here. Okay. And then we’re going to create this “after” table. We’re going to have to reformat the table and I’m going to go [00:02:00] through these 10 troubleshooting tips, in order, of most common through least common. So please go in order as you’re troubleshooting and obviously let me know if there’s a number 11 or number 12 on this list

that you have to try that works for you.

All right. First up, here’s what didn’t work, right? You’re supposed to enter your regions. In this case, enter your values, which can be numbers. It can be, these are just made up percentages. It can be currency. Okay. You’re supposed to. So just highlight your table, go to insert, go to the map section and add a filled map, aka heat map, color coded map, choropleth map.

But of course Excel panics right away and it’s like, “uh, uh, uh, you have to have geographic data.” No big deal. We can do that, among many, many other things.

Oh, and I should mention when I was teaching this class in the [00:03:00] conference room, we did have internet, but it was like, you know, how event internet is. It was awful.

So I actually didn’t even get this far. We got stuck on. Cause I was like, “Hey. Mirela, like, come here. I made the map for you.” I was going to do that during the break in class, but we couldn’t because I wasn’t on good enough internet. And here in the hotel, I’m on like, iffy, iffy. It’s not perfect, right?

You’re not gonna be able to make maps from your airplane Wi Fi. From your public Wi Fi at the coffee shop that comes in and out, you have to have good enough Wi Fi. Okay, so earlier, number one didn’t even work.

We’re on number two now, which I expected to happen. We are going to convert to geography. Or not.

Okay. I’ll show you what both of these mean later. So let’s create the “after” table. I’m going to highlight these regions. I’m going to go actually, let me delete this one, right? Cause I want it to link to this. I want it to link to this revamped table I’m going [00:04:00] to make. This is a little hard to do with my one hand, but I got to hold my mini mic.

So you don’t get all the Background noises from the hotel. All right, where were we? Let’s convert these to geography. I’m going to highlight these regions, go to data, go to the little data types down arrow, say geography, please. It goes and connects to Bing maps and comes back down. So it takes a second to do right.

And now we have a map of the four regions. Except now we also have a new issue. We have this little caution sign, which when we click on, it tells us, sorry, we plotted 75 percent of your locations correctly. And you can see the three out of four, and this one is gray. Gray means like something was wrong with it, right?

There wasn’t any data. It tells us with the hover over, there’s no data. And I was like, but there is data there because even when you hover over the [00:05:00] little card and you can see that’s that region there’s data. So then I spent the rest of my hour, my agonizing hour, figuring out all these other things, watching other YouTube videos, reading blog posts and articles, reading help forums where Microsoft staff had responded.

One of the things that came up in a lot of help forum articles was to make sure your headers are labeled, and correctly labeled. That means if you don’t have the word Region here, you might run into issues. If you don’t have some type of column header here, you might run into issues. These words feed into the legend over here.

So if you don’t have it, you might get a error message, but it also just gives you a really poorly labeled legend. So you need to have some words there and they need to be correctly labeled. Like you can’t say that this is a country, but then it’s regions. It has… Obviously, [00:06:00] right? It’s gotta be correct.

Number four, I tried a good old fashioned Excel trick. I tried converting to an Excel table. This is a regular table, a generic table, a lowercase T table. A lot of times Excel tables can solve issues with pivot tables, pivot charts, slicers, so I thought, let me try. The, the trusty fixes, right? What you would do is you’d highlight your lowercase T table.

You go to insert. Here’s the official table. Yes, it has headers like we just talked about. Click okay. And. That, that doesn’t fix anything, right? Same issue with the map. Let me make sure you can read these.

All right. Number five, let’s try some spelling. I was not familiar with these regions before a few hours ago.

So I checked and double and triple checked all the spellings, against what the participants were saying, told me, and wrote for me, [00:07:00] against Wikipedia. I looked at all the websites to make sure that they were spelled correctly. They were. I copied and pasted them from the internet rather than even typing them in.

That wasn’t the case. I checked number six, because I copied and pasted them. I checked for leading or trailing spaces. I don’t visually see any leading or trailing spaces, but I thought let’s check everything Uncover every stone, right? A trailing space would be if you’re typing in or copying and pasting and you accidentally have a space that can cause a lot of issues in Excel and with formulas.

I’m thinking of lookup formulas that rely on exact matches with spaces. Sometimes if you copy paste, or if you download your data from a database or external source, you might have a leading space. I checked them all, that, that was not the issue. I checked for special characters. I’m thinking of Spanish speaking countries [00:08:00] where the names might have accents or they might have the little squiggle over the N.

A lot of different languages other than English have special characters. So you’re going to try with and without to see which one kind of, uh, jiggles Excel correctly, like shakes it so that it works. Not the case here.

Um, number eight, I saw this one on a lot of official Microsoft forums as well. Staff were saying, try adding higher level geographic details, which would go in a column off to the left.

Higher level geographic details are things like this. We’re going to add country so that just to make sure Excel knows we’re talking about Eswatini. So you’re going to type in your header, obviously, and then you just repeat the country name

all the way down. Not just once, right? So that it, it knows these are regions within East Swatini. This is important because a lot of [00:09:00] names are multiple places in the world. So I live in Windermere, Florida, but there’s Windermere, England. There’s a Windermere in Johannesburg. There’s lots of Windermere’s around the world.

So I can’t just make a map of Windermere. I would need to tell Excel, this is the Florida version, right? So I thought maybe these may, who knows, right? Maybe that’s the case.

I also mixed and matched. All of these troubleshooting tips. I thought, well, maybe this has to be converted to geography. Um, but we’re still, this one’s still gray, right? So I’m trying all the things.

Uh, number nine, check alternative or former names. The participant was like, “try Swaziland.” So I tried that.

When I press enter, watch what Excel does. It thinks for a split second, and then it says, nope. It’s Eswatini now, so you’re going to try things like that. Countries and [00:10:00] regions and districts and provinces, they change names. So give it a try.

And then number 10, you’re going to check for language translations. For example, um, Eswatini has two official languages. So I thought maybe the spelling is different of these regions in the two official languages, but that is the name. That is the one name of the region. There’s not like an English version or something, you know, so you’re trying all the different non US, non English things.

Then I got really frustrated and I thought, “this was supposed to take five minutes to make and record this YouTube video.” And here I am an hour into troubleshooting. I should be at dinner. I should be on the hotel treadmill, getting my 10, 000 steps in. Those are the things that I’m gonna do if everything works, any minute now.

And I said, “okay, come on, Ann, come on, brain, you can do it.”

And I went methodically down the list again, I kid you not.

So I started at the top again. I checked the internet. I [00:11:00] disconnected. I reconnected. Everything was fine. I can see my little wifi symbol at the moment is totally fine.

I tried converting to geography or not. I tried, uh, re, I tried like copying and pasting these in. To unregion it, uh, you can see that that doesn’t work. That makes it worse.

I made sure my headers are correctly labeled. I thought, I thought, and then I saw another help forum with somebody actually making a map of South Africa and they ran into the issue where,

oh, what was it? It was like they were supposed to plot provinces, but they used the word district. Or it was supposed to be district, and they used the word provinces. The naming was wrong, and the person like hadn’t realized. Or the data set they got was wrong, or something. So I thought, well, I think these are supposed to be regions.

The woman from Eswatini said they’re regions. The map [00:12:00] card says region. Online, it says there are four regions. The word region was very clear, but I was like, I don’t know, for kicks, let me try all the names, you know, so

I know they’re not states. These are not U. S. states, but I thought, let me try that.

Let me try province.

Let me try something more generic, like, what… I considered Guatemala has departments. Let me try district, because I was thinking of that South Africa help forum.

And earlier district had worked. And then I was like, I got it to work once with district, what’s going on? So this is where it gets wild.

And I was like, let me just start at the top of the list and I’ll just go back down again.

So I tried unconverting these to geography and finally, finally it worked.

I have no idea why. Okay, so to [00:13:00] recap. These are regions. Everybody says they’re regions. Everybody online says they’re regions. Microsoft on the little cards thought they were regions, but for the map to work, I can’t say region. It has to say district.

Typically maps have to typically have the convert to geography. It has to be like categorized as it’s, this isn’t a percentage. This isn’t a text field. It’s not a date. It’s geography. Not the case here. Now everything is correctly filled in. You hover over it. It knows what that region name is. The moral of this video is keep trying.

Just go from the top and let it back down. Try every little combination you possibly can. And then most importantly, please comment below the video. Let me know if you have troubleshooting tip 10 million that you’ve tried.

Let me know where you get stuck.

Let me know what works for you.

I can’t [00:14:00] wait to read through your comments because I know we’re all going to help each other so that we don’t get so frustrated. We can speed this up a little bit more.

Thank you so much in advance for your help in the comments.

Hey, future Ann here. I got my steps in, I had a steak, and now I’m no longer stressed. Funny how that works. And now I’m going to bed. Good night.

Written by cplysy · Categorized: depictdatastudio

Oct 01 2024

How to Make Dumbbell Dot Plots in Excel

Ready for a brain-bending tutorial?

It’s *not* easy to make dot plots in Excel.

These are non-native charts — meaning we’ll have to reconfigure our table, and use a scatter plot(!) — to trick Excel into making our dot plot.

The learning curve is worth it, promise.

Download the Excel File

It’s here: https://depictdatastudio.ck.page/dumb…

What’s Inside

  • 0:00 How to Make Dumbbell Dot Plots in Excel
  • 0:25 Dataviz On The Go
  • 0:33 Dot Plots are Non-Native Charts
  • 1:03 It’s a Scatterplot (?!?!)
  • 1:50 Pep Talk for the Perfectionists
  • 3:23 Live Drawing Demo
  • 6:59 Color-Code Your Table
  • 7:08 Stack Your Table
  • 7:43 Add “Y” Values
  • 8:28 Sort and Put the “Y’s” Next to Each Other
  • 9:09 Insert a Scatterplot with Straight Lines and Markers
  • 9:45 Ack!
  • 9:52 Remove the Lightning Bolt
  • 11:02 Format Format Format
  • 11:46 Your Turn: Questions? Comments?
  • 12:05 A Personal Note

Transcript

[00:00:00] In this tutorial, I’m going to try to teach you how to make dumbbell dot plots in Excel.

I say “try” because, usually, in workshops, this takes about 30 minutes to teach, and everybody’s got laptops, and I demo a skill, and they practice, and I demo, and they practice, and it’s a captive audience.

On YouTube, everybody wants things really, really quickly, and I don’t know if I can cram this into five minutes.

… … , we might need 10, though.

You’re watching Dataviz on the Go with me, Ann Emery. Because you’re busy, I’m busy, let’s get to it with some jet speed tutorials.

Now, the first thing you’re going to notice about dumbbell dot plots is, when you highlight your table and you go up to insert, just like you normally would to add a new chart, you can look all day long…

You are not going to find a dumbbell dot plot up there. It is not here. It is not here. It’s not there.

It is not a built in chart. It is not a native chart. It’s a non native chart.

That doesn’t mean we can’t make it, but we have to do some behind the [00:01:00] scenes magic tricks to make it happen.

So we’re going to choose a similar chart, similar ish, kind, kind of, kind of not, right?

The scatterplot, the scatterplot especially with the straight connecting lines. We’re going to use a scatterplot as the foundation. And we’re going to disguise it and make it look like a dot plot.

This is a very advanced, very sophisticated, very brain bending way of thinking about Excel. It’s a scatterplot that looks like a dot plot.

So what that’s going to mean is we have to assign each of these dots X, Y coordinates, which means our table, like this, It’s going to have to be totally reconfigured and that’s going to be a little bit tricky to figure out, but that’s why I’m here to walk you through it.

So if you’re a perfectionist, please go easy on yourself. Just give yourself a break. There is a learning curve here. This is not an easy chart type at all, but it’s worth it. I [00:02:00] just, please keep going. Please, please, please.

And if you’re tired, like I clearly am just scroll down below the video, because I’m going to give you this spreadsheet with the template that I’m using so you can just download it and just punch in your numbers and not have to start from scratch. So you don’t have to fight with Excel so much.

All right, let’s keep going. Let’s transform our original table into a magic reconfigured table.

The first thing we’ve got to do though, especially the first few times you’re doing this is You’ve got to sketch it, please, please don’t skip this step. You need to draw out your dot plot and figure out where each dot’s going to go so that later as you’re making it, you can compare and say, “wait, is this in the right spot?””

No, I need to sort my table different.” “Wait, I think this is going wrong.” And you can kind of diagnose your own errors that are going on as you’re learning.

So I’m going to use my draw feature on my computer, but you might just use a good old paper and pencil when you draw your dot plots.

Okay, so let’s draw this out and I’m going to show you how it’s [00:03:00] a scatter plot with XY coordinates, that is ultimately gonna look like a dot plot.

Okay? That’s the most important thing for you to remember. It’s a scatter plot that looks like a dot plot. And then the other thing is just draw it. Please. Please,

Alright, let’s draw it. So first we’re gonna draw our xy. Okay, this looks like eighth grade math class, doesn’t it?

Here’s our x, y, x, y coordinates. That’s what a scatterplot has going on behind the scenes. Then you’re going to draw your scale.

This fictional scale goes from, uh, zero to ten. Yours in real life might go from zero to ten million. It might have percentages. It might have currency. This works with all the units. It doesn’t have to be zero to 10. It can be whatever your real life units are.

And then the height, uh, these are gonna be our categories that we’re comparing. We’re going to have category [00:04:00] A, B, C, D. I’m going to draw some grid lines in here. That’s why I’m using gray. And then let’s figure out where our dots go.

And remember, um, we’re just, I’m just drawing this. Okay. I’ve already made the finished version to show you where we’re heading, but in real life, you’d be like, what, where, what is this going to look like with my numbers and my percentages?

Okay. And let’s be consistent. Um, I think, what do I have group one in green? Yeah. Let’s always do group one in green. Let’s always do group two in purple. We’re going to use Mardi Gras colors. Why not? Why not? Consistent color coding absolutely is going to help your brain to figure this out. So please do this as you’re sketching on your own paper.

Uh, group one, let’s do those in green. Group two, we’ll do in purple.

Let’s draw out our dots and then we’re going to assign them X, Y coordinates. So that first 8. 1, where is that going to [00:05:00] go? It’s going to go over on the X, 8. And then it’s, it’s the A, so it’s going to go right here. Okay. That’s that dot and let’s assign it an XY coordinate. So that is eight.

What is it? 8. 1. That’s my X comma, the Y. is, it goes up, one, two, three, four. Let me write that out for you just to make it really easy to follow. One, two, three, four. It’s very hard to write with a mouse. 8. 1 comma four. Okay, the next one 5. 6 that goes over on the X about this far, but that’s about where the 5.

6 would be. And then it goes, that’s 5. 6. It goes up on our, [00:06:00] like, Y, Y in air quotes, right? Our fictional Y, our placeholder Y, it goes up three. Let’s do maybe one or two more. Uh, the 4. 5. Okay. So it goes over 4. 5. That’s approximately here. XY coordinates, 4. 5 comma 2. Yep. You’re right. And the next one is 8. 6.

That’s around here. 8. 6 up 1. You do the same thing for your purples. Uh, that’s a 5 around here. That is five comma four. This one is What is it? Oh, 2. 3. That’s around here. 1. 3, 4. 4. You get the gist of it? Okay. Draw it out so you can envision, like, where’s everything going? Did I get it right?

It takes about this long.

Next up, let’s take our original table and [00:07:00] we’re going to color code it. You’re just going to add some fill behind it, okay, to keep yourself all organized.

Then, we have to re orient, you’re just going to do a copy paste, you’re going to stack it. Instead of group 1, group 2, beside each other, you’re going to stack them.

You’re just going to say group 1, group 1, group 1, group 2, group 2, group 2, and, oops, this isn’t group, this is, this is your value, okay, which is also known as your X. Your X in quotes, cause it’s not a real X. It’s like the X value that we have to type into Excel to make this all, you know, work and be figured out behind the scenes.

All right. The next thing we’re going to do is we’re going to add some Y values. And again, this is supposed to be X. This is Y. Okay, so we’ve got the groups repeated, we’ve got the X’s, and then we’ve got the Y’s. Remember, we already figured out what the Y’s would be. Uh, here is another tip to make sure you’re doing it right.

[00:08:00] Figure out how many dots you’re going to have. It’s one, two, three, four, five, six, seven, eight. 1, 2, 3, 4, 5, 6, 7, 8. Okay. Eight dots means eight entries on your table. 1, 2, 3, 4, 5, 6, 7, 8. Eight dots, eight entries, eight sets of X and Y coordinates. All right, let’s keep going. The next thing you’re going to do is you’re going to sort it and you’re going to put your Y’s next to each other.

So your fours are going to go together. Your threes are going to go together, your twos and your ones. Don’t overthink sorting. Okay. It just means you take your table with your X’s and your Y’s and you go to data and you go to sort and you say, I’m going to sort by my Y. And it doesn’t matter if you do smallest to largest or largest to smallest.

Okay. It doesn’t matter. It just means they have to be next to each other. Like here, the ones are next to each other. Okay. [00:09:00] Here, the fours are next to each other. Do you see how the color coding changed? It’s green, purple, green, purple now, right? The next thing we’re going to do is we’re going to highlight just the inside of the table, just the interior that I’ve made darker for you.

And I outlined it in black to make sure you can see it. You’re going to go to insert and you’re going to insert our. Scatterplot. If you want it to look like a dumbbell dot plot with a connecting line in there, you’re going to pick this one, the scatter with straight lines and markers. If you just want the dots by themselves, you can pick this one.

Okay. I wouldn’t pick wavy. That would be super weird. I wouldn’t pick this one. That scribble, scrabble. Okay, I’m going to do this one for us. And then you get the Harry Potter lightning bolt and you’re like, and, uh, that’s not what I wanted. That’s okay. We can remove the lightning bolt. It’s going to look more like this.

Can you start to see it? Can you see your dot plot to remove that connecting lightning bolt? Okay. So like, here’s the [00:10:00] connecting line I want to remove. It depends how your table is sorted of which dot you click on. It’s going to be either this dot or this dot. Okay. So you’re just going to try one. And if the wrong line is removed, you’re just going to click undo and you’re going to try again.

So let’s try this one. Okay. I’m going to click on this dot cause I’m going to guess that it controls this line. So if you click on this dot the first time, All of the points are selected. You click on it a second time so that just that dot’s there. You’re going to hold your mouse over that spot. You’re going to do a right click, go to outline and say, no outline.

No, thank you. Okay. Part of the lightning bolt’s gone. Let’s do it again. This dot controls this connecting line. Click on it once, twice, right click. Outline no outline. Okay, you’re gonna get in the rhythm of it. It’s just gonna take this long. Don’t don’t worry It’s really really quick. Okay, there’s your dot plot kind of right you have to [00:11:00] Format format format that takes a little bit more time Things to keep on your radar would be you can control the color of the dot You can add the, uh, labels right here.

I just added the group names in text boxes, but the labels are built in. Uh, you can do this fancy ways to add whatever your category labels are. Honestly, I usually just do text boxes because I find it’s actually, uh, faster in the long run. I should say I don’t do text boxes, plural. I do see one text box that I very carefully format so that it’s lined up with its grid line.

You’re going to adjust the min and the max as you need to. You might make the connecting line thicker. All the normal things. All the normal formatting things that I cover in all my other videos and blog posts. All right, it is your turn. Comment below the video. Let me know. Are you totally lost? Are you kind of following?

How are you feeling about this scatterplot into dotplot thing? Do you want the spreadsheet? It’s there. All right. Good luck. Good luck with [00:12:00] your dotplots. Please sketch. And have fun. Bye.

Finished the video. Made a quick dinner. Now we’re outside doing turkey trot training. I’m gonna try to run with the twins and the big guy.

Hi, big guy. Well, the girls, where are they? Running with daddy.

Written by cplysy · Categorized: depictdatastudio

Oct 01 2024

How to Apply Your Brand Colors in Dataviz

Colors can make or break a chart.

Colors direct our eye movements, and therefore our brains and attention.

It’s up to you: will you help or hinder your reader’s understanding?

Step 1: Start with Your Brand Colors

Otherwise, your graphs, slides, and dashboards will be Frankensteined.

I’ve written about brand colors and brand presents in other posts.

Some of those resources include:

  • Examples of organizations’ brand colors used in graphs
  • How to read color codes in style guides
  • How to enter your custom color codes in Excel

Step 2: Do Your Accessibility Testing

I’ve written about colorblindness, color contrast, grayscale printing in other posts.

Some of those resources include:

  • An official color contrast test
  • An official colorblindness and grayscale printing test

Then, your accessibility testing “results” should go inside your organization’s Dataviz Style Guide.

Step 3: Apply Those Brand Colors According to the Data & Variables

Now, it’s time to apply those branding colors to ensure that your graph is intuitive.

Look at your graph: Is your variable binary, sequential, diverging, or categorical?

Or, do you want to tell a story with a dark-light contrast?

Binary Variables Get Binary Color Schemes

Binary variables include yes/no data, such as:

  • yes/no survey questions
  • people who speak Portuguese as their primary language vs. people who don’t
  • people who own a home vs. people who don’t
  • people who graduated from program on time vs. people who didn’t
  • people diagnosed with an illness vs. people who don’t have it

For binary variables, choose one brand color. The “presence” of the attribute gets the darker color, and the “absence” of the attribute gets the lighter color.

Here’s an example:

Sequential Variables Get Sequential Color Schemes

a.k.a. ordinal

Sequential variables have a natural order.

Examples include:

  • age ranges (5-9 year olds, 10-14 year olds, and 15-19 year olds)
  • income levels
  • highest educational level completed (some high school, high school diploma, some college, etc.)
  • years (Year 1, Year 2, and Year 3 of a project)
  • semesters (fall, spring, fall, spring…)
  • cohorts (first cohort of participants, second cohort, etc.)

For sequential variables, choose one brand color, and use a light-dark gradation of that color.

Here’s an example:

Categorical Variables Get Categorical Color Schemes

a.k.a. nominal

Categorical variables include:

  • race/ethnicity (African American, Asian, Hispanic/Latin@, White, etc.)
  • gender (male, female, nonbinary, genderfluid, etc.)
  • chapters of a report
  • sections of a presentation
  • categories of a dashboard

For categorical variables, use a different brand color for each category.

Here’s an example:

Diverging Variables Get Diverging Color Schemes

Diverging variables are opposites.

Examples include:

  • agree/disagree scales on surveys
  • changes over time (e.g., “50 percent decrease” or “70 percent increase”)

For diverging variables, choose two brand colors, and place the darkest shades on the poles.

Here’s an example:

Combining these Techniques

In most real-life projects, we need to combine these color techniques.

In this map makeover, for example, we needed to:

  • use brand colors, not software defaults;
  • use two brand colors, one for each category; and
  • apply a dark-light gradation to each map, because these are ordinal variables.

In this population pyramid makeover, we needed to:

  • use two brand colors, one for each timeframe, and
  • apply a dark-light storytelling emphasis to each pyramid.

Your Turn

What types of color questions do you have? Comment below..

Written by cplysy · Categorized: depictdatastudio

Sep 25 2024

What’s the Difference between Clustered Bars and Dumbbell Dots??

Maybe you’re already familiar with dot plots…

Maybe you’re already using them…

Maybe you can make ’em in your sleep…

Or maybe you have no idea what I’m even talking about! (If that’s the case, stick around! This video is for you.)

You’ll learn about the differences between clustered bar charts and dot plots. Then, you’ll see a real-life example so you can start thinking about how you’d apply these in your own workplace.

Transcript

Ann K. Emery: [00:00:00] Maybe you’re already familiar with dot plots. Maybe you’re already using them. Maybe you can make them in your sleep.

Or maybe you have no idea what I’m even talking about! If that’s the case, stick around. This video is for you.

You’re going to learn about the differences between clustered bar charts and dot plots.

And then I’ll show you a real life example. So you can start thinking about how you might apply this chart type to your own workplace.

I’m Ann Emery. You’re watching Dataviz on the Go, the series where I make quick tutorials as I’m racing around between workshops and webinars and conferences and consulting projects.

And speaking of consulting projects, I was recently in a meeting with a client and they were asking about these chart types, clustered bar charts and dumbbell dot plots.

And right away when you look at them, they’re obviously different! One’s got bars, one’s got dots, but there is a slight, smaller nuance that I want to draw your attention to here. [00:01:00] And that’s related to attention!

It’s related to where our eyes and brains, and therefore where our precious attention, goes when we look at each of these graphs.

So when you look at a bar chart, your eyes are going to look at obviously the end point, right? That’s the really juicy part of the bar chart.

With dot plots, they don’t waste any time. They cut right to the chase. I love them for their brevity and they just plot the end point. Okay, they don’t waste our ink and waste our time with all this, all this unnecessary ink.

Another slight difference is when you want to compare the end points, you have to do a little bit of a diagonally down movement to compare them, where dot plots plot everything on the same plane, so that it’s just a little bit faster, right?

Instead of stacked endpoints, it’s side by side: same line, same plane.

Alright, let’s look at a real life example because [00:02:00] this one with A, B, C, D and group one and group two is obviously super made up!

Let’s go back into the vault in my memory, where about 15 years ago, which is a million years ago, I was working on a lot of school climate surveys.

I did a lot of consulting for the U S Department of Education. I looked at test scores, all sorts of academic performance and school climate surveys, and I don’t remember the exact details of how this was measured, but I do know that we surveyed parents. And school staff, like the teachers and the principals and all the administrative staff. And then we compared how they responded on different measures.

This is the default graph that Excel is going to give you, which of course, if you’ve watched any of my other YouTube tutorials or read any of my blog posts over the years, you know, we can’t keep that. Okay. Let me just let, you know, just make it super duper clear what we’re not doing.

We’re not keeping these default, inaccessible settings. At a bare minimum, we’re going [00:03:00] to add Big A Accessibility –508 compliance and ADA compliance. That’s the usual stuff. That’s like making sure the font is big enough and dark enough, removing the legend and adding the direct labels right here, which is a win for grayscale printing and for custom words. Colorblindness.

And then we might even, I hope, I hope you do this. I hope you keep going with “little a accessibility” edits to make sure that your graph is really intuitive.

That’s going to be things like grouping, right? Finding groups of elements where parents scored the school higher, versus staff.

That’s going to be things like adding annotations, which, guess what? That’s just a good old text box. It’s a call- out box to help people figure out what the patterns are so that they’re not just guessing and searching and hunting for any type of insight.

This one, honestly, when it’s Big A and little a accessible, I’d say [00:04:00] it’s not that bad!

I wouldn’t lose sleep over this.

If you go this far with editing with your clustered bar charts, I’m going to say: virtual high five, leave it alone. You’ve graduated. No need to keep on going with editing unless you want to, unless you’re ready to really keep boosting your skills and try out something that’s a little bit more advanced.

And that advanced, uh, approach would be the dumbbell dot plot. Which as you know, only puts the emphasis on the end point, the juicy important part. And it helps draw your attention with this connecting line, the, the dumbbell part of it to the difference between the staff and the parents- or whatever groups you’re comparing in your project.

Now, you’re going to have to put the annotations on these finished charts in a little bit different spot, depending on whether you’re doing a landscape final project or a portrait final project.

So if this was going to be landscape, you’re going to have [00:05:00] space for the annotations off to the side. If it’s portrait, It’s going to be a lot narrower.

You’re just not going to have the space. So you’re probably going to have to put the call out boxes above each chart, something like this.

Here’s what I mean: landscape versus portrait. You’re just going to have to think very carefully about where everything fits. So it’s not so condensed that people can’t actually notice those important differences between your groups.

It’s your turn. Comment below this video. Let me know, are you using dot plots? For what? You probably aren’t doing school climate surveys. You’re probably using them for something completely different from this. And also let me know what types of how to questions you have. These are possible in good old Excel and PowerPoint and Word, but they require some advanced behind the scenes magic tricks to make them happen, which I am happy to share with you in future [00:06:00] videos.

Written by cplysy · Categorized: depictdatastudio

  • « Go to Previous Page
  • Go to page 1
  • Interim pages omitted …
  • Go to page 6
  • Go to page 7
  • Go to page 8
  • Go to page 9
  • Go to page 10
  • Interim pages omitted …
  • Go to page 37
  • Go to Next Page »

Footer

Follow our Work

The easiest way to stay connected to our work is to join our newsletter. You’ll get updates on projects, learn about new events, and hear stories from those evaluators whom the field continues to actively exclude and erase.

Get Updates

Want to take further action or join a pod? Click here to learn more.

Copyright © 2026 · The May 13 Group · Log in

en English
af Afrikaanssq Shqipam አማርኛar العربيةhy Հայերենaz Azərbaycan dilieu Euskarabe Беларуская моваbn বাংলাbs Bosanskibg Българскиca Catalàceb Cebuanony Chichewazh-CN 简体中文zh-TW 繁體中文co Corsuhr Hrvatskics Čeština‎da Dansknl Nederlandsen Englisheo Esperantoet Eestitl Filipinofi Suomifr Françaisfy Fryskgl Galegoka ქართულიde Deutschel Ελληνικάgu ગુજરાતીht Kreyol ayisyenha Harshen Hausahaw Ōlelo Hawaiʻiiw עִבְרִיתhi हिन्दीhmn Hmonghu Magyaris Íslenskaig Igboid Bahasa Indonesiaga Gaeilgeit Italianoja 日本語jw Basa Jawakn ಕನ್ನಡkk Қазақ тіліkm ភាសាខ្មែរko 한국어ku كوردی‎ky Кыргызчаlo ພາສາລາວla Latinlv Latviešu valodalt Lietuvių kalbalb Lëtzebuergeschmk Македонски јазикmg Malagasyms Bahasa Melayuml മലയാളംmt Maltesemi Te Reo Māorimr मराठीmn Монголmy ဗမာစာne नेपालीno Norsk bokmålps پښتوfa فارسیpl Polskipt Portuguêspa ਪੰਜਾਬੀro Românăru Русскийsm Samoangd Gàidhligsr Српски језикst Sesothosn Shonasd سنڌيsi සිංහලsk Slovenčinasl Slovenščinaso Afsoomaalies Españolsu Basa Sundasw Kiswahilisv Svenskatg Тоҷикӣta தமிழ்te తెలుగుth ไทยtr Türkçeuk Українськаur اردوuz O‘zbekchavi Tiếng Việtcy Cymraegxh isiXhosayi יידישyo Yorùbázu Zulu