• Skip to main content
  • Skip to footer
  • Home

The May 13 Group

the next day for evaluation

  • Get Involved
  • Our Work
  • About Us
You are here: Home / Archives for allblogs / freshspectrum

freshspectrum

Aug 07 2025

Behind the Scenes: Developing a FreshSpectrum Content Strategy

Where do I start?

If you read my last blog post, you’ll know a little about my plans to turn FreshSpectrum from being my personal/consulting blog into a kind of evaluation forever conference.

At this moment in time, early August of 2025, I have lots of ideas and zero funding. I have done a little work rewriting some of the website copy, and restructuring pages a bit. But the biggest fuel for growth on the web is not intent or structure, but content.

Whether it’s blog posts, videos, newsletters, or podcasts, the act of regularly producing content anchors any website. And when you have little time, focus is critically important.

Building on my strengths.

Here’s what I know about myself.

First, I write like I speak. And apparently, I speak like a middle school teacher.

I’ve been using AI lately to analyze content on different resource websites. I’ve also turned that analysis on myself. Even my more technical blog posts rarely go above an 8th grade reading level. And most of the time I’m writing at like a 5th or 6th grade level.

For the last decade I thought my cartoons and illustrations were my differentiator, and they are to some extent. But I didn’t really consider my writing style as being all that unique. Sure, I’m more informal than a lot of sources, but I still talk about technical stuff.

Turns out, at least in evaluation, the way I write is super rare.

To give you an example, here is what the AI analysis says about how I write here at FreshSpectrum and the content written at Better Evaluation.

FreshSpectrum is 6+ grade levels more accessible than BetterEvaluation, reflecting fundamentally different communication philosophies:

  • BetterEvaluation serves as a comprehensive professional resource, using academic language appropriate for its expert audience
  • FreshSpectrum functions as an accessible learning platform, using conversational language to make complex topics approachable

Both styles are effective for their intended purposes, but FreshSpectrum’s approach would reach a much broader audience while BetterEvaluation’s style maintains the precision and authority expected in professional evaluation contexts.

Analysis by Claude.AI

What should I focus on creating, first?

Until I’m able to generate at least some sponsorship or partnership funding, I’m going to be limited in how much time I can commit to creating stuff. So I need to make a choice.

I think there are four different types of content that could anchor this site. This is beyond my regular blogging/cartooning.

Evaluation Simple Tutorials.

When I talked about “recipes” this is what I had in mind. Basically, the idea would be to create short focused step by step tutorials for different evaluation activities (ex. How to create a simple logic model, Creating a basic evaluation rubric, Designing a one page report). These could eventually be organized into collections.

Evaluation Practitioner Guides.

Evaluation practitioner guides are deeper dives into practical evaluation topics. The posts would be longer and more comprehensive but still written with my middle teacher voice. I could also adapt popular, academically written, guides and pdfs into accessible long-form blog posts (ex. FreshSpectrum guide to Formative, Summative, and Developmental Evaluation, a Practitioners Guide to Systems Evaluation, Breaking Down the CDC’s 2024 Evaluation Framework).

Evaluation Expert Webinars.

Webinars are about tapping into the broader evaluation community. The idea would be to have casual conversations with Evaluators to talk about their work. So if someone publishes an interesting paper, let’s talk to them about it. The evaluation world is filled with authors, presenters, bloggers, and practitioners that might join me for a little bit to talk about their work in front of a live audience.

Evaluation Courses

On this list, courses are the most involved. These would be created with my style but built against a set of learning objectives. My idea for these would be to launch each as a series of live webinars. Then I will adapt these webinars into self-paced courses.

The Other Stuff

I have no shortage of ideas, that’s never been my problem. So I do have a bunch of other things I have been considering. But I think in the short term, those four represent what I think would be a good first step.

Want to provide me with your input?

So if you’re reading this soon after I’ve published it, I have a poll going on LinkedIn. Please visit the poll and let me know what you think I should focus on.

Sponsorship & Partnership Updates

So as I mentioned early, I don’t currently have any funding for this work. But I have talked to a bunch of smart people about it and it’s helped me come up with a strategy.

I don’t think I should just go after grant funding. It would take a good amount of time and energy to do so, and that would take away from just diving in and creating content.

Instead, I plan to search for Sponsors and Partners.

My Sponsor Pitch.

My sponsor pitch is pretty simple. I’m going to ask companies who usually sponsor events like live conferences to sponsor this website. I already reach more people than most conferences and get really high open rates on my newsletters.

I don’t plan to fill this website up with ads, instead I want to get sponsors to help me develop specific pieces of content. This would naturally put them in front of my audience via my emails, this website, and any social media sharing I would do for that piece of content.

My Strategic Partnership Pitch

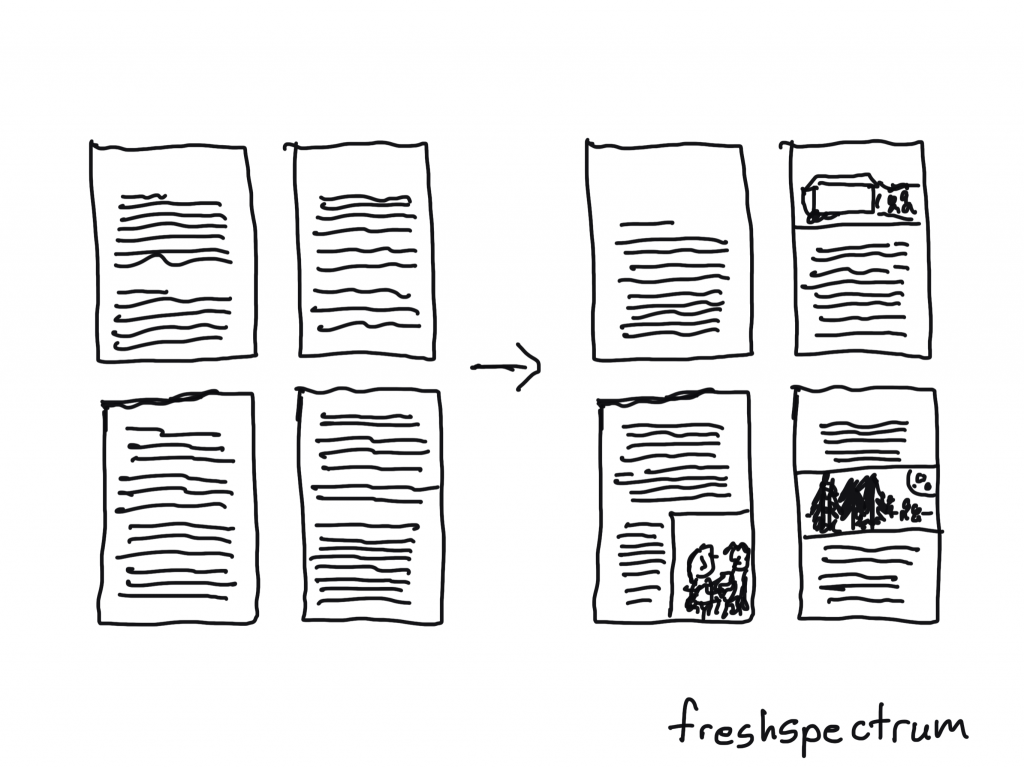
My partnership pitch is a bit different. I want to work with organizations interested in increasing the accessibility and engagement of their own evaluation resources. To do this, I would adapt one (or a few) of their resources into FreshSpectrum Practitioner Guides and share them on this website.

The act of adapting materials naturally results in a set of illustrations and social media assets. Taking a PDF written at a graduate reading level and adapting it to a series of blog posts, illustrated with comics, and written with my middle school teacher voice would greatly increase reach. I’d also provide the evaluation analytics to prove it along with some content strategy consulting.

This would be perfect for organizations already publishing evaluation resources in PDFs that really want to do something to spread their work beyond just a few downloads.

Want to help?

In the future I’ll be looking for experts, but in the meantime if you know anyone who make a good sponsor or partner, could you provide an introduction? And if you have any questions, just reach out and let me know (https://freshspectrum.com/contact/).

Written by cplysy · Categorized: freshspectrum

Jul 29 2025

What’s Next: Building a FREE Forever Conference

I believe the evaluation world is underserved, let’s change that.

I started this blog a little over 15 years ago as a hobby and creative outlet sharing my work with just a handful of people.  A year and a half later, I started including cartoons in my posts and growing a following on Twitter.

Flash forward to today, I’ve now published 718 blog posts and shared thousands of single-panel comics.  My cartoons can be found in presentations, resource websites, course materials, and textbooks world wide. 

I reach just about 3,000 evaluators through my regular email newsletter. Through LinkedIn, in the past year, my posts have reached 40K with 228K impressions. Also in the past year, I have also served 155K+ users across 219 countries through FreshSpectrum.com alone.  This includes 1,000+ users in each of 22 different countries.

But I think we’re barely scratching the surface of what’s possible.

There is a monitoring & evaluation professionals group on LinkedIn that has 88K+ members.  Just based on that, I think we can fairly say that the global evaluation audience is over 100K.

But then you should also consider the evaluation “home cooks.” These are the nonprofit staff, program managers, researchers, government employees, and all the other folks who do some evaluation work but don’t tend to identify as evaluators.  Just from experience, I would estimate that these home cooks outnumber self-identified evaluators by at least 20 to 1.

Putting it all together.  20 * 100K = 2 million.

The evolution of FreshSpectrum.com

This website has become a hub for the global evaluation community…accidentally.  My new goal is to intentionally build and strengthen that community.  This means leveraging the existing platform and amplifying what works.

Here is exactly what I would like to do.

Reach

  • Develop evaluation “recipe” collections, step by step tutorials designed to make evaluation methods and theory more approachable for evaluation home cooks. 
  • Offer regular free live webinars (monthly) on a variety of evaluation topics, featuring guest evaluators from all around the world. 
  • Continuing to create comics and other easy to share resources.

Teach 

  • Deliver free premium live evaluation workshops through platforms that do not require registration and are auto translatable.
  • Adapt the free live workshop recordings into self-paced courses available through the website without requiring registration.
  • Offer monthly free live office hours sessions, including expert guests when possible, with staggered times to reach different global audiences.

Connect & Amplify

  • Lead intentional asynchronous community discussions through multi-voice blog posts.
  • Review and share resources and feature resource creators to help amplify good work.
  • Community Q&A posts with individual evaluators from across the global community.

What is a conference really?

Networking, education, belonging.  There is no reason that these things have to happen in a hotel over the course of a few days.  My theory, supported by substantial evidence, is that we can reach, teach, and connect more people to evaluation through content creation via WordPress and YouTube.  And not just for a few days, but year round.

Why now?

In terms of interest, evaluation is at a 20 year high point.  In terms of developing effective resources, we are creating less original content than we did 10 years ago.  At the same time, recent U.S. federal funding cuts have eliminated several major evaluation training resources just when they’re needed most.  

Partnership and Sponsor Opportunities:

Creating content (live workshops, courses, recipes) and building community takes a lot of time and energy.  So in order to make this happen, while keeping everything free and low barrier, I need funding.  My personal goal is to move away from consulting and spend full time developing this forever conference.

I’m seeking sponsors who believe in democratizing evaluation information.  Partnership levels ($10K-$50K annually) are similar in structure and cost to conference sponsorships but with year-round engagement and better reach than you could get by paying online marketing firms.

As a strategic partner I can also offer additional benefits you will not get through traditional conference sponsorships.  This includes strategic support, co-branded content creation, website and resource evaluation, private training, comic illustration, and the ability to help inform the direction of FreshSpectrum.com.

How You Can Help:

Know someone who might sponsor this? – I need partners who believe evaluation knowledge should be accessible to everyone, not just the few who consider themselves professional evaluators and can afford conferences. If you are someone who could sponsor, or know someone, reach out via email and/or schedule a time to chat > https://freshspectrum.com/contact.

Pledge your support – Want to pledge support as a community member? Fill out our form and help me prove the value to potential sponsors. Click here to join the community waitlist.

Written by cplysy · Categorized: freshspectrum

Jul 22 2025

Does evaluation have a resource problem?

This post ended up being really long, with lots of data. If don’t feel like reading it, here is the TL/DR version.

  • Evaluation does indeed have a resource problem.
  • Government funding changes have made it worse.
  • I have a plan to do something about it.

I wrote a bit about watching so many of our peers losing their jobs back in February. Unfortunately that was not just a temporary thing. This has been a hard year for lots of evaluators and researchers. Especially for anyone who works in or with the US federal government. But I can’t help but wonder about the longer term implications that will result from this shock to the system.

Here is what I know.

I’ll let other experts talk more about federal and contractor jobs lost. And I know the American Evaluation Association has been doing research on the impact on the evaluation workforce. So I’ll focus on what I know best, evaluation on the web.

I started blogging before I started cartooning and before I started designing. It was 2009 and I was a data specialist in a non-profit just starting to learn about about evaluation. At that time blogging was in its hey day. Twitter was still young with 140 character limits and no images. Instagram had yet to launch.

It wasn’t long before influencers across all platforms started to move more into social media, podcasting, and video. And while blogging today is not irrelevant, it’s not the dominant form of personal online publishing that it once was.

And if you’re wondering what this has to do with anything, keep reading and I’ll show you.

The information behind the internet.

Google and ChatGPT are not magic. They are just tools that allow us to experience lots and lots and lots of information. But they require input. And the better the input, the better the output.

This is why early in my career I spent a lot of time trying to recruit new evaluation bloggers. My first evaluation conference presentation was a pitch for new evaluation bloggers (you can actually still watch it on YouTube). I even created a website (Eval Central) to help ensure that new bloggers had access to an initial audience so they wouldn’t get discouraged and stop blogging.

A few of these early evaluation bloggers are names you will certainly recognize (Stephanie Evergreen, Ann K Emery, Sheila Robinson, and many more). And even though many of us ending up blogging more about data visualization, reporting, and presentation design, evaluation was the starting point.

Of course, the fact that many of us did move away from evaluation in our posts does point to a central issue.

Our Internet Body of Work Problem.

Patricia Rogers launched Better Evaluation in October of 2012. This evaluation resource site was built around a central framework, it drew content from expert contributors, and created a lot of high quality evaluation resources.

Because of all that work, if you were to ask Google a question about evaluation, often you would find your way to a page on the Better Evaluation website. Just like if you were to look for an evaluation cartoon you would likely find your way here to Fresh Spectrum.

Like with academic literature, where the goal is to build upon a collective body of work, the internet is its own body of work. These two bodies of work do overlap but the fact that so many academic institutions and publishers paywall their publications, keeps that body of work mostly off the web.

What this means is that the importance of a resource library, like the one on Better Evaluation, should not be undervalued. And while there are many other resource libraries. Unfortunately for all of us, many of those resource libraries are just not good at publishing web friendly content. And even those that are, just don’t publish enough.

A simple analysis.

I’ve given you a lot of (informed) opinions thus far, but we’re data people. So let’s go deeper.

I put together a list of evaluation resource sites. Just to note, I tried to go pretty wide but I know I’m missing a good number of sites. If you notice any BIG evaluation resource websites missing from this list let me know in the comments.

This list includes university resource sites, some consultancies, international efforts, big association sites, and more. I also put my website in for context but generally avoided most personal blogs that write a lot about other topics.

There are 52 sites here.

  • AEA365
  • African Evaluation Association
  • American Evaluation Association
  • Australian Evaluation Society
  • BetterEvaluation
  • Brown School Evaluation Center
  • Canadian Evaluation Society
  • Center for Evaluation and Educational Effectiveness
  • Center for Evaluation Innovation
  • Center for Evaluation Research and Methodology
  • Center for Evaluation, Policy, & Research
  • Center for Program Evaluation and Quality Improvement
  • CREA
  • CRESST
  • Data for Impact Project
  • Equitable Evaluation
  • European Evaluation Society
  • Eval Academy
  • Eval and Ink
  • EvalCentral
  • EvalCommunity
  • EvalPartners
  • Evaluation, Assessment, and Policy Connections
  • EvalYouth
  • Expanding the Bench
  • FreshSpectrum
  • German Institute for Development Evaluation
  • Global Evaluation Initiative
  • Harvard Family Research Project
  • IDEA Data
  • Impact Entrepreneur
  • Indigenous Evaluation Network
  • Innovation Network
  • Institute for Assessment and Evaluation
  • International Program for Development Evaluation Training
  • MEASURE Evaluation
  • MERL Tech
  • Office of Assessment, Evaluation, and Research Services
  • Participatory Evaluation Network
  • Regional Educational Laboratories
  • TCC Group
  • The Evaluation Center
  • The Evaluation Group
  • The Social Research and Evaluation Center
  • Tools for Development
  • U.S. Government Evaluation Portal
  • UK Government Evaluation
  • UN Evaluation Office
  • USAID Evaluation
  • USAID Learning Lab
  • Utilization-Focused Evaluation
  • What Works Clearinghouse

To gather the data I used a tool called Uber Suggest which looks at search engine data.

I only looked at two numbers. Domain or Page Authority AND Estimated Traffic for the month of June.

SEO Authority (i.e. Domain/Page Authority): is a composite rating that takes account of backlinks (websites that link to that website) and search placement (where a website shows up when someone searches for a keyword on Google). It’s a proxy for how SEO people guess Google treats website authority.

Estimated Traffic: Estimated traffic is based on the appearance and placement of the website in specific keyword searches. It then estimates the number of people who likely clicked on that link based on placement and the number of people generally searching for that term.

Most evaluation sites receive fairly low amounts of search engine traffic.

Not all sites are designed for search. Some resource sites will rely pretty heavily on email newsletters or other means to connect with their readers.

But generally, when it comes to web searches, a lot of resource sites get only a little bit of traffic through search.

Only 10 of the 51 sites (not including my own) likely had more than 3K visits last month from search.

These websites include Better Evaluation, Eval Academy, Eval Community, the American Evaluation Association, the Canadian Evaluation Society, and Tools for Development.

4 out of those ten have either been shut down or are at risk of being shut down due to changes in federal budget priorities.

The USAID Learning Lab is completely gone. Visiting the site will get you an error message. Note: In order to get some traffic data I used February estimates (instead of June) for this analysis. This is the only exception I made.

MEASURE Evaluation and Data for Impact are both still live. They are run by the Carolina Population Center at the University of North Carolina Chapel Hill. BUT…it is clear on both websites that they are the products of USAID funding.

Data for Impact’s last blog post was in November of 2024. The last updates I found on MEASURE Evaluation were from 2021. It’s possible that the site is one of many legacy websites produced with funding from the US government but not in continued operation.

The What Works Clearinghouse website run by the US Department of Education’s Institute of Education Sciences last news article was published in December of 2024. And as of March, IES is down to 20 federal employees, from 175 at the end of last year.

How does a website that rarely gets updated, maintain an estimated 20K views a month from search?

If you’re still scratching your head at how search statistics work, this might help.

As you can see, MEASURE evaluation has been able to accumulate an amazing number of backlinks over the years. Again, this is the number of links you’ll find on other websites that lead back to Measure. Because of that, it has pretty high domain authority.

Compared to other sites, 20K visits sounds pretty good. But that’s actually a low point for this site. Back in December of 2023 it had an estimated 71K visits.

So what does this all mean to a regular evaluator searching for information on the web?

Let’s say you type into Google “Evaluation News.” Based on the SEO Keywords you are likely going to see a link from MEASURE evaluation come up first in the list of non-promoted, non-AI, links.

Measure is also going to be the top source for most people looking for “Data Quality Assessment Tools.”

As long as the website continues to be live, and as long as it’s still useful, these posts will likely stay high in web searches. That is unless another agency or individual writes a better article.

What happens when we completely lose a website?

As I mentioned before, USAID Learning Lab was taken completely offline. If you go to visit the website, this is what you’ll get.

Let’s go ahead and look it in Uber Suggest. Even though it’s gone, it still shows pretty high domain authority.

But if we look at the traffic you’ll see it goes down to nothing from a high of 38K visits in August of 2024 (just a year ago).

Now let’s look at the backlinks. According to UberSuggest it has 97,690 from 3,667 unique web domains.

But let’s dig down and look at those individual links. One of the first ones that comes up is a link on the Wikipedia Page for Learning Organization.

That page still has that link as being live, along with AgriLinks, DRGLinks, Edulinks, and ResilienceLinks. All of these links are now dead ends.

Let’s look at another. Here is a link from a Report to Congress by the State Department on Evaluation Quality, Cost, and other matters.

Here is what you’ll find in the text of that report.

USAID: USAID is recognized as a leader in evaluation among federal agencies. USAID’s evaluation policy (note: this page is also dead as it lives on the USAID website) sets specific guidelines for how to conduct high quality performance and impact evaluations. USAID has a publicly available evaluation toolkit which provides step-by-step resources to staff designing and managing evaluation to ensure that they are of high quality.

It sounds like a pretty cool evaluation toolkit, too bad the link is now dead.

You may suggest that we could go back and use the internet archive’s wayback machine to recover some of these missing posts and documents.

And while that’s true, unless action is taken by the holder of the domain/website, those missing posts and documents will never be connected to the appropriate backlinks.

The loss of that one website just made 97,690 links dead ends.

Is this an opportunity for evaluation bloggers?

Technically, yes. It is an opportunity to fill gaps in the body of work that is evaluation on the web.

Only one problem. We have fewer evaluation bloggers now. And many of the highest authority bloggers have moved into parallel fields.

On the American Evaluation Association website there is a page that lists 92 evaluation blogs. That sounds good, except that the page is not really updated…ever.

Only 34% of evaluation blogs remain active, with 17% posting monthly (highly active) and 16% posting quarterly (moderately active). Nearly half (45%) are inactive, having not posted in over two years. Additionally, 16% have changed domains or moved to different platforms, while 5% could not be located at all.

And of those 34% of evaluation blogs that remain active are several blogs that rarely ever talk about evaluation.

What about our existing resource sites, like Better Evaluation?

Before I get into this, let me note something. I think Better Evaluation is the field’s best designed resource site. The internet is constantly changing through big shifts (hello AI) and little ones (periodic Google search algorithm changes). In that way, big changes in traffic could have absolutely nothing to do with organizational changes.

In other words, this is not a criticism of Better Evaluation’s new management, just a little analysis of the available data.

Better Evaluation became part of the Global Evaluation Initiative back in November 2022. Patricia Rogers, original founder and CEO, stepped down in August of 2021 after a decade at the helm.

So what did that mean for one of the biggest resources in the evaluation world?

First, a reduction in content. You can see it in the blog archives. In the three full years after Patricia left, Better Evaluation posted 28 blogs. In the three full years before Patricia left, the site posted 50 blogs.

The Better Evaluation YouTube page shows us a pretty steep decline in videos posted. Better Evaluation lead a number of webinars and then posted those webinars to YouTube. But there hasn’t been a new webinar for 3 years.

The site was never a video first website, it was a resource website. And as you have seen from the data above, it is still one of the most popular. But even as a resource site, we also see a huge drop in traffic since 2023.

So where are we now as a field?

It’s true that certain parallel fields (such as data visualization) seem to have become more popular than program evaluation. But at the same time, evaluation is more popular on the web now than it has been over the last 20 years. To see some of those relevant changes, just head to Google trends.

Sometime in the middle of the 2010s, data visualization traded spots with program evaluation in terms of relative search popularity.
If you isolate search terms and just look at “evaluation jobs,” we hit a search high point in October of 2024.
Looking at evaluation resources we also hit a high point in October of 2024.
Same is true for searches on the words, “evaluation support.”

In case I haven’t made it clear.

I believe the field of evaluation has a resource problem. There is still demand for good resources, but less supply actually showing up in web searches. And if this is important to us as a field, I don’t think we can rely totally on amateur bloggers and creators to fill the gap.

Relevance in the Digital Age.

I’ve found that most people who do evaluation do not consider themselves evaluators (I call them evaluation-doers).

They are the program managers, non-profiters, researchers, health workers, and all sorts of other people who do evaluation work. They often don’t have lots of evaluation experience or academic training in evaluation, and becoming an evaluator is not their goal. So we can’t rely on associations or universities for everyday support.

They learn evaluation like people learn anything else, they go to Google. They type in questions like, how to do an evaluation for a grant, what is a developmental evaluation, how do I get better survey response rates, or how do I plan a focus group?

The quality of the sites that come back from the search will have an almost direct impact on the quality of data work done by the searchers. Showing up in those searches is one way for our field to stay relevant in the digital age. And we’re losing ground.

My new plans for Eval Central.

Here we are, full circle.

I’ve decided to do something about the gap in evaluation content. Because I know that we evaluators DO have agency in what shows up in web searches and on YouTube.

I plan to rebuild Eval Central. This time as a Community of Practice and Capacity Building Hub.

The other thing I’m doing this time is seeking funding BEFORE I launch.

My plan for the Eval Central CoP is a scaling up of a model I’ve been developing with the CDC for over the past 5 years.

And if it gets funded, here is what you can expect.

  • Open (FREE) to ALL evaluators across the globe.
  • Premium (FREE) evaluation training courses.  
  • Monthly webinars (FREE) & office hours (FREE).
  • Designed for evaluation practitioners.
  • Also designed for people who do evaluation work but don’t call themselves evaluators (evaluation-doers).
  • Built on a modern community platform designed to support Peer to Peer connection.
  • Led by me, Chris Lysy of frehspectrum.com

Think Rachel Ray, NOT Le Cordon Bleu.

Now I need a favor. I’ve built a proposal but it would be helpful if I could show that there is interest in this kind of effort. So I also built a Community Waitlist.

If you are interested in this FREE community. Click on the link and add your email.

And if you know anyone at a philanthropy, business, or other organization that might be willing to help sponsor this new community, can you put them in touch with me?

In addition to sponsoring something that will provide a LOT of evaluation community value. I also have some pretty valuable sponsor incentives to offer.

Just send me an email or schedule a time to chat via my calendar (https://calendly.com/clysy/30min).

Written by cplysy · Categorized: freshspectrum

Jun 26 2025

What is Data Illustration?

Data illustration is about more than data visualization. And it’s also different from data design. So what is it exactly?

If you were to search for information about data illustration over Google, you’ll probably end up with a bunch of results about data visualization. I get it, when I tell someone I do data illustration they immediately think about data visualization. But as someone who regularly creates charts and graphs for clients, cartoon illustrates books and presentations, and also does a bit of graphic and web design, I think that’s a mistake.

2 comic people talking.
Person 1. This report is a little dense, it could probably use some illustration.
Person 2. What do you mean? Didn't you see the graph on page 47?

The three big tasks in data reporting.

I find that when we share data there are generally three different tasks people often do at the same time even if they don’t think of it that way.

There is the writing task. Unless you’re a data visualization consultant or graphic designer this is probably the thing you’re doing the most as you put together a report.

There is the design task. This is something a lot of data people think comes after the report is done. But if you ever find yourself spending time in Word tweaking the size of tables and testing different heading sizes, you are doing a bit of design.

There is the illustration task. This is something that most data folk I know do almost incidentally. If there is a data table, they might add a chart or graph. If they have a good photo, they might add it at the end of a section, if they have the space.

When I teach report design, my personal goal is often to get my workshop participants to approach each one of these tasks separately, systematically, and with a little bit more intention.

Simple drawing showing illustration.

Why I got a little tired of data visualization.

I’m still a data guy at heart. Someone who does enjoy creating a really nice chart or graph. Someone who loves exploring datasets and making new discoveries through visualization.

But I find that that data visualization field is a little too concerned with optimizing charts and graphs. And not concerned enough about the context within which those charts and graphs appear.

Yes, you could probably make the chart on page 47 a little bit more effective with a different type of chart. But adding 20 more pictures to your report (of any style) would be way more beneficial.

The same with graphic design. A little bit more intention and negative space in your page layouts would certainly make your 60 page report more readable. But creating a 5 page executive summary filled with illustrations would allow your analyses to reach a far greater audience.

It’s why I stopped nitpicking chart choices and report page length.

If you like the pie chart better than the bar chart, keep it. Want to make your technical report 130 pages in default Microsoft Word style with 200 pages of appendices? As long as you create some shorter visual adaptations, go for it. You’ll probably get just as many readers as you would if you were to turn your long report into a well designed 60 pager.

Simple drawing showing featured images being used.

Data illustration presents the biggest opportunity.

A lot of my clients have similar problems with their reports that limit accessibility.

  • The reading level is often too high for the intended audiences.
  • They try to solve all their reporting challenges with one report.
  • And finally, there are just not enough pictures.

On the front page of this site I claim that better illustration is the fastest way to help you boost the impact of your data work.

The reason I say this because most people already know that their writing could use a little help. They also recognize that their design skills are not the best. When they have the budget, a lot of people seek out support by hiring graphic designers and editors. When they want to learn, they join academies and take courses.

But hardly ever does someone say to me, we just don’t have enough pictures even though most of my clients know that I am also an illustrator.

To become a good illustrator takes a lot of time and practice. I’ve been cartooning for like 15 years now and I know I still have a lot to learn. But illustration is a process that can be learned by anyone. And while it may take time to master, it’s not hard to get started.

Simple drawing of one of Maurice Sendak's most famous characters.

An illustration is an enlargement, and interpretation of the text, so that the reader will comprehend the words better. As an artist, you are always serving the words. You must never illustrate exactly what is written. You must find a space in the text so that the pictures can do the work. Then you must let the words take over where words do it best. It’s a funny kind of juggling act.

Maurice Sendak

A Chinese painting is often accompanied by words. They are complementary. There are things that words do that pictures never can, and likewise, there are images that words can never describe.

Ed Young

How to get started with data illustration.

With data illustration…

  1. your work will look more professional.
  2. it will be easier to skim.
  3. you will be more likely to engage a distracted reader.
  4. you will have more opportunity to add context.

I wanted to give you a process, so I developed a framework.

My OSEE framework is a four step data illustration process. The point of the framework is to give you direction on how to approach illustrating reports, presentations, and all sorts of other data products.

I plan to write a good bit more about data illustration in the upcoming months. But to get you started I also created a short little 15 page guide which you can download for free here:

Written by cplysy · Categorized: freshspectrum

Jun 11 2025

Benefits Realisation and Evaluation – Can outcomes and benefits be friends?

This week’s post is a guest post by Liz Richardson who is a senior specialist in evaluation at Natural England. As per usual when I have guest post, Liz wrote the words and I just drew the comics 🙂

As an evaluator I talk a lot about outcomes, what they are, how to word them, what they are not!  Terminology can be a daily hurdle as the confusion around outputs, outcomes and impacts is very genuine.  But then along come Benefits and their need to be realised.  I now feel I am on the other side of the terminology fence.  How does this fit in with evaluation and how are they different from outputs and outcomes? I am going to attempt to unravel this here.

Where I learned about the term Benefits Realisation.

This is something that has been more prominent in the UK since 2003, but I have become more aware of benefits through my job working on priority projects and they are a requirement  alongside evaluation as part of a project management process.  My experience is working with teams who are trying to define project benefits alongside outputs and outcomes and, as we evaluators are collaborators, this has led me to exploring this further and trying to bring both processes closer together.

Why it’s important.

Before we get on to what the difference is let’s think about why this is important to help us understand if our project or programme is achieving its aims and making a positive change.  Having two separate processes is unhelpful for project staff, so we need to bring both these things together in a meaningful way so one supports and informs the other, reduces the workload for teams and meets our learning and accountability needs.  Evaluation and benefits realisation are both crucial aspects of project management, but they serve different purposes and are conducted at different stages of a project.

How do we define benefits realisation and evaluation?

Let’s look at the definitions for each of them.  Evaluation draws on a range of approaches and methodologies to assess a project’s outputs, outcomes and impacts and uses a range of methods to collect and analyse data.  As part of evaluation, we consider attribution and contribution and the extent to which the delivery meets these criteria. Outcomes focus on changes in knowledge, skills, behaviours and attitudes.  We want to know how and why a project is effective and when it isn’t. So, hopefully we all agree with that.

A Benefit is a positive measurable improvement resulting from an outcome that is perceived as an advantage by an organisation. Benefits management identifies, plans and tracks benefits through to realisation which is the practice of ensuring that benefits are derived from outputs and outcomes using KPIs, timelines and milestones. 

What are some parallels between benefits and outcomes?

That seems reasonably clear, but it still feels like there is some overlap here.  Could a benefit be an impact or long term outcome?  While I expect there is room for overlap perhaps the difference lies in the focus.  Benefits feel very specific, tangible, have a value and can be monitored whereas a long term outcome is a broader change that leads to impact and  impact is something that a project is contributing towards rather than achieving solely on its own.

 What some of the differences?

 So now we can perhaps begin to see where some of the differences lie. Evaluation is using methods and approaches to ‘test’ theories and answer questions and is interested in what worked well and less well and why as well as the extent to which the outcomes are a result of the intervention.  Benefits management is ensuring that the planned benefits deliver value for the organisation and often focus on what they are worth. This highlights different audiences, outcomes for beneficiaries and benefits for organisations or funders, although there will be overlaps here.

Here is an example of evaluation and benefits realisation in action.

Let’s explore this using an example of a Workplace Wellbeing programme aiming to improve mental and physical health of employees.

For the Evaluation outcomes would include, reduced stress, improved mental well being and physical health.  We would want to know if the programme has been effective and what has worked well and not so well? The evaluation would want to understand if the changes are a result of the programme or whether anything else may have caused this e.g. a change in work practices implemented at the same time or activities outside of work. The methods used would take this into account.

Benefits realisation would focus on ensuring that the benefits defined at the start of the program are achieved and aligned with strategic goals. Benefits might include reduced absenteeism and employee retention thus supporting the organisational strategic aims around employee satisfaction and higher productivity. These benefits could be monitored and tracked and would be a result of the outcomes.

The key here is if these benefits are not realised it is the evaluation that will tell us why. I now feel that Benefits could have a place in a Theory of Change, or I am certainly getting closer to bringing evaluation and benefits realisation together.

Be good to get people feedback on if this rings true.

Written by cplysy · Categorized: freshspectrum

  • « Go to Previous Page
  • Go to page 1
  • Go to page 2
  • Go to page 3
  • Go to page 4
  • Interim pages omitted …
  • Go to page 54
  • Go to Next Page »

Footer

Follow our Work

The easiest way to stay connected to our work is to join our newsletter. You’ll get updates on projects, learn about new events, and hear stories from those evaluators whom the field continues to actively exclude and erase.

Get Updates

Want to take further action or join a pod? Click here to learn more.

Copyright © 2026 · The May 13 Group · Log in

en English
af Afrikaanssq Shqipam አማርኛar العربيةhy Հայերենaz Azərbaycan dilieu Euskarabe Беларуская моваbn বাংলাbs Bosanskibg Българскиca Catalàceb Cebuanony Chichewazh-CN 简体中文zh-TW 繁體中文co Corsuhr Hrvatskics Čeština‎da Dansknl Nederlandsen Englisheo Esperantoet Eestitl Filipinofi Suomifr Françaisfy Fryskgl Galegoka ქართულიde Deutschel Ελληνικάgu ગુજરાતીht Kreyol ayisyenha Harshen Hausahaw Ōlelo Hawaiʻiiw עִבְרִיתhi हिन्दीhmn Hmonghu Magyaris Íslenskaig Igboid Bahasa Indonesiaga Gaeilgeit Italianoja 日本語jw Basa Jawakn ಕನ್ನಡkk Қазақ тіліkm ភាសាខ្មែរko 한국어ku كوردی‎ky Кыргызчаlo ພາສາລາວla Latinlv Latviešu valodalt Lietuvių kalbalb Lëtzebuergeschmk Македонски јазикmg Malagasyms Bahasa Melayuml മലയാളംmt Maltesemi Te Reo Māorimr मराठीmn Монголmy ဗမာစာne नेपालीno Norsk bokmålps پښتوfa فارسیpl Polskipt Portuguêspa ਪੰਜਾਬੀro Românăru Русскийsm Samoangd Gàidhligsr Српски језикst Sesothosn Shonasd سنڌيsi සිංහලsk Slovenčinasl Slovenščinaso Afsoomaalies Españolsu Basa Sundasw Kiswahilisv Svenskatg Тоҷикӣta தமிழ்te తెలుగుth ไทยtr Türkçeuk Українськаur اردوuz O‘zbekchavi Tiếng Việtcy Cymraegxh isiXhosayi יידישyo Yorùbázu Zulu