• Skip to main content
  • Skip to footer
  • Home

The May 13 Group

the next day for evaluation

  • Get Involved
  • Our Work
  • About Us
You are here: Home / Archives for allblogs

allblogs

Jan 07 2022

Clarifying Your Intent and Impact

There are a handful of universal practices that transcend technique, tools, and strategy. Paying attention is one of these. Choosing what to pay attention to is more tricky.

Intentional practice is just as it sounds: do something with purpose. This sounds simple — it is simple– but it’s among the most powerful practices for discovery, innovation, and performance. Being intentional requires that we know what we value, what value we seek to create, and how well we are doing.

This allows us to apply methods like the Copy Cat Method to learn from others. Our intentional practice also leverages something called attractors — energy directed toward an activity.

Noise Reduction

Noise — unhelpful information in its relevance, salience, or quantity – is everywhere. We find noise almost everywhere. Noise increases as data is generated and shared. Our ability to attend to it all is compromised by the volume available to us. What intentional practice does is it forces us to consider what is most important and when.

When we are intentional about what we are doing we create a noise filtering system that allows us to better judge data.

Getting intentional means being clear on what you want. It’s about working as an organization to ask explicitly about values and the kind of impact desired.

A useful tool to help this along is a variation of the Personal Moral Inventory Checklist developed by Dom Price. This checklist basically requires us to assess our performance across four different areas of impact outlined in the image below.

PMI.png
(See Atlassian’s article on the topic)

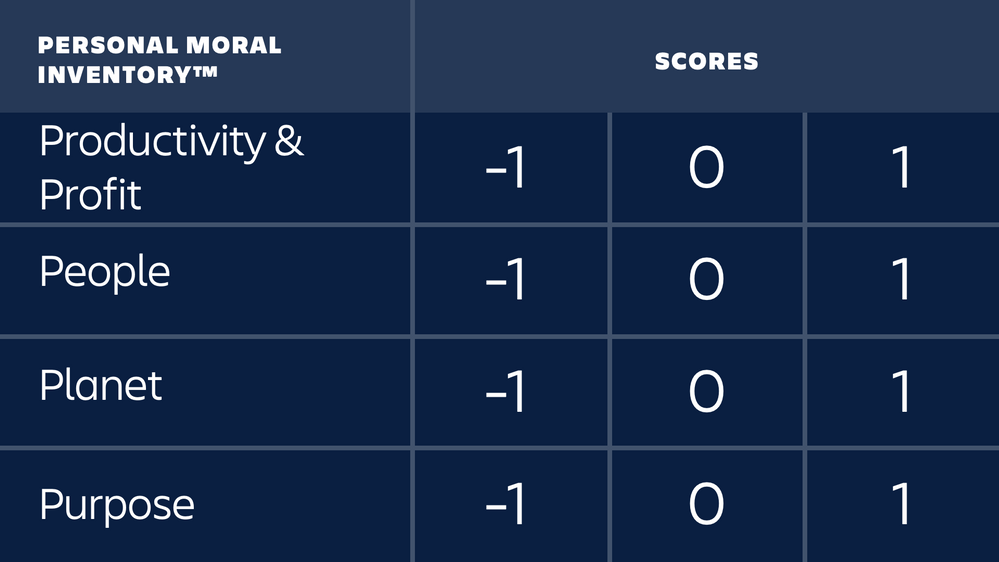
This tool designed for individuals can be modified for organizations in helping to generate a connection between the choice of activities and the perceived impact of those activities. This can only be done by creating a tighter, simple coupling of activity, intent, and perceived impact.

Using Simple Inventories

What the above inventory does is make things simple, reduce noise, and focus us on the core principles and values of our work. We recommend using something like this — there are many options — as part of a values and value clarification exercise. Bring together your team and give some time to ask yourselves three questions:

  1. What do we stand for?
  2. What kind of impact do we want to express through that stance
  3. How well are we doing?

These simple questions can help you to clarify your core beliefs and values, determine what kind of value you wish to create through your work, and assess progress on those values. It’s simple, powerful and something that ought to be done every 6-12 months to best capture variation, changing circumstances, and provide a means to calibrate your strategy and operations.

If you want help facilitating this process in your organization. Contact us and let’s talk.

The post Clarifying Your Intent and Impact appeared first on Cense Ltd. .

Written by cplysy · Categorized: cameronnorman

Jan 06 2022

Who cares? And why engaging reports are not always important or even necessary.

So just the other day here in North Carolina, it was in the 70s. Short sleeve weather for sure.

Then the rains came and the temperature dropped into the 30s over the course of hours. Enough for the rain to turn into snow, but not cold enough for it to stick to the ground.

I care about the weather a lot because I have an energetic puppy who needs lots of exercise. So I walk a lot. And before I go for a walk I check the weather. Sometimes we need to walk in the rain, but if I can avoid that by delaying our regular walk by a half hour, that’s just what I’ll do.

freshspectrum cartoon by Chris Lysy. 
Woman holding an umbrella says to man looking at his phone.
"How long does it take to check the weather?"
Man responds,
"Sorry, I'm still making it through the methods section of today's weather report."

Same time, same weather system, snow fell in Virginia. Enough snow to jam up traffic. And the usual couple hour commute between Richmond and DC became a nightmare for all sorts of motorists (including a senator who was stuck on the road for over 24 hours).

I started my normal 2 hour drive to DC at 1pm yesterday. 19 hours later, I’m still not near the Capitol. My office is in touch with @VaDOT to see how we can help other Virginians in this situation. Please stay safe everyone. pic.twitter.com/Sz1b1hZJZ5

— Tim Kaine (@timkaine) January 4, 2022

Also going on right now, my mother-in-law is trying to get back to her home in MD after her holiday visit here in NC. She booked a flight the other day, but it got cancelled. Then her replacement flight was also cancelled.

When her flight was cancelled I could have driven her home. We have a four wheel drive vehicle and have done the trip countless times. Of course, that takes us right up I-95 past Richmond towards DC…

So why does this matter?

Because we use data in our daily lives ALL THE TIME. From tracking the weather for dog walks and picnics, to watching traffic for short commutes and long road trips, to following flight cancellation trends, and watching Omicron spread.

And with the highly relevant things that we care about A LOT, like the weather, traffic, and COVID waves we rarely desire fancy engaging stories, illustration filled reports, or complex graphs. We just want the damn data.

Not everything needs to be engaging.

Do they care… a lot, a little, or not yet? (A.K.A. the “give a shit” spectrum)

freshspectrum cartoon by Chris Lysy. 
Audience Interest Level
Scale High Interest, Medium Interest, Low Interest.
High Interest Woman "Give me ALL the data."
Medium Interest Man "Okay, I'm listening, what you got?"
Low Interest Woman, "I'm sorry. Did you say something?"

Audience is always important. As I’ve mentioned many times before on this blog, your report can’t serve all audiences.

But it’s also not just the audience type that matters. It’s also the audience’s interest level in the data that you have to share.

For each audience you are trying to serve, ask yourself “do they care?”

  • If an audience cares a lot about the data, they don’t need to be engaged. They are already engaged. They just need the data.
  • If an audience cares just a little about the data, which covers many types of stakeholders (usually including boards, politicians, and executive directors), then YES, you need to engage.
  • If the audience doesn’t really care about the data yet, they need to be inspired before they can even be engaged.

Inform, Engage, Inspire

After you ask the “who cares?” question for each of your audience types (or personas), it’s time to tailor your reporting approach.

Inform

freshspectrum cartoon by Chris Lysy. 
Two women in a car, the car is swerving over into the incoming lane of traffic.
Woman driving says..."I love this new smart dashboard. It's so engaging. Look, you can play Candy Crush!"

For the people who care a lot. Usually project staff and program administrators, your job is usually to get them the data they need to do their work as efficiently as possible. Then get out of their way. This is what I call the Inform step.

The inform step is where executive summaries and data dashboards live. Improving your reports in this area is all about good user experience design.

If you get fancy here, add a bunch of questions or extraneous data, your audience will get annoyed. This is where a well-meaning dashboard developer might fail their audience by trying too hard to engage an already-engaged audience.

Engage

freshspectrum cartoon by Chris Lysy. 
An older Alice from Alice in Wonderland thinking "Not falling for that one again. I'm much too busy anyway." 
As the white rabbit heads to the rabbit hole looking at his watch and saying, "I'm late."

For the people who are interested but are not engaged enough with the material to even know what questions to ask. Where the inform step was all about answers, the engage step is about questions. Your goal is to take a somewhat interested audience and turn them into an engaged audience.

Engaging reports leverage your audience’s partial interest while attempting to ramp up their curiosity. The goal is to get them to start asking questions in their own heads. This is where you’ll find reports like infographics, magazine style reports, and webinar presentations.

These types of reports are easier to develop effectively if you can take control of the narrative. That means leveraging your own expertise in finding what’s interesting and then telling the stories. There are exceptions, but this is usually NOT the time to use data dashboards.

Inspire

freshspectrum cartoon by Chris Lysy. 
Man says to woman, "So you don't find long wordy evaluation reports inspiring? That's just me?"

For every program or initiative there are all sorts of audiences on the fringe. Close enough that they might be able to hear you, but not enough for them to be that interested in what you have to say.

This audience might include social media followers, community members, and other people who might be more interested in what you have to say if they knew anything about what you were trying to accomplish.

The inspire step is about connecting your audiences with the bigger story. Think of this like the TED Talk stage, where you have a short time to pique interest but might be reaching an audience who has no clue who you are. So compared to the engage step, you’ll want to spend more time setting up the big story and less time attempting to engage your audience with the little stories.

Written by cplysy · Categorized: freshspectrum

Jan 05 2022

Ask Nicole: Improving Capacity vs. Scaling Up

Have a question you’d like to be featured? Let me know. First off: Happy New Year! Now, let’s get into the topic of improving capacity versus scaling up. This is inspired by a comment I heard several months ago about a colleague’s frustration with their organization’s focus on scaling quickly, with little regard to making […]

The post Ask Nicole: Improving Capacity vs. Scaling Up appeared first on Nicole Clark Consulting.

Written by cplysy · Categorized: nicoleclark

Jan 04 2022

Looking Ahead to 2022: What’s Coming to Depict Data Studio 

2021 was a rough year personally; our family of 5 experienced a million health issues and hospital stays, and the bills afterwards were crushing.

2022 can’t be that terrible. Right? Right??

I’m on a mission to make 2022 as healthy and positive as possible.

There’s lots to celebrate! This is my 10th year of blogging, 10th year of YouTubing, and 8th year of business.

Wondering what I’ve got planned this year? Here’s what’s in store for 2022 related to: 

  • Online Courses, 
  • Private Training, 
  • Data Visualization Consulting, and 
  • Personal and Professional Goals. 

Online Courses 

We’ll continue to offer online learning throughout 2022 (and likely for decades to come!). 

Here are the learning opportunities you can take advantage of this year. 

Soar Beyond the Dusty Shelf Report 

This is our complimentary mini course.  

It’s a why-to mindset course that prepares you for the how-to courses you’ll take later on. 

Have a colleague who’s still writing lengthy technical reports? Still using the software defaults in their charts? This is the course for them! 

It takes 45 minutes to watch the short video lessons and complete the discussion board activities. 

Register for no cost at https://depictdatastudio.teachable.com/.  

Dashboard Design 

Registration is officially going to be open February 14-18, 2022. 

This four-course bundle teaches you to design static and interactive dashboards in Excel and Tableau.  

Most of the resources are focused on static one-pagers in Excel—because those are the dashboards that’ll be most useful for our non-technical or busy audiences. 

Want to take advantage of the early bird bonuses, like the 1:1 consultations and Swag Bags? Shhh don’t tell anyone—early bird registration is available now at https://depictdatastudio.teachable.com/. 

Powerful Presentations 

Need to speak at a conference? Staff meeting? Board meeting? This is the advanced class for you! 

This is our deep dive on slideshows, public speaking skills, and behind-the-scenes tips for both virtual and in-person presentations. 

Registration will be open the week of May 16-20, 2022. 

Simple Spreadsheets 

Need to analyze a new dataset from start to finish? 

In this course, you’ll learn about cleaning and tabulating data (to get it ready for your graphs, dashboards, and more). 

Registration will be open the week of September 12-16, 2022. 

Great Graphs 

Which chart type should you use? How do you make visuals more accessible? 

This is our flagship dataviz course! 

Registration will be open the week of November 14-18, 2022. 

Office Hours 

For the third year in a row, all our Full Courses will include live Office Hours. 

Submit your draft dashboards, slideshows, reports, and more, and get my feedback in a small group setting.  

Office Hours last 30 minutes and are held almost every week. (No Office Hours in June or July—enjoy your summer break!) 

Just want to pick my brain during Office Hours, without joining a course? You can register for the entire years’ worth of Office Hours at https://depictdatastudio.teachable.com/.  

Registration Fees 

Registration will continue to be $997/participant for 2022, which includes lifetime access to the recorded lessons; all the Office Hours taking place in 2022; and additional support like ebooks, digital downloads, our Data Vizards community, and more. 

We also have group rates available. 

Registration fees will increase in 2023. 

Private Training 

Want to bring me in to speak to your team? 

Each year, I lead ~200 private sessions for foundations, nonprofits, universities, and government agencies who work on social good issues. 

Here’s more info about our workshops, which can be held virtually or in-person. 

Virtual Workshops 

I don’t offer full-day Zooms—those are miserable.  

Instead, we provide a series of 2-hour sessions that are spaced a week apart (e.g., four Tuesday afternoons in a row). 

I’ll review your sample materials. You’ll tell me more about your staff. We’ll put our heads together and craft a custom agenda that’s just right for your organization. 

Learn more at https://depictdatastudio.com/virtual-workshops/.  

Ann K. Emery working at the Depict Data Studio world headquarters.

In-Person Workshops 

I’m vaxxed, boosted, and happy to wear a mask for the entire time that I’m in your office.

Availability is limited, and my schedule tends to fill months in advance.  

Learn more at https://depictdatastudio.com/workshops/.  

Data Visualization Consulting 

Want our team to create your report, slideshow, dashboard, or infographic? 

We can refer you to our team of hand-picked experts. 

Personal and Professional Goals 

This year, I’m attempting my most lofty goal yet: To take the entire summer off to be with my 3 kids. A European summer, if you will.

Communicating data more effectively through data visualization–while using everyday software–is absolutely my professional purpose. But I don’t have to teach dataviz 365 days a year to make a positive impact on the community.

Taking the summer off is easier said than done when your schedule stays as full as mine.  

It requires a year of planning in advance—to make sure you schedule your conference keynotes, private trainings, and online courses with the K12 school calendar in mind. 

It requires automation (a multi-year goal, which is mostly finished at this point). Everything that can be automated has been automated. For example, when we hold private client trainings, the staff RSVP to a Zoom registration page… they automatically get enrolled in our Teachable learning platform… they get access to our Excel How-To files and ebooks via Gumroad… they get welcome messages via ConvertKit… and Zapier holds all the pieces together like glue behind the scenes. If done manually, these tasks would require an extra 10-20 hours of a staff member’s time per client workshop. Now that I’ve solved all the technical riddles, they happen almost instantly. 

It requires careful staffing and careful contractors. It requires payroll automation, and ongoing training, and having instructions and checklists for all the manual tasks. 

It requires letting go. I’m capable of having one of the highest-read blogs in the world. I’m capable of having millions of YouTube subscribers. I’m capable of building a podcast, or writing books, or even of becoming TikTok famous. I know exactly what’s required to do all those things, but I’m choosing not to do them—or do them more slowly. That’s the hardest part for a high-achiever like me. 

Novice Ann would’ve argued, “But you can do both! You can be a mom and a YouTuber!” 

Experienced Ann knows what’s involved. You can have anything, but you can’t have everything, and not all at the same time. And you can’t do everything simultaneously at elite levels. It’s impossible to be the best blogger ever and the best mom ever at the same time; both require more than a full-time workload and 24/7 mental energy. 

I’ll remain committed to the core aspects of Depict Data Studio—our online courses, private trainings, and dataviz consulting. 

But the “hobby” aspects of business—the optional blog posts, YouTube videos, podcasts, books, and social media posts—will take a backseat so I can move kid time to the front seat. A worthwhile tradeoff.  

Your Turn 

What are you focused on in 2022?  

Are you hoping to learn a new software program? Automate part of your process? Achieve a personal goal?  

Comment anytime and let me know! 

Written by cplysy · Categorized: depictdatastudio

Jan 03 2022

RK&A is hiring! Project Coordinator

Image of a signboard that says "Join Our Team" in big block letters.

For more than 30 years, RK&A has served as a premier planning, evaluation, and research firm, supporting hundreds of museums and informal learning organizations.  We are seeking a Project Coordinator to join our dynamic team.  The Project Coordinator will provide administrative and operational support to our team of researchers and play a wide range of roles in both qualitative and quantitative research, focusing on logistics.  

RK&A is remote-first with team members distributed along the East Coast (just north and south of Washington, DC).  As a small, tight-knit team, we collaborate daily and require flexibility.  The Project Coordinator is a remote position; however, we will prioritize applicants who reside in the mid-Atlantic region and especially within the DC-Maryland-Virginia (DMV) area specifically (where the majority of our projects take place) so they can assist with occasional in-person project tasks and participate in special in-person team meetings and retreats.  The Project Coordinator is a salaried position of $44,000-$49,000 (commensurate with experience) plus a generous benefits package, including health insurance and 401K.  RK&A will provide the necessary equipment to perform job duties (e.g., a computer), to be used for business purposes only.

Responsibilities will include:

  • Coordinate across team members and project schedules to keep workflow on track
  • Organizational set-up for new projects, including scheduling tasks and communication
  • Monitor project timelines (milestones and deliverables), expenses, and equipment
  • Take and maintain notes for meetings, workshops, focus groups, interviews, etc.
  • Recruit, schedule, coordinate, and distribute incentives for focus groups, interviews, and surveys
  • Program surveys, enter and organize data, and assist with data collection management
  • Prepare quantitative and qualitative data for analysis
  • Assist with hiring, scheduling, and monitoring subcontractors
  • Assist with project related paperwork like IRB applications and other permissions
  • Proofread reports and other deliverables for accuracy, quality, consistency, and formatting
  • Support in-house activities like archiving, marketing, and new business proposal materials
  • Support the overall operations of the business with various administrative tasks, as needed

The successful candidate will have:

  • Demonstrated experience coordinating and organizing large amounts of information across multiple complex projects (e.g., using spreadsheets and project management platforms)
  • Attention to detail and able to multi-task, manage, and prioritize
  • Ability to work independently and collaboratively with and across project teams
  • Excellent capabilities with Microsoft Word, PowerPoint, and Excel
  • Experience working with data (qualitative and/or quantitative)
  • Ability to communicate effectively in both written and verbal formats
  • Interest in museums and/or informal education
  • A quiet and appropriate work environment during the workday

Other desirable qualifications/interests include:

  • Have an interest in applied research
  • Experience with Survey Monkey (or other similar online survey platform), Google Workspace, OneDrive, Canva, Asana, or SPSS (or other statistical software)
  • Fluency in a second language (Spanish or Arabic is a plus)
  • Website maintenance experience

Come as you are. RK&A is building towards a more diverse, inclusive, and equitable working environment. If you feel like you don’t have all the qualifications for this position and are willing to use your initiative to learn the rest, we’d still love for you to apply!  Applications will be evaluated with an initial anonymized review (removing name, education affiliations, etc.) aimed at opening this opportunity to more candidates and mitigating unconscious biases in our hiring practices.  Please read the application instructions below closely.

Application Instructions

All applicants should submit a brief PDF cover letter and a PDF resume included as an attachment (please include Project Coordinator in the file names).  We will be using an initial anonymized review process for applications.  As such, please follow these instructions for your cover letter and resume:

  • Do not include your name or pictures on your cover letter or resume
  • Indicate your degree level and content area, but please remove any undergraduate and graduate school names.
  • Generalize company or organization names in your work history (e.g., retail company, history museum, non-profit organization, restaurant) rather than naming specific companies or organizations.  We are more interested in learning about your job skills and responsibilities than where you worked.
  • No references are required at this time.

Please submit your application via email to info@rka-learnwithus.com. We will be reviewing applications on a rolling basis, with plans to hire this position in February of 2022.

The post RK&A is hiring! Project Coordinator appeared first on RK&A.

Written by cplysy · Categorized: rka

  • « Go to Previous Page
  • Go to page 1
  • Interim pages omitted …
  • Go to page 146
  • Go to page 147
  • Go to page 148
  • Go to page 149
  • Go to page 150
  • Interim pages omitted …
  • Go to page 310
  • Go to Next Page »

Footer

Follow our Work

The easiest way to stay connected to our work is to join our newsletter. You’ll get updates on projects, learn about new events, and hear stories from those evaluators whom the field continues to actively exclude and erase.

Get Updates

Want to take further action or join a pod? Click here to learn more.

Copyright © 2026 · The May 13 Group · Log in

en English
af Afrikaanssq Shqipam አማርኛar العربيةhy Հայերենaz Azərbaycan dilieu Euskarabe Беларуская моваbn বাংলাbs Bosanskibg Българскиca Catalàceb Cebuanony Chichewazh-CN 简体中文zh-TW 繁體中文co Corsuhr Hrvatskics Čeština‎da Dansknl Nederlandsen Englisheo Esperantoet Eestitl Filipinofi Suomifr Françaisfy Fryskgl Galegoka ქართულიde Deutschel Ελληνικάgu ગુજરાતીht Kreyol ayisyenha Harshen Hausahaw Ōlelo Hawaiʻiiw עִבְרִיתhi हिन्दीhmn Hmonghu Magyaris Íslenskaig Igboid Bahasa Indonesiaga Gaeilgeit Italianoja 日本語jw Basa Jawakn ಕನ್ನಡkk Қазақ тіліkm ភាសាខ្មែរko 한국어ku كوردی‎ky Кыргызчаlo ພາສາລາວla Latinlv Latviešu valodalt Lietuvių kalbalb Lëtzebuergeschmk Македонски јазикmg Malagasyms Bahasa Melayuml മലയാളംmt Maltesemi Te Reo Māorimr मराठीmn Монголmy ဗမာစာne नेपालीno Norsk bokmålps پښتوfa فارسیpl Polskipt Portuguêspa ਪੰਜਾਬੀro Românăru Русскийsm Samoangd Gàidhligsr Српски језикst Sesothosn Shonasd سنڌيsi සිංහලsk Slovenčinasl Slovenščinaso Afsoomaalies Españolsu Basa Sundasw Kiswahilisv Svenskatg Тоҷикӣta தமிழ்te తెలుగుth ไทยtr Türkçeuk Українськаur اردوuz O‘zbekchavi Tiếng Việtcy Cymraegxh isiXhosayi יידישyo Yorùbázu Zulu