This is the fourth in a series of posts on chart design in Excel. In each post we will take on a different chart type. Today we’ll go with a chart that is widely used but often maligned by chart experts, the Pie Chart.
What you’ll find in this post:
- An Oversimplified How To
- How to create a good looking pie chart.
- When to use a pie chart (and when not to use a pie chart).
- Why pie charts don’t actually suck.
- Some other considerations.
An Oversimplified How To
Creating a pie chart (a.k.a. pie graph) is really simple in Excel. It just takes a column of data and a couple of buttons.
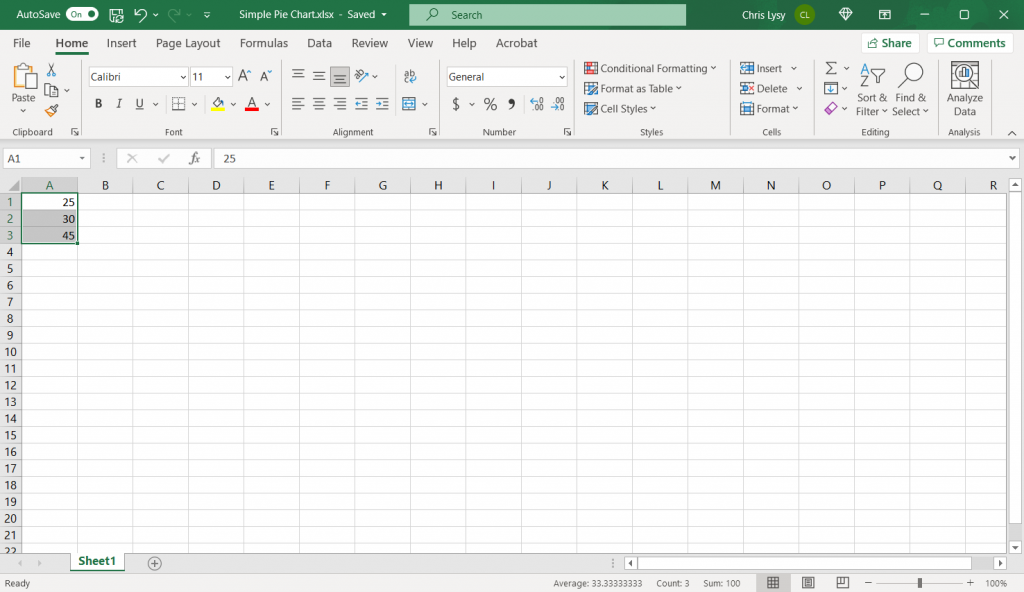
Step 1. Highlight a column of numbers.
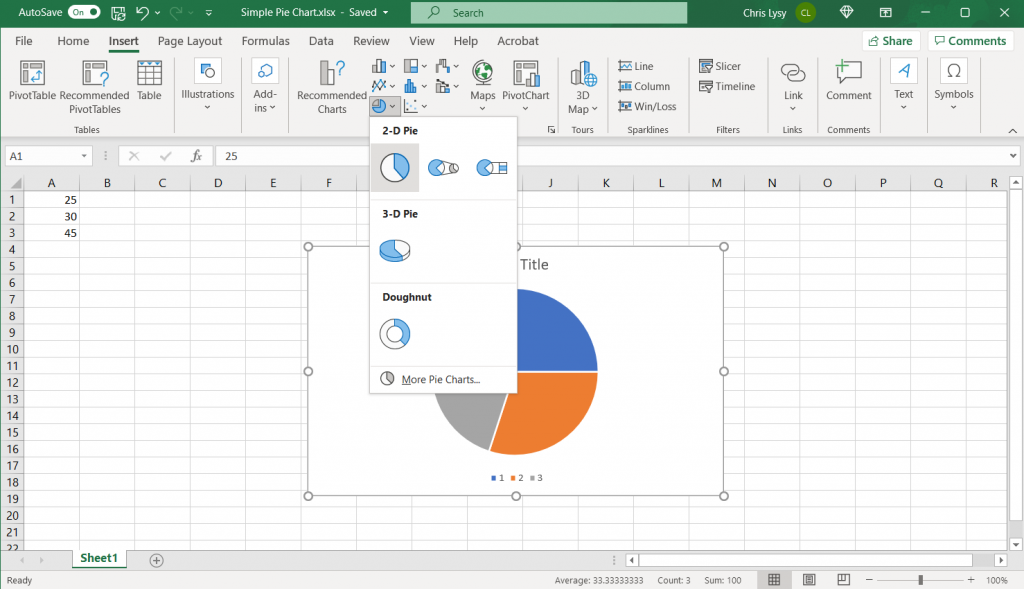
Step 2. Click on the insert tab, then the pie chart icon. Then select the first 2-D Pie.
*If you have any instinct to click the 3-D Pie button, resist that instinct. 3-D will distort the data.
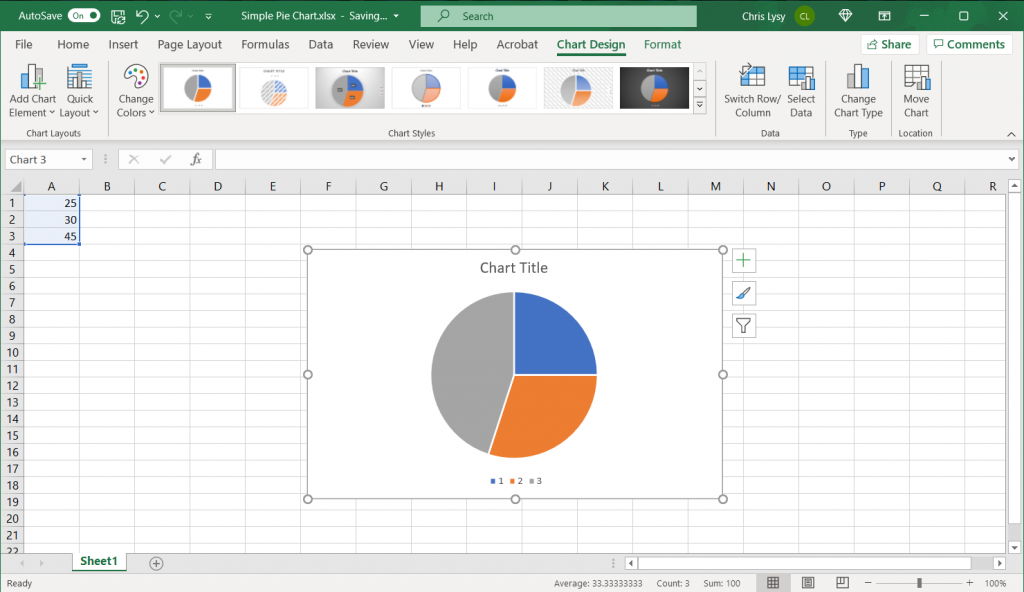
Step 3. Woohoo, you created a pie chart!
How to create a good looking pie chart.
Okay, so that’s the most basic of basics. Here are some more steps you probably want to take to create something worth sharing.
Labeling your graph.
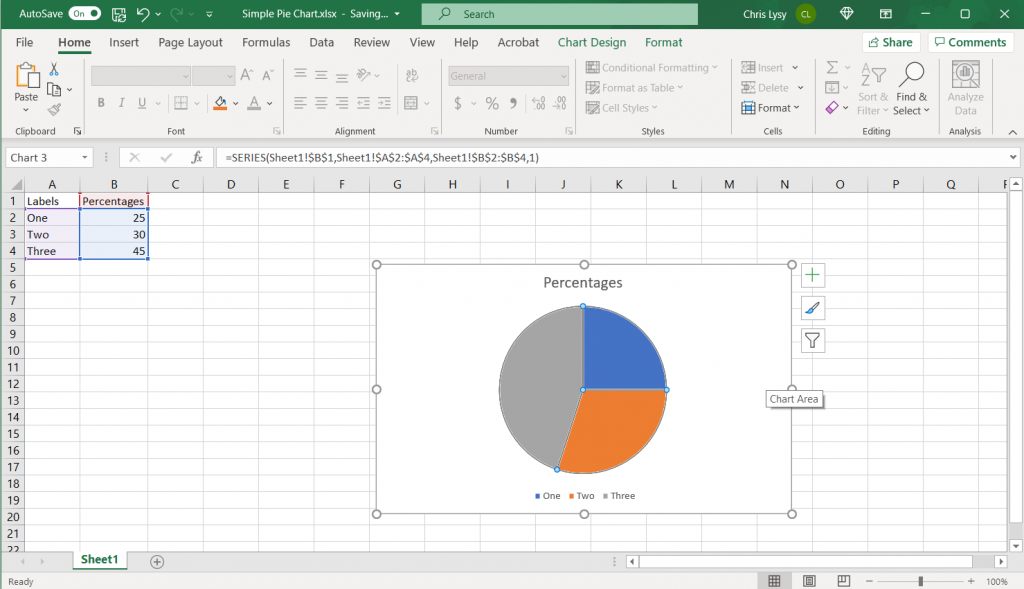
So in addition to just a column of numbers it’s a good idea to have row labels and column headers. Lots of pie charts are created using percentages that add up to 100. I’ll just pretend my data is real and not fake.
Directly Label the Pie Chart Portions
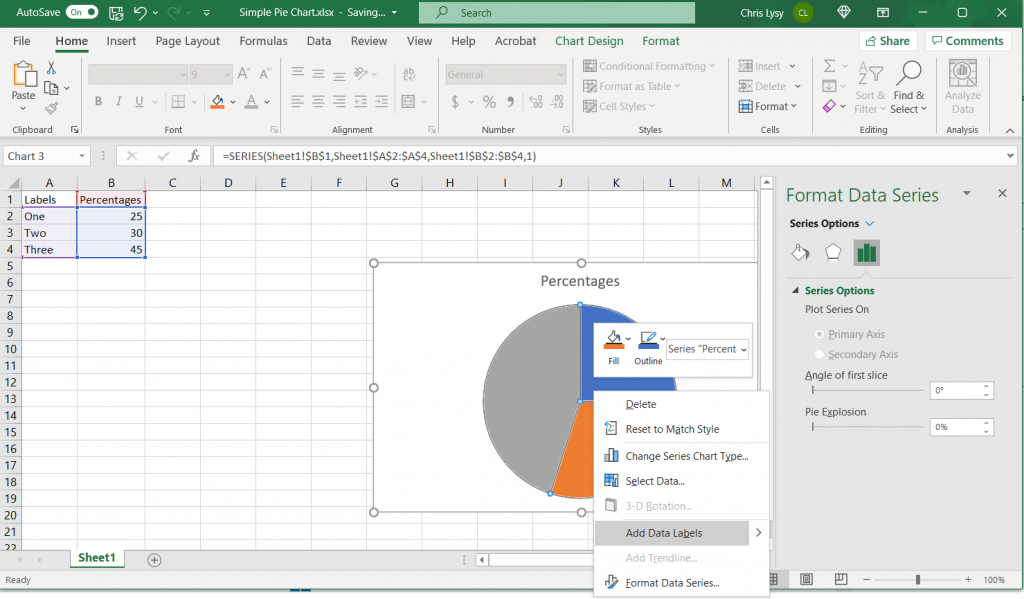
I don’t like the legend at the bottom. So I’m going to delete that (click on the legend and press the delete button) and then directly label the pie chart portions. You do this by right clicking on the pie chart and selecting “Add Data Labels” from the menu.
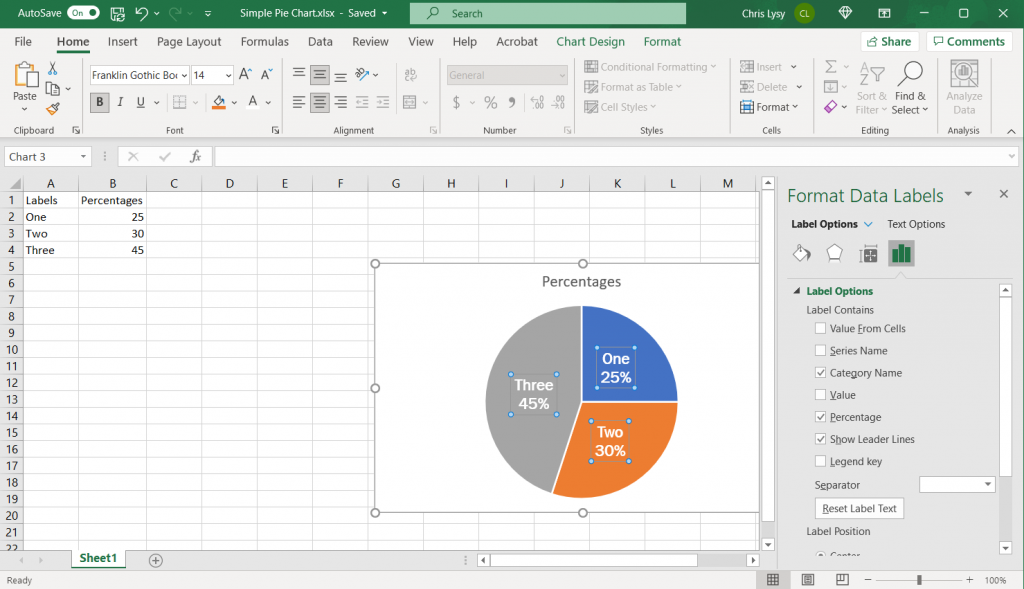
Changing the Label Position
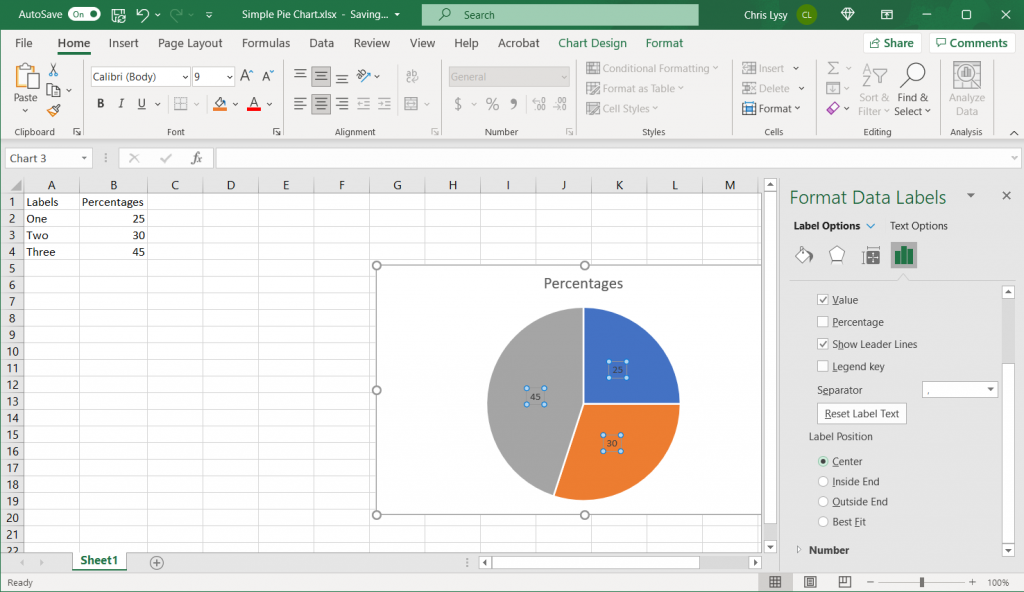
The labels need more work. I don’t like Excel’s “Best Fit” so I’m going to change the label position. Just right click on the label and select “Format Data Labels” to bring up the menu.
Adding the Category Name to the Data Label
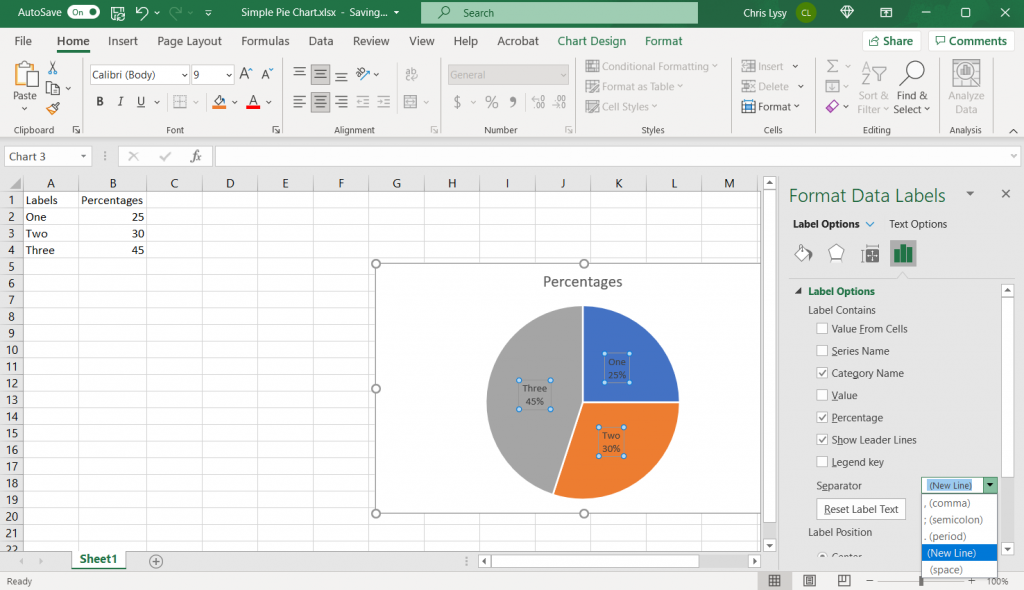
I also want to add the category name to the label. In the same Format Data Labels menu as the previous step, just click on the Category Name box. I’m also going to unclick the “Value” box and click on the “Percentage” box. Then add a “(New Line)” separator.
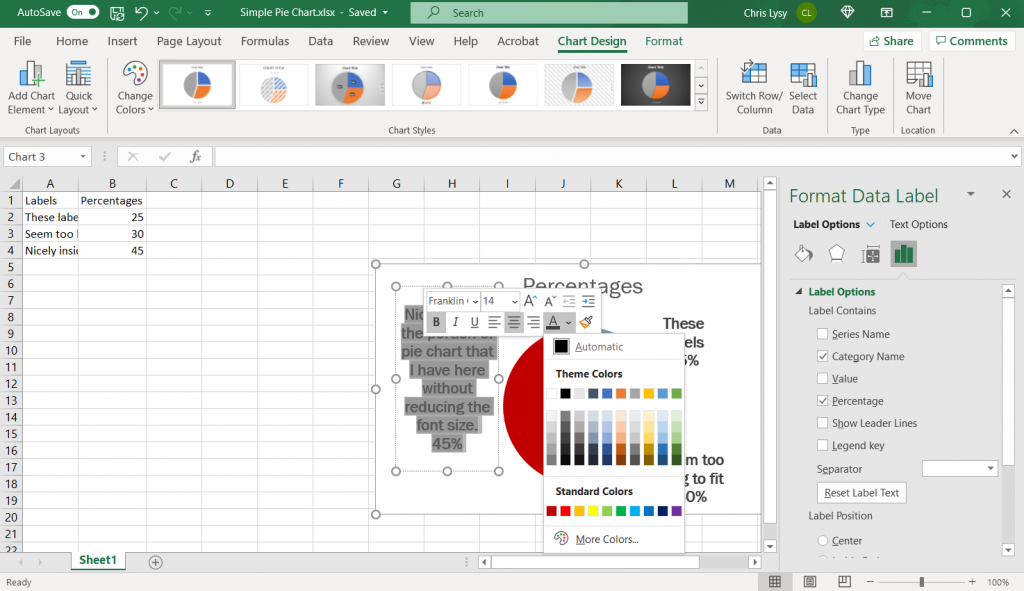
Format Data Labels Color and Font
While I have the data labels selected, I’m going to move to the top of the page and change the font, font size, and data label color.
Changing Colors with Intention
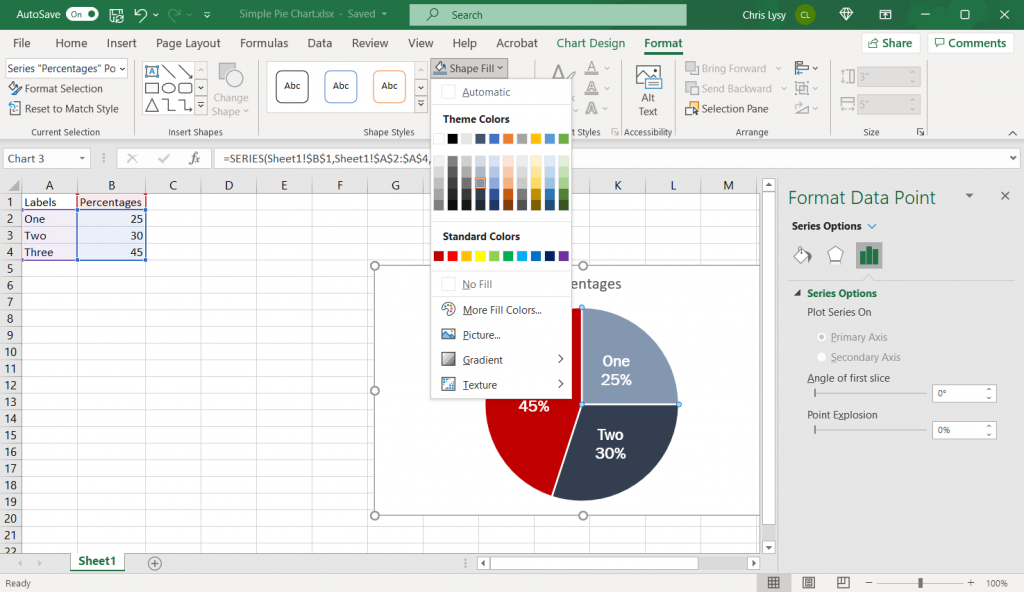
I also want to change the pie chart colors off the default. I like using a highlight color when possible (especially when I am going to discuss the chart in the body of a text). I’ll use a strong color (say red) for the highlight. Then I’ll draw from a gray scale for the other two segments.
If you think this might get printed in black and white, I suggest pulling the 3 colors from different color rows. So in my case, the darkest red, the second darkest gray/blue, and the third darkest gray/blue.
Taking away the outline.
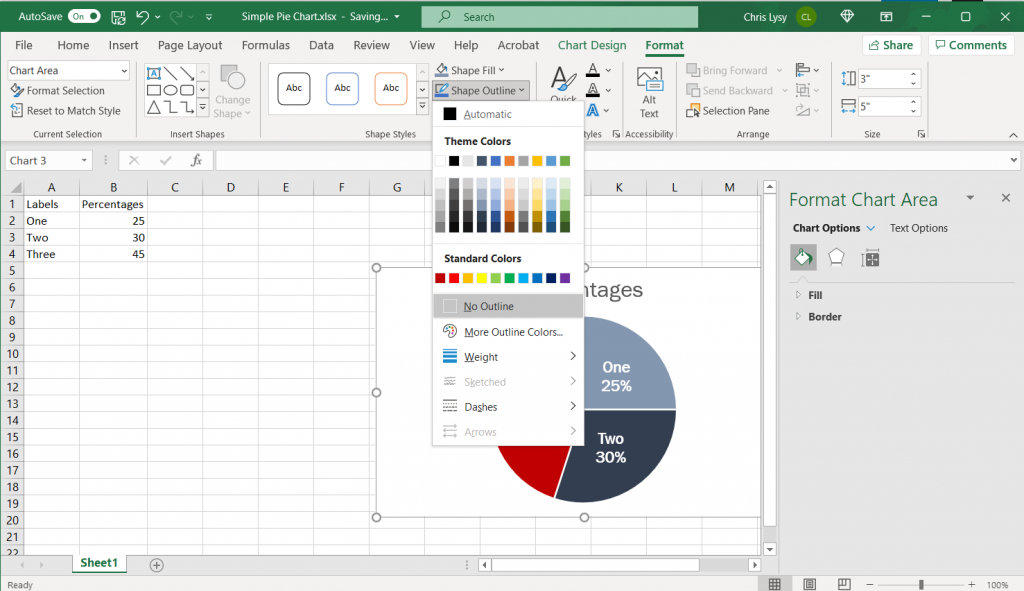
If you plan to copy this chart into another type of document, I suggest taking away the random chart outline Excel puts in by default. Just click on the chart box, and then select “No Outline.”
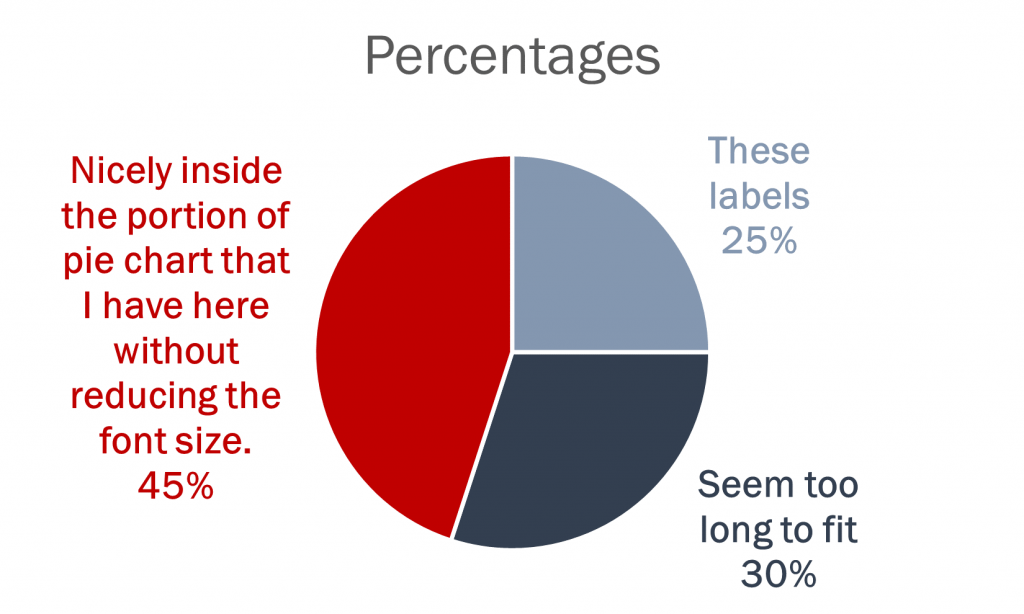
What if your pie chart category labels are too long?
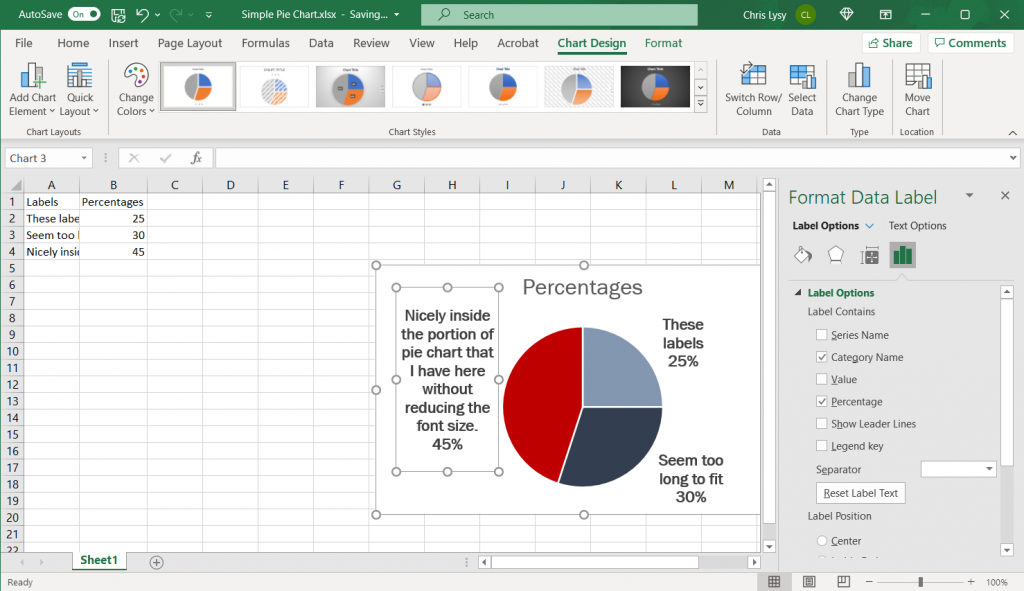
If your category labels are too long to fit inside your pie chart, switch the label position to the outside. You also might need to extend the default textbox to show all the included text, and maybe shift it around the chart.
Color matching your labels to your pie chart segments.
Depending on the colors you are using for your pie chart (and the number of slices), you might choose to adjust the color of the text to match each slice. This is best when you only have a few slices (which is really best with pie charts in general).
Saving the Image
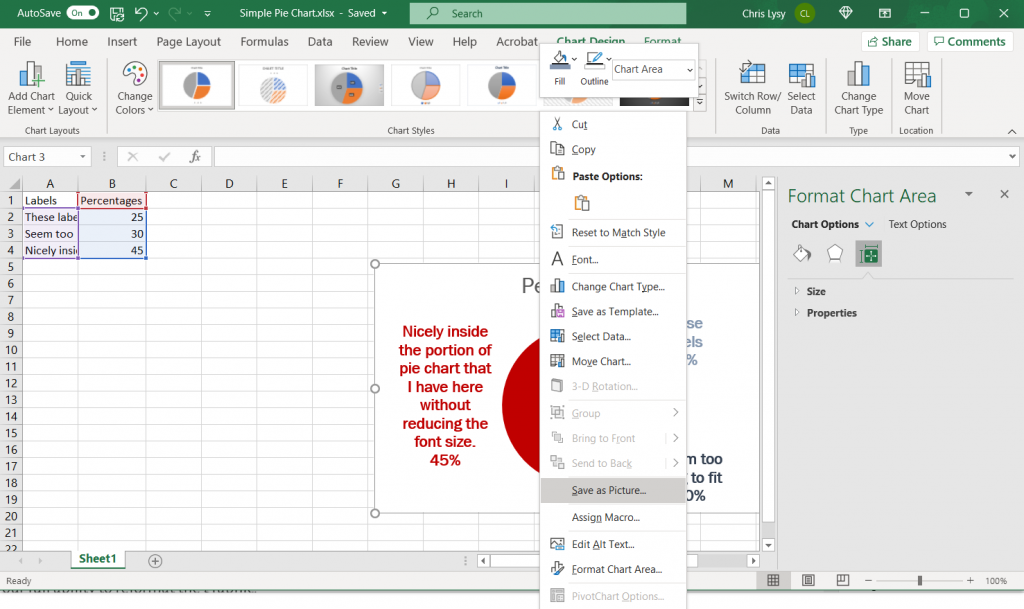
Once you have made all the changes you want to the chart you can save it as a picture. Just right click on the chart area and click “Save as Picture.”
Alternatively, you can just copy and paste the chart from Excel into Word or PowerPoint. If you’re staying within the Office suite, this is the ideal way to move the image as it retains your full ability to reformat the graphic.
Beyond the Basics
Generally though I suggest keeping the chart itself simple and minimalist. You can always add flare through annotations/additional graphics. Doing things like making your charts 3D doesn’t help the presentation, it just makes the chart harder to interpret and can also skew the data.
When to use a pie chart (and when not to use a pie chart).
Pie charts are used to break down things.
Take for instance, a budget. Let’s say you want to have a visual showing the break down of the budget into 4 different spending categories. You can certainly use a pie chart for that, as long as you don’t need your audience to precisely compare the sections.
In other words, you just kind want to show the gist of how a budget is broken down without getting into the comparison weeds.
Pie charts are probably better than any other visual for expressing a part-to-whole relationship. When you hear “percent of…” or “part of…” that’s one indication a pie chart could meet your needs.
So when shouldn’t you use a pie chart?
A lot of the time. If you wanted to have a default chart that you used over and over again, you would be better off with a bar chart. A bar chart is going to make comparing categories easier. It’s just way more precise.
But not every design choice is about visual precision.
Pies and doughnuts fail because:
Quantity is represented by slices; humans aren’t particularly good at estimating quantity from angles, which is the skill needed.
Matching the labels and the slices can be hard work.
Small percentages (which might be important) are tricky to show.
The University of Melbourne Statistical Consulting Centre – Why you shouldn’t use pie charts
Why pie charts don’t actually suck.
I really like this quote by data journalist and artist Mona Chalabi,
On a computer, data looks slick. I draw over it to show that data isn’t always precise. The lines aren’t completely straight to show that there is a margin of error in all data sets.
Fast Company – To tell the real story, data journalist Mona Chalabi draws imperfect lines
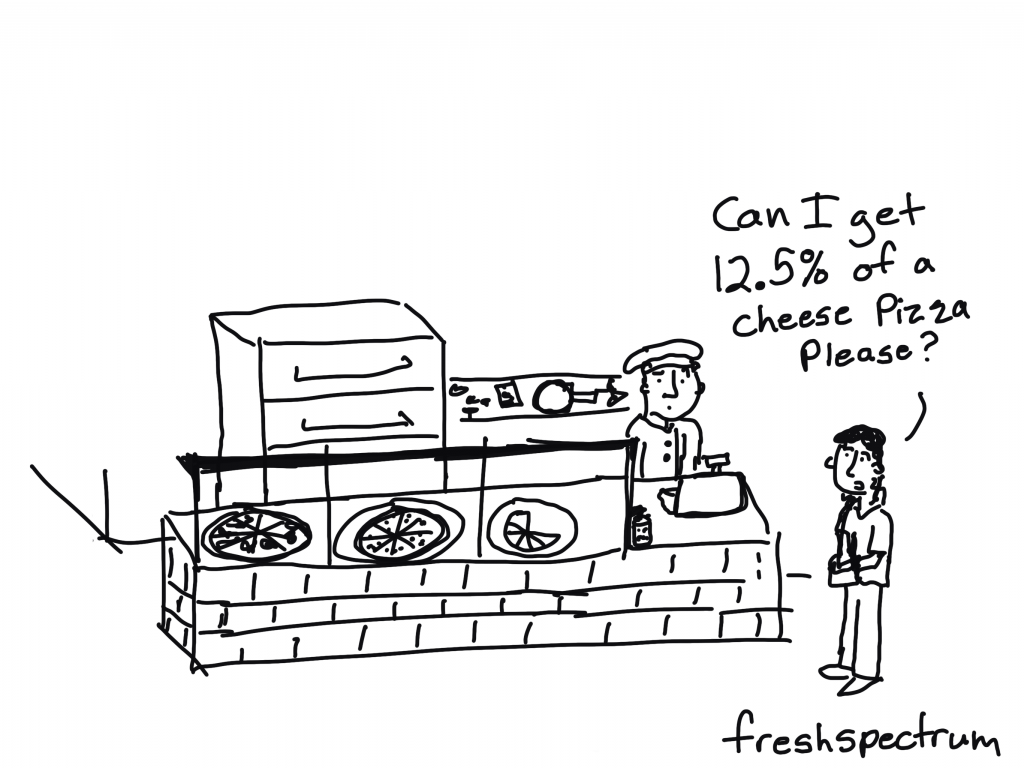
Hang out with enough data visualization people and you’ll hear a lot of pie chart hate. That hate inspired the following cartoon a few years back, and it’s still a regular holiday favorite among my cartoon fans.
But I think the hate is a bit overdone.
I mean check out this pie chart I pulled from Wikipedia’s entry on US Government Spending.
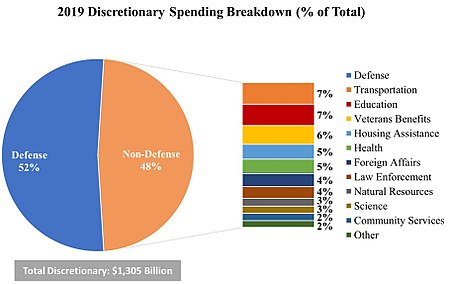
We’re not looking at this chart to compare the differences in the amount of discretionary funding between Law Enforcement and Foreign Affairs. The basic gist of the chart is this, the US budgets over half of it’s discretionary funds to defense, more than all those other categories combined.

One of the dangers of charts is that you can make a dataset look far more precise than it ever should look. And in those cases (such as in surveys with low response rates) maybe stepping back your level of visual precision isn’t such a bad thing.
Other Considerations
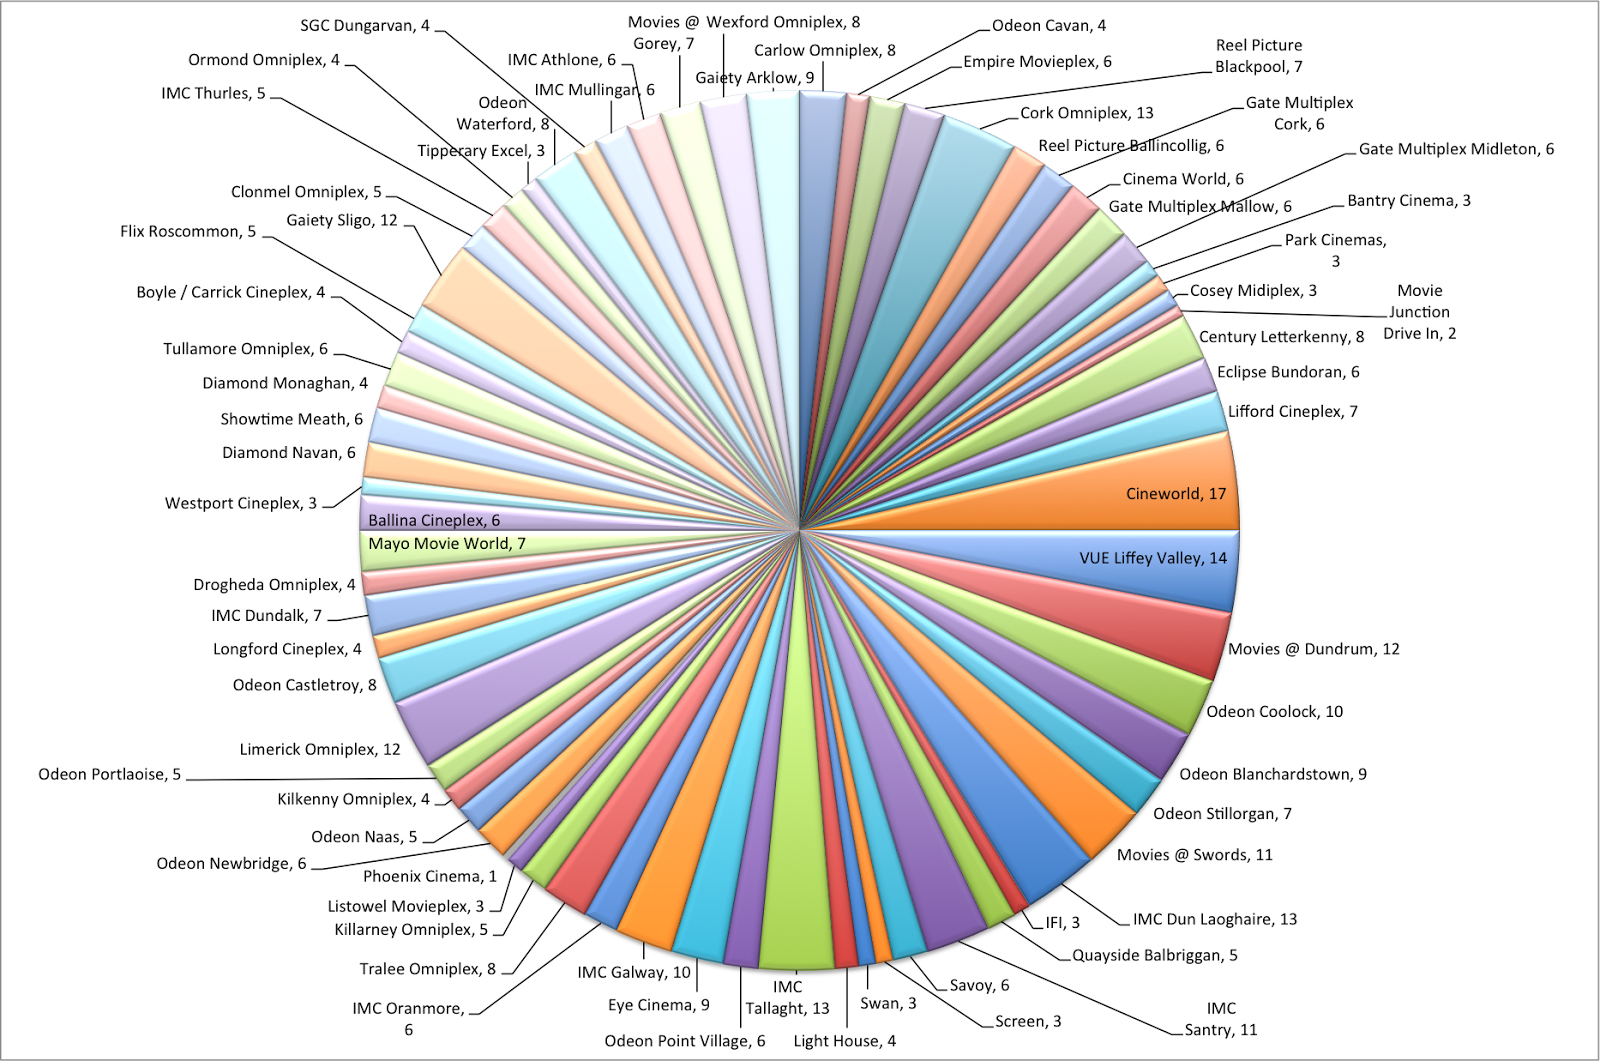
How many slices?
I tend not to like charts that use any more than a few. 2 or 3 slices tend to work best. Unless your point is that a single slice makes up most of the chart, and you have a bunch of itty bitty little slices there to prove their unimportance.
Create Small Multiples
Resist the urge to create big confusing charts. Most of the time, you are far better off creating multiple simple charts.