• Skip to main content
  • Skip to footer
  • Home

The May 13 Group

the next day for evaluation

  • Get Involved
  • Our Work
  • About Us
You are here: Home / Archives for cplysy

cplysy

Apr 13 2022

Better Report Design or Faster Report Design? Pen and Paper Activity

So what’s better, creating one great report or ten good reports?

In an ideal world we would have ample time to plan, write, develop, illustrate, test, and iterate our evaluation reports. But that’s likely not the professional world you occupy (and it’s certainly not the world I occupy).

Freshspectrum cartoon by Chris Lysy. "We have an award winning internal design team. I suggest getting in touch no less than 3 years before the report is due."

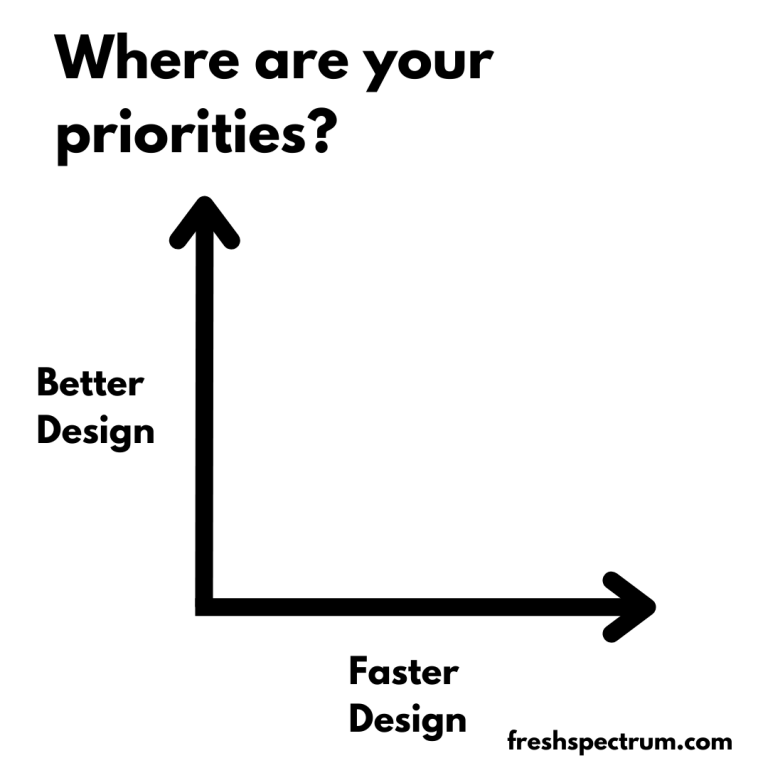
I decided to try out a little activity at the beginning of my workshop session last week. I drew a simple x and y axis. On one axis I wrote “better design” and on the other axis I wrote, “faster design.” Then I asked everyone to find where they were on the grid now, and where they hope to be later.

What are your priorities graph.  Better design by faster design.

The “short activity” ended up taking most of our session. Because the answers were fascinating.

I think in the field of data visualization and report design the general argument you’ll find is, “good design takes time.” So if you want to prioritize good design, you need to budget more time. But what if you don’t have more time, and you’re not likely to get more time for your next report either?

Wouldn’t it be a good idea to learn how to create better reports in less time?

What are your priorities graph.  Better design by faster design.
Slower Design & Better Design (Great report but takes a lot of time to produce)
Slower Design & Worse Design (Ugly/boring and takes a lot of time to produce)
Better Design & Faster Design (Great report quickly produced)
Worse Design & Faster Design (Ugly/boring but quickly produced.

So I want you to try this little activity. On a sheet of paper draw an x and a y axis. On the Y, write “Better Design” and on the X, write “Faster Design.”

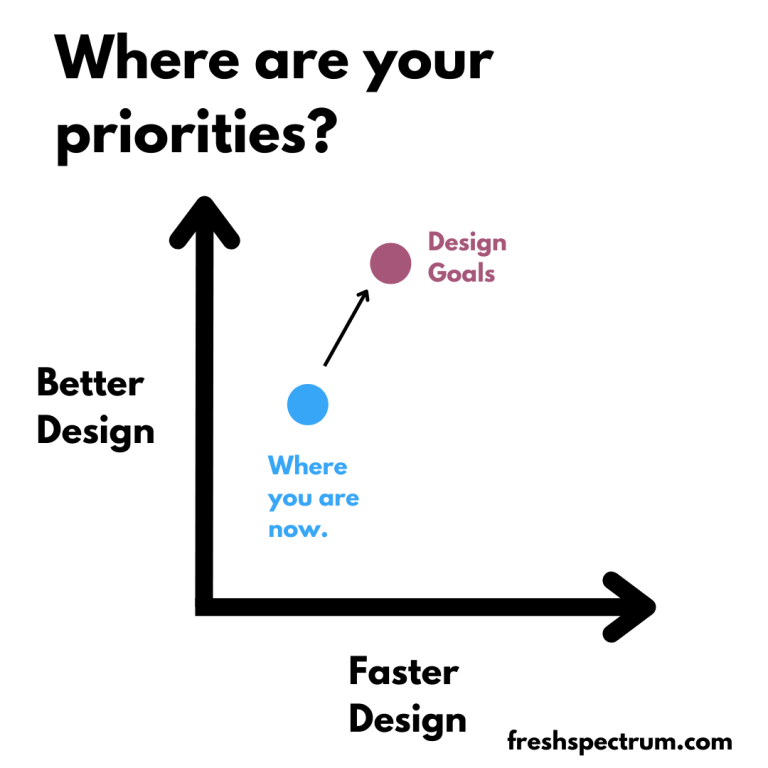
Next, draw two points.

The first point is where you think you are right now. Are you a good designer, fast designer, both, neither? The scale is completely yours to decide.

For the second point, draw where you would like to be in the future. As you improve your design skills, do also see yourself committing more time to reporting? If so, your overall design speed might go down.

What are your priorities graph.  Better design by faster design. Marked with "Where you are now" and "design goals."

So why ask the question?

Because better design isn’t always slower design. Sometimes being the better designer is being able to create more reports and reach more audiences in a shorter time period.

Spending a lot of time on your reports is a design choice. Deciding between one great report and ten good reports, that’s a choice you make.

How do you design better?

Short answer, practice and support.

It might not be the answer you were hoping to find, but becoming a better designer just takes a lot of practice. The more practice, the better.

And if you are an organization hoping to grow your team’s data design skills, provide them with support. Give your team opportunities to try new things and get more practice. And seek to eliminate any bureaucratic procedures that may be inhibiting your team’s creativity.

How do you design faster?

Short answer, assets and process.

I have subscriptions Adobe CC and Office 365. I have designed high quality reports and infographics using Adobe Illustrator, InDesign, XD, Sketch, and PowerPoint. But most of the time I choose to use Canva.

It’s not that Canva is a superior graphic design tool. But the access to a huge library of assets (stock photos, icons, templates) speed up my ability to create better design, faster. And often, much faster.

If you want to design faster, surround yourself with assets and develop a streamlined creative process.

And if you are an organization hoping to speed up your team’s data design production, give them assets. Easy to use templates, lots of stock photos, and pre-branded icon libraries. And give them the training and support they need to use the tools.

Written by cplysy · Categorized: freshspectrum

Apr 13 2022

Criteria Based Ranking in Developmental Evaluation

Developmental Evaluation is widely implemented and the preferred option for programs that address complex problems such as poverty and homelessness. There is a growing body of literature on Developmental Evaluation (DE) and more and more evaluators are embracing this approach (myself included!).  

For the past six months, my colleagues and I have been involved in DE. We have helped a client make important decisions using multiple evaluation tools, including surveys, document reviews, and Criteria Based Ranking (CBR).

In this article, I will explain what Criteria Based Ranking is and how we used it in Developmental Evaluation.  


What is Criteria Based Ranking?

CBR is a much simpler form of Multiple-Criteria Decision Approach, which comes from operational research, a discipline that deals with the development and application of advanced analytical methods to improve decision-making.   

Both CBR and Multiple-Criteria Decision Approach evaluate multiple and often conflicting options, such as cost versus quality. For example, in a publicly funded healthcare system, when comparing the benefits of a new drug to the status quo, decision makers need to weigh the health benefits and economic impact of both options. It is difficult to compare cost versus effectiveness directly. CBR allows us to have a final numerical number (rank), while accounting for both criteria.    

For the DE project, we are supporting a team of community leaders that aim to improve services for seniors within the city. The decision they were confronted with was: out of the many problems and challenges seniors face, which ones should the project prioritize and use in their engagement strategy? To address this question, we first completed a document and literature review and identified 20 priority areas.  

Next, we helped them further narrow down the priority areas using a simple form of CBR. 


How to use Criteria Based Ranking in Developmental Evaluation

In CBR, the first step is determining relevant criteria you would like to use. In the healthcare example above, impact on health status (i.e., survival rate and quality of life) and on health care cost (i.e., cost of drug and estimated cost-savings of future healthcare cost) can be used to compare the new and the status quo drugs, and arrive at a final score.

Next comes assigning a value for each criterion. For our DE project, the criteria the stakeholders picked were equity, feasibility, urgency, and potential for joint action and they decided that each of the criteria were equally important so were given the same weight. However, depending on the priority of the DE project, higher value can be assigned to some criteria if they are determined to be of higher importance relative to the other criteria.  

The final step in CBR is assigning numerical values to determine a rank. At this stage participants individually rate each of priority areas using the different criteria. 

For our DE project, using an online survey platform, we asked the stakeholders to rate the 20 priority areas from low to high using the four criteria shown below.  

We completed the analysis, and the results were surprising. Out of the 20 priority areas, the ones that stakeholders felt were sure to top the list were ranked lower and vice-versa. These results show that topic areas that often grab attention are not necessarily the ones that will be prioritized when using common principles (criteria).


Criteria Based Ranking is one tool evaluators can use to facilitate critical thinking and some level of precision in decision making, in Developmental Evaluation and other types of evaluations.

Check our other articles on Developmental Evaluation here, and here. If you have used CBR in your evaluation work, tell us about it in the comments.


Sign up for our newsletter

We’ll let you know about our new content, and curate the best new evaluation resources from around the web!


We respect your privacy.

Thank you!


Written by cplysy · Categorized: evalacademy

Apr 11 2022

How to Present Dense Data Visualizations (Without Losing Your Audience)

Ten years ago, I had terrible insomnia.

I was working full-time and finishing graduate school at night.

My stress came out as insomnia.

I’d get tired of laying in bed… and go make YouTube videos. 😊

For me, being up in the middle of the night + making YouTube videos = intertwined.

I was up in the middle of the night again to speak at the Present to Succeed Conference (it’s mostly a European conference – different time zones).

I woke up at 3, presented at 4, and decided to make a YouTube video for you at 5.

Ann K. Emery from Depict Data Studio is smiling at her desk in her home office.
The wee hours of the morning at the Present to Succeed Conference

I was up anyway, and I wanted to share some highlights from the conference session with you. Enjoy!

Watch a 16-Minute Segment

In the conference session, we learned about avoiding Death by PowerPoint by storyboarding.

Instead of presenting a single graph all at once, we’d explain the graph one piece at a time.

Here’s what’s inside.

How to Edit the Existing Graph

In the video, you’ll learn about:

  • adding target lines (if/when that applies to your project);
  • grouping data with space (top vs. bottom categories);
  • grouping data with color (blue vs. gray categories);
  • adding words to explain our categories; and
  • adding icons to increase memorability.

How to Storyboard the Graph

In the video, you’ll see me turn on my presentation voice and give a mini presentation.

I talk through the graph one piece at a time.

Behind the Scenes in My PowerPoint

In the video, you’ll see how I:

  • make the finished graph;
  • copy and paste that slide; and
  • delete or hide one thing.

I’ve got all sorts of not-so-magical magic tricks: deleting icons and text boxes; adding white rectangles to cover words; changing the color of some bars to make them transparent; and deleting some of the numeric labels.

When It’s Worth Storyboarding Your Dense Graph

You don’t have to break up every graph across multiple slides.

I use storyboarding:

  1. at the beginning of a presentation (to start with a bang), and
  2. to explain dense, complex visualizations one piece at a time.

Bonus

Download my PowerPoint slides and explore them on your own.

Your Turn

If or when you apply this technique, get in touch! I’m cheering for you.

Written by cplysy · Categorized: depictdatastudio

Apr 10 2022

Una fundamentación del desarrollo de la capacidad de evaluación en la teoría de sistemas

Tras una decada de trabajo en Desarrollo de Capacidades en Evaluacion (ECD) en el Instituto Alemán para la Evaluación del Desarrollo (DEval), algunos de los miembros del proyecto Focelac+ (Sarah D. Klier, Raphael J. Nawrotzki, Nataly Salas-Rodríguez y Sven Harten), con la colaboracion de especialistas en teoría de sistemas (Charles B. Keating y Polinpapilinho F. Katina), han escrito un articulo (abril de 2022) sobre la práctica en ECD, fundamentarla desde la teoría de sistemas. El artículo “Fundamentación del desarrollo de la capacidad de evaluación en la teoría de sistemas” ilustra cómo aquellos que trabajen en el desarrollo de la capacidad en evaluación pueden utilizar la teoría de sistemas como una herramienta conceptual para obtener una mejor comprensión del funcionamiento y las interrelaciones presentes dentro de un sistema de evaluación determinado. Este post es un extracto de ese artículo.

Si bien el “pensamiento sistémico” es popular en el contexto del desarrollo de capacidades y la evaluación, no hay una comprensión profunda acerca de los beneficios de emplear la teoría de sistemas en el desarrollo de capacidades de evaluación. La teoría de sistemas proporciona una orientación útil para el trabajo relacionado con sistemas complejos (por ejemplo, sistemas de evaluación nacional).

Este artículo ilustra cómo l@s evaluador@s y profesionales del desarrollo de capacidades de evaluación pueden utilizar la teoría de sistemas como una herramienta conceptual para obtener una mejor comprensión de los aspectos funcionales y las interrelaciones presentes dentro de un sistema de evaluación dado. Específicamente, la perspectiva de la teoría de sistemas puede ayudar a dilucidar las razones del éxito o fracaso de un determinado programa o actividad de desarrollo de capacidades de evaluación. Con el objetivo de motivar a l@s evaluador@s y profesionales del desarrollo de capacidades de evaluación a utilizar la teoría de sistemas en su trabajo, este artículo presenta un marco de teoría de sistemas para el desarrollo de capacidades de evaluación y ofrece ejemplos prácticos de cómo se puede adoptar.

Como ejemplo práctico, este artículo se basa en el trabajo de desarrollo de capacidades de evaluación realizado en el DEval, que tiene el mandato del Ministerio Federal Alemán de Cooperación Económica y Desarrollo (BMZ) para evaluar la cooperación para el desarrollo financiada por el BMZ.

El desarrollo de la capacidad de evaluación se ha llevado a cabo en DEval durante casi 8 años. Las evaluaciones externas y los datos del sistema de monitoreo y evaluación de DEval muestran que sus proyectos de desarrollo de capacidades de evaluación son exitosos. Este éxito se puede atribuir en parte al uso implícito de la teoría de sistemas, que informan la mayoría de las aplicaciones de desarrollo de capacidades de evaluación en DEval.

La teoría de sistemas se ha utilizado con éxito y de manera más formal en los campos del desarrollo de capacidades (por ejemplo, Fisher, 2010; Morgan, 2005) y evaluación (por ejemplo, Reynolds et al., 2016; Williams e Imam, 2006). Además, diversos estudios han reconocido su utilidad potencial en el contexto del desarrollo de capacidades de evaluación (Krapp y Geuder-Jilg, 2018; Ortiz Aragón y Macedo, 2010).

Sin embargo, la literatura actualmente no contiene ninguna descripción de cómo integrar sistemáticamente el trabajo de desarrollo de capacidades de evaluación en la teoría de sistemas. Esta es una omisión crítica, ya que dicha información podría proporcionar una orientación para que los profesionales del desarrollo de la capacidad de evaluación basen su trabajo en consideraciones teóricas, con muchos beneficios adicionales. Este artículo aborda esta brecha al proporcionar la primera descripción teórica de cómo las actividades de desarrollo de capacidades de evaluación y los componentes del programa pueden anclarse en la teoría de sistemas, ilustrada con ejemplos prácticos del trabajo en DEval.

Referencias tomadas del articulo

Fisher C (2010) Between pragmatism and idealism: Implementing a systemic approach to capacity development. IDS Bulletin 41(3): 108–17.

Krapp S and Geuder-Jilg E (2018) Evaluation Capacity Development: A Systemic Project Approach by Deval in Latin America. DEval Policy Brief 7/2018, Policy Brief. Bonn: German Institute for Development Evaluation.

Morgan P (2005) The Idea and Practice of Systems Thinking and Their Relevance for Capacity Development. Maastricht: European Centre for Development Policy Management.

Reynolds M, Gates E, Hummelbrunner R, et al. (2016) Towards systemic evaluation. Systems Research and Behavioral Science 33(5): 662–73.

Written by cplysy · Categorized: TripleAD

Apr 10 2022

Comment on Dissertation RQ2: To what extent do interpersonal factors relate to use beyond research factors? by полное описание

полное описание

blog topic

Written by cplysy · Categorized: danawanzer

  • « Go to Previous Page
  • Go to page 1
  • Interim pages omitted …
  • Go to page 131
  • Go to page 132
  • Go to page 133
  • Go to page 134
  • Go to page 135
  • Interim pages omitted …
  • Go to page 304
  • Go to Next Page »

Footer

Follow our Work

The easiest way to stay connected to our work is to join our newsletter. You’ll get updates on projects, learn about new events, and hear stories from those evaluators whom the field continues to actively exclude and erase.

Get Updates

Want to take further action or join a pod? Click here to learn more.

Copyright © 2026 · The May 13 Group · Log in

en English
af Afrikaanssq Shqipam አማርኛar العربيةhy Հայերենaz Azərbaycan dilieu Euskarabe Беларуская моваbn বাংলাbs Bosanskibg Българскиca Catalàceb Cebuanony Chichewazh-CN 简体中文zh-TW 繁體中文co Corsuhr Hrvatskics Čeština‎da Dansknl Nederlandsen Englisheo Esperantoet Eestitl Filipinofi Suomifr Françaisfy Fryskgl Galegoka ქართულიde Deutschel Ελληνικάgu ગુજરાતીht Kreyol ayisyenha Harshen Hausahaw Ōlelo Hawaiʻiiw עִבְרִיתhi हिन्दीhmn Hmonghu Magyaris Íslenskaig Igboid Bahasa Indonesiaga Gaeilgeit Italianoja 日本語jw Basa Jawakn ಕನ್ನಡkk Қазақ тіліkm ភាសាខ្មែរko 한국어ku كوردی‎ky Кыргызчаlo ພາສາລາວla Latinlv Latviešu valodalt Lietuvių kalbalb Lëtzebuergeschmk Македонски јазикmg Malagasyms Bahasa Melayuml മലയാളംmt Maltesemi Te Reo Māorimr मराठीmn Монголmy ဗမာစာne नेपालीno Norsk bokmålps پښتوfa فارسیpl Polskipt Portuguêspa ਪੰਜਾਬੀro Românăru Русскийsm Samoangd Gàidhligsr Српски језикst Sesothosn Shonasd سنڌيsi සිංහලsk Slovenčinasl Slovenščinaso Afsoomaalies Españolsu Basa Sundasw Kiswahilisv Svenskatg Тоҷикӣta தமிழ்te తెలుగుth ไทยtr Türkçeuk Українськаur اردوuz O‘zbekchavi Tiếng Việtcy Cymraegxh isiXhosayi יידישyo Yorùbázu Zulu