Early in my career as a consulting evaluator, I landed a major contract. The contract was to evaluate a nationally-funded province-wide quality improvement program in health care. The funder specified that I evaluate using the RE-AIM framework.
Enter: Googling about RE-AIM.
I know we’ve all had to-do items either personally or professionally where we just want someone to “tell me what to do.” Sure, I can read all the peer-reviewed articles and evaluation textbooks, but this framework has been used in projects all over the world – hasn’t someone put together the “RE-AIM for Dummies” book? Surely someone somewhere can point me in the direction of the first steps and key lessons learned. If it existed at the time, I didn’t find it.
Years later, I was working on an academic research team using Framework Analysis to analyze a huge set of qualitative data. Same scenario: someone please just tell me how to start and what to do! The difference this time was that someone had: I found it, it did exist, and it was awesome. Parkinson et al had published a detailed description of their use of Framework Analysis, complete with missteps, backtracking, and all (Parkinson, Eatough, Holmes, Stapley, Midgley, 2015).
I love these experiential descriptions. I love reading about moving from knowledge gathering to action. I love sharing failures. What better way to learn?
So, having used RE-AIM a handful of times on a few major initiatives, here is my account of how to use the RE-AIM framework in your evaluation planning, implementation, and reporting.
What is RE-AIM?
In quick summary, for those less familiar, RE-AIM was originally developed to assess the public health impact of interventions, based on five domains:
-
R – REACH
-
E – EFFECTIVENESS
-
A- ADOPTION
-
I – IMPLEMENTATION
-
M – MAINTENANCE
RE-AIM provides great structure to an intervention that is well defined, but it may not pair well with something like Developmental Evaluation. It can certainly be used with a Utilization-Focused Evaluation approach.
Step 1: Do some basic research.
I recommend the following:
-
Where it all started, the first paper to describe RE-AIM.
-
The academic version of this article, describing what it means to use RE-AIM.
-
A more recent update, describing the evolution and application of RE-AIM in 2019.
-
And, lucky readers, now there is a full website dedicated to RE-AIM, complete with a comprehensive list of resources.
But I did say I was going to be more practical than just telling you to do all the academic background reading I was so desperately trying to avoid so many years ago, but truthfully, you can’t get around needing some background knowledge. My goal is to share with you a summary of the content on the RE-AIM website but also share some learnings from my own experiences.
Step 2: Build (and implement) your evaluation plan.
The good news is that the RE-AIM framework gives you your key evaluation questions. Of course, you can (and should) supplement and add detail.
So, where RE-AIM says, “Have I reached my target population?” you may adapt to “How many clients participated?” or “How many patients had access to the program?”
Where RE-AIM says, “Was my intervention effective?” you may add in detail “Did my intervention improve patient-reported outcome scores?” or “Did my intervention improve [insert primary outcome measure]?”
I like to structure the data matrix section of my evaluation plan right around the RE-AIM domains, like in the table below.
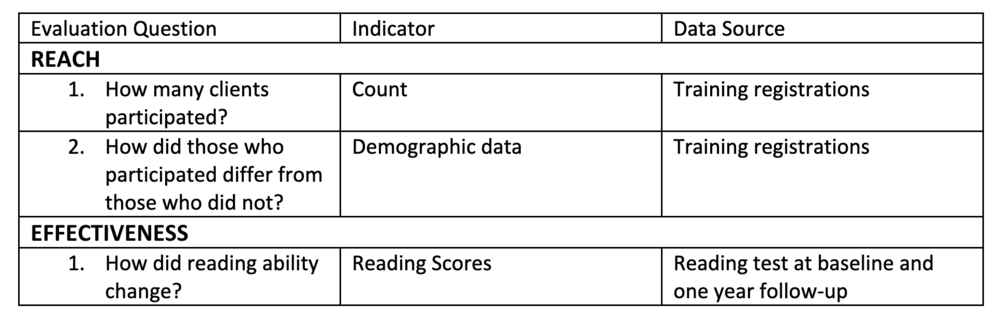
One thing to note early on here, is that RE-AIM is a clever acronym ordered so that it can be read or pronounced easily, but, in my opinion, it’s a little misguiding, giving a sense of purpose in order where there is none. From my experience, it probably goes something more like ARIEM, a little less catchy. (Interestingly, in researching for this article I found a small hidden footnote on the RE-AIM website that admits this exactly!)
RE-AIM can be effective in the actual planning of the intervention. As an evaluator, I always advocate for being part of the design team. With RE-AIM your goal is to get the team thinking about these five dimensions:
-
How will they be recruiting (Reach/Adoption)?
-
Will it be representative (Reach/Adoption)?
-
What are their goals or outcome measures (Effectiveness)?
-
Do they have a clear plan of how they will achieve those goals (Implementation)? And so on.
I think RE-AIM lends itself well to formative and summative evaluations. Several times I have drafted formative and summative evaluation plans for a single project by splitting up the RE-AIM acronym.
Adoption, Reach, and Implementation are those things in an intervention that can be course-corrected. Think of these as your process evaluation metrics. If you aren’t reaching your target population, don’t have organizational adoption, or aren’t implementing according to plan, you won’t be effective or maintain anything of worth. This is your formative evaluation. Then, Effectiveness and Maintenance can assess outcomes and sustainability as part of your summative evaluation.
REACH:
Reach is likely just a count, but can be supplemented with qualitative data captures for a deeper understanding.
e.g., We designed a training program aimed at Grade One teachers. Our city has 500 teachers and 286 participated in our training. Our reach was 286, or 57%.
You could then go on to describe the demographics and how they differed (or not) from those who did not participate. Be sure to be clear about any inclusion/exclusion criteria! Reach is also where you can include questions that address access, equity, diversity, and inclusion: are participants representative of the population? Are we reaching those who would benefit most from the intervention?
EFFECTIVENESS:
Think of this as a “traditional” evaluation – this is: Did the program work? and What difference did it make? This domain is where you will report outcome measures. Any number of methodologies would be appropriate here, depending on your specific intervention. Effectiveness may well be the bulkiest section of your evaluation plan. As in any evaluation, triangulation is a good idea to aim for.
e.g., Our training program had a goal of training teachers to use a new method of teaching reading to Grade One students. Our effectiveness measures may include: # of trained teachers using the method (process measure or output) and % of students with improved reading skills (outcome measure), or the actual % improvement in reading score.
Side note: RE-AIM is not mutually exclusive with other frameworks. I have often–in the evaluation of training programs–embedded the Kirkpatrick evaluation framework into the “E” and “I” of RE-AIM. The RE-AIM website actually recommends layering with PRISM.
ADOPTION:
It is easy to confuse reach and adoption. I struggled with this at first. For me, it helps to think of them as the same concept but at different setting levels: Reach is about individuals or participants, whereas Adoption is about groups or organizations. Adoption is asking: What organizational support do you have? So, similar to Reach, this is likely also a count. And, like Reach, you can supplement with additional data for a deeper understanding.
e.g., How many schools supported teachers to participate in the training. How many schoolboards supported the schools to support the teachers? Our city has 300 schools; 120 supported teachers to participate: 40% adoption. Our analysis shows that there was an underrepresentation of rural schools and overrepresentation of inner-city schools.
Like Reach, you could go on to describe characteristics of these organizations and how they supported the initiative. I have often used Adoption formatively to understand why these organizations endorsed the project or bought in. This exploration can help with spread and scale, or, if things aren’t going well, it is a great way to course correct. I have also included interviews or focus groups with the organizations that did not engage, to understand key barriers.
IMPLEMENTATION:
Implementation is huge. There are whole fields about Implementation Science. In RE-AIM evaluation, you are primarily concerned with fidelity to the plan: Was the intervention implemented as intended? What adaptations were made? How consistent was implementation? Completion rates may also be an appropriate measure here.
e.g., Interviews or surveys with the trainers identified barriers and enablers for successful training sessions. Interviews or surveys with the operational team identified barriers and enablers for recruitment, training the trainers, developing curriculum, building engagement and buy-in, etc.
You could definitely layer on any number of implementation science frameworks here, but likely this is not the key area of interest for your stakeholders and doing so would make this beast unwieldy and hard to manage. Key tips here include considering how each level contributes to implementation: What did the adopted organizations do? What did your organization do? Don’t forget that your own design and operational team are key data sources too!
Your “results” here are likely descriptions of barriers and enablers along with formative lessons learned and resultant adaptations.
MAINTENANCE:
I’ll be honest: I have definitely turned in a final evaluation report before the program has reached a stage to be evaluated for maintenance. New initiatives tend to focus on implementation and first-round outcomes. I have, however, been fortunate enough that this hasn’t always been true. In one initiative, I used annual data reviews to look at maintenance of outcomes. In this particular initiative, we were happy to see maintenance, but we also learned that there was a significant plateau or ceiling effect of both outcomes and reach. This isn’t a huge surprise given what we know about the Diffusion of Innovation. As an evaluator, I could then facilitate discussions like: How will (or should) we attempt to reach those laggards? Will they take up 80% of the resources?
In fact, this is an example of why applying a framework to your evaluation is helpful. If you build in a maintenance evaluation from the start, your team will know that this is planned and you will have the capacity to do the work when the time comes.
So, if you are fortunate enough to be able to evaluate maintenance, it is likely a repetition of many of the measures that came before – you may take a look an ongoing reach and adoption: have you plateaued or continued to spread? You may look at effectiveness outcomes: have you sustained the gains you made?
e.g., Annual check-in of reading scores in Grade One (and now Two) children. Updated participation counts to assess spread and scale.
There is a handy Checklist for some key questions and considerations for each domain. It’s also worth noting that there is nothing holding you to evaluate all five dimensions. I say that begrudgingly though because RE-AIM was developed so that evaluators didn’t overlook key dimensions that are essential to program success. But sometimes there are valid reasons that one of these dimensions may not be relevant for your intervention.
Step 3: Reporting
The RE-AIM website asks you to consider quantifying or scoring the five dimensions for a visual display:
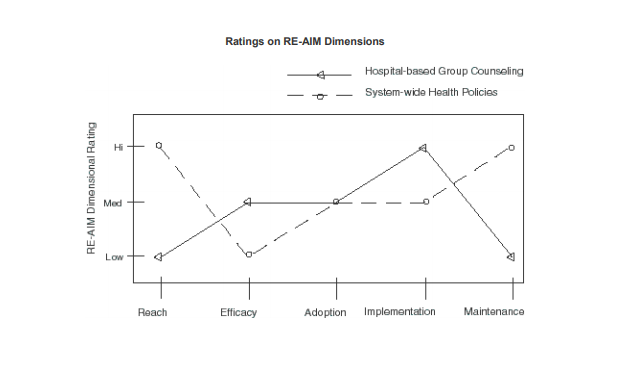
I’ve never done this. This may be informative to you, as the evaluator, but I find that most stakeholders are less interested in the details of the evaluation framework you’ve applied and more interested in the “So what? Now what?” I certainly have used the RE-AIM structure to guide my reporting, but I don’t think it’s required. The key here is to know your audience – how aware are they of RE-AIM? If you were involved in the planning and they built key evaluation questions into the RE-AIM framework, using the five dimensions in your reporting may be appropriate, but in my experience, you can also draft a really great evaluation report that was based on RE-AIM without being tied to the domains as your section titles. Eval Academy has some great articles on how to draft that killer evaluation report.
Things have changed in the 10 years since I first used RE-AIM. There have been a lot more examples published and a lot more content is available. My goal today was to try to synthesize the key points in one place for you, and to share some lessons from my own experiences. I have found RE-AIM to be both highly structured, providing directed guidance, but also flexible enough to allow you to explore in greater depth the key areas of interest for your evaluation.
So, hopefully, you aren’t as in the dark as I felt when I was first tasked with using RE-AIM. It’s one of many tools for evaluators to consider and one that I’ve had lots of success with! If you want to talk more about whether or how to use RE-AIM in your next evaluation project, consider booking some time with one of our evaluation coaches.
Speak with an Evaluation Coach
Sign up for our newsletter
We’ll let you know about our new content, and curate the best new evaluation resources from around the web!
We respect your privacy.
Thank you!