• Skip to main content
  • Skip to footer
  • Home

The May 13 Group

the next day for evaluation

  • Get Involved
  • Our Work
  • About Us
You are here: Home / Archives for cplysy

cplysy

Aug 13 2021

Why your online evaluation capacity building efforts are doomed to fail

This post was written for, and originally appeared, on AEA365.

Hello my fellow evaluators. My name is Chris Lysy, and I am a freelance evaluator, designer, and trainer based in Cary, North Carolina.  My consulting work involves helping organizations deal with the virtual shift (shifting programs from the “real world” to the “virtual world”).

Over the last couple of decades lots of organizations have evolved from being fundamentally place-based operations to global digital entities. An evolution that started well before COVID.

Yet for some reason we still have this image of an organization being a place where people who work together regularly come into face to face contact.

Cartoon / illustration of two individuals where one says "Where is everyone? I brought doughnuts" and the other is saying "Either remote or working from home. I only come in because I like the quiet."

So why are your online efforts doomed to fail?

I believe we consistently underestimate how much the social environment has changed as the virtual world has grown.  

  • A 60 minute webinar is not the same as a 60 minute in-person brown bag. 
  • A virtual summit is not the same as a multi-day in-person conference.  
  • A 30 minute zoom chat is not the same as a cup of coffee with a colleague.

It’s similar, not necessarily better or worse, but different.

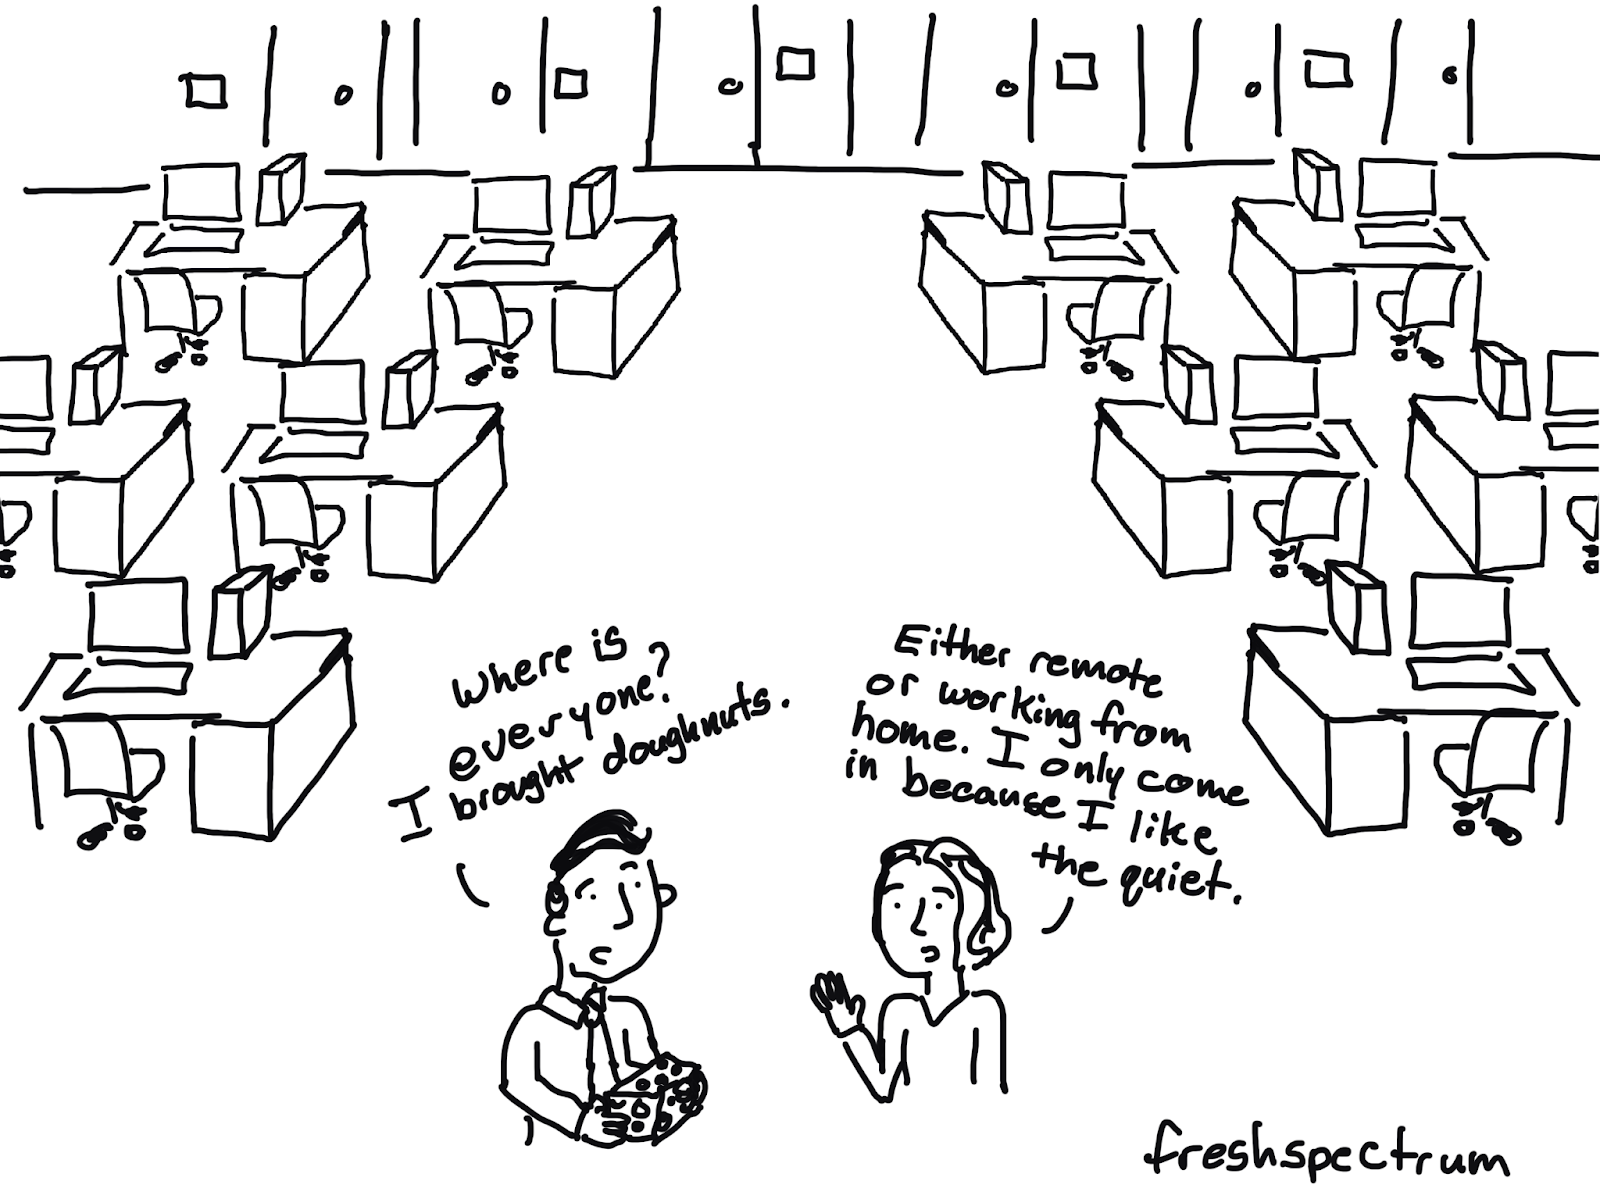
A lot of what has been written about evaluation capacity building is focused on what concepts to cover. It assumes that evaluators know how to effectively engage people at an organizational level. For the pre-virtual organization, that could mean showing up with free doughnuts in the lobby or hosting a large event in the “big conference room.”

But in order to bring the same level of change in the virtual world, we have to approach the capacity building challenge differently.  Or else our efforts will be doomed to fail.

Capacity Building Requires Community Building

Most organizations are not full of vibrant virtual communities. IRL (“In Real Life”) when people get together, community happens. Not so in the digital world.  People tend to know their teams (from regular Zoom calls) but they might not know anyone else outside their project bubble.

So if you want to engage a certain community of people (say project leaders or internal data people) you have to start by building that specific virtual community.

Cartoon illustration of two people where one is saying "I hear your company has a digital community" and the other is saying :Yeah, we launched out internal social network a few years ago." The first person asks "Does anyone use it?" and the second responds "no."

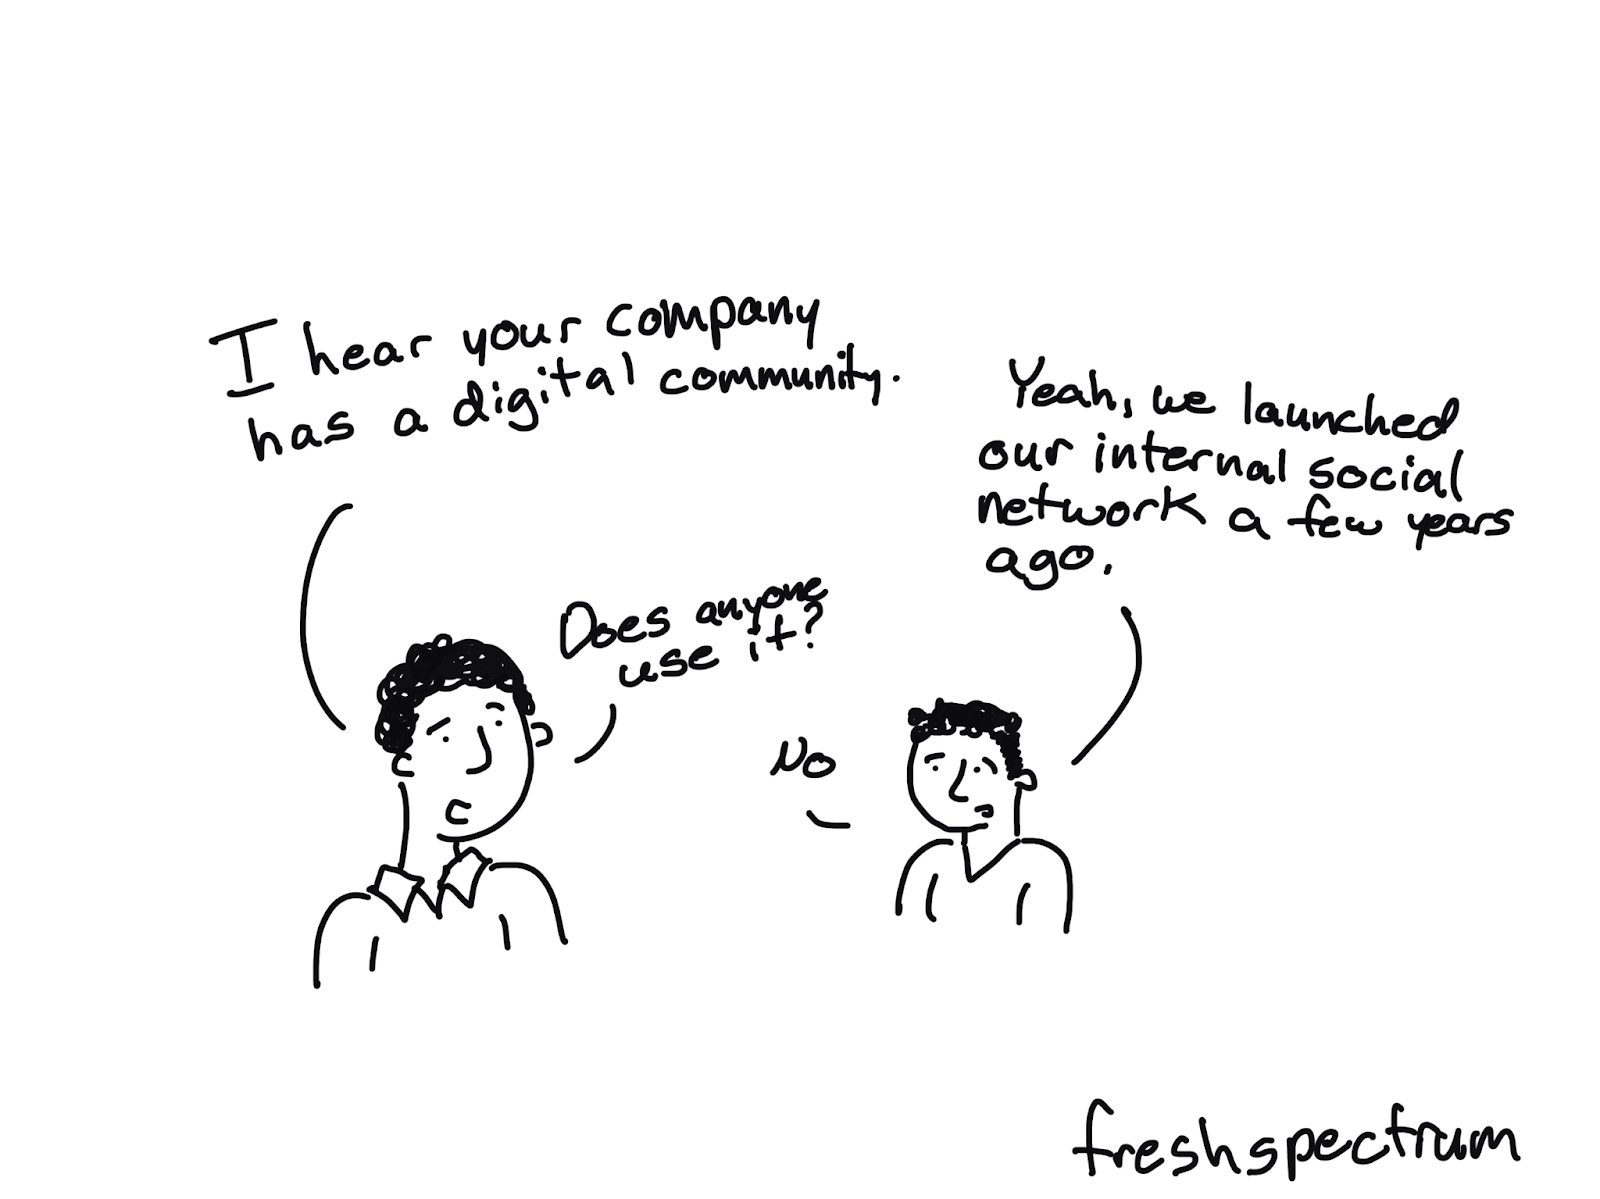
A Dead Forum is NOT a Community

Yes we all have lovely dreams of an active forum where people go to ask questions and support one another. But the reality is that good forum communities are hard to build and often require far more people than you even have in your organization.

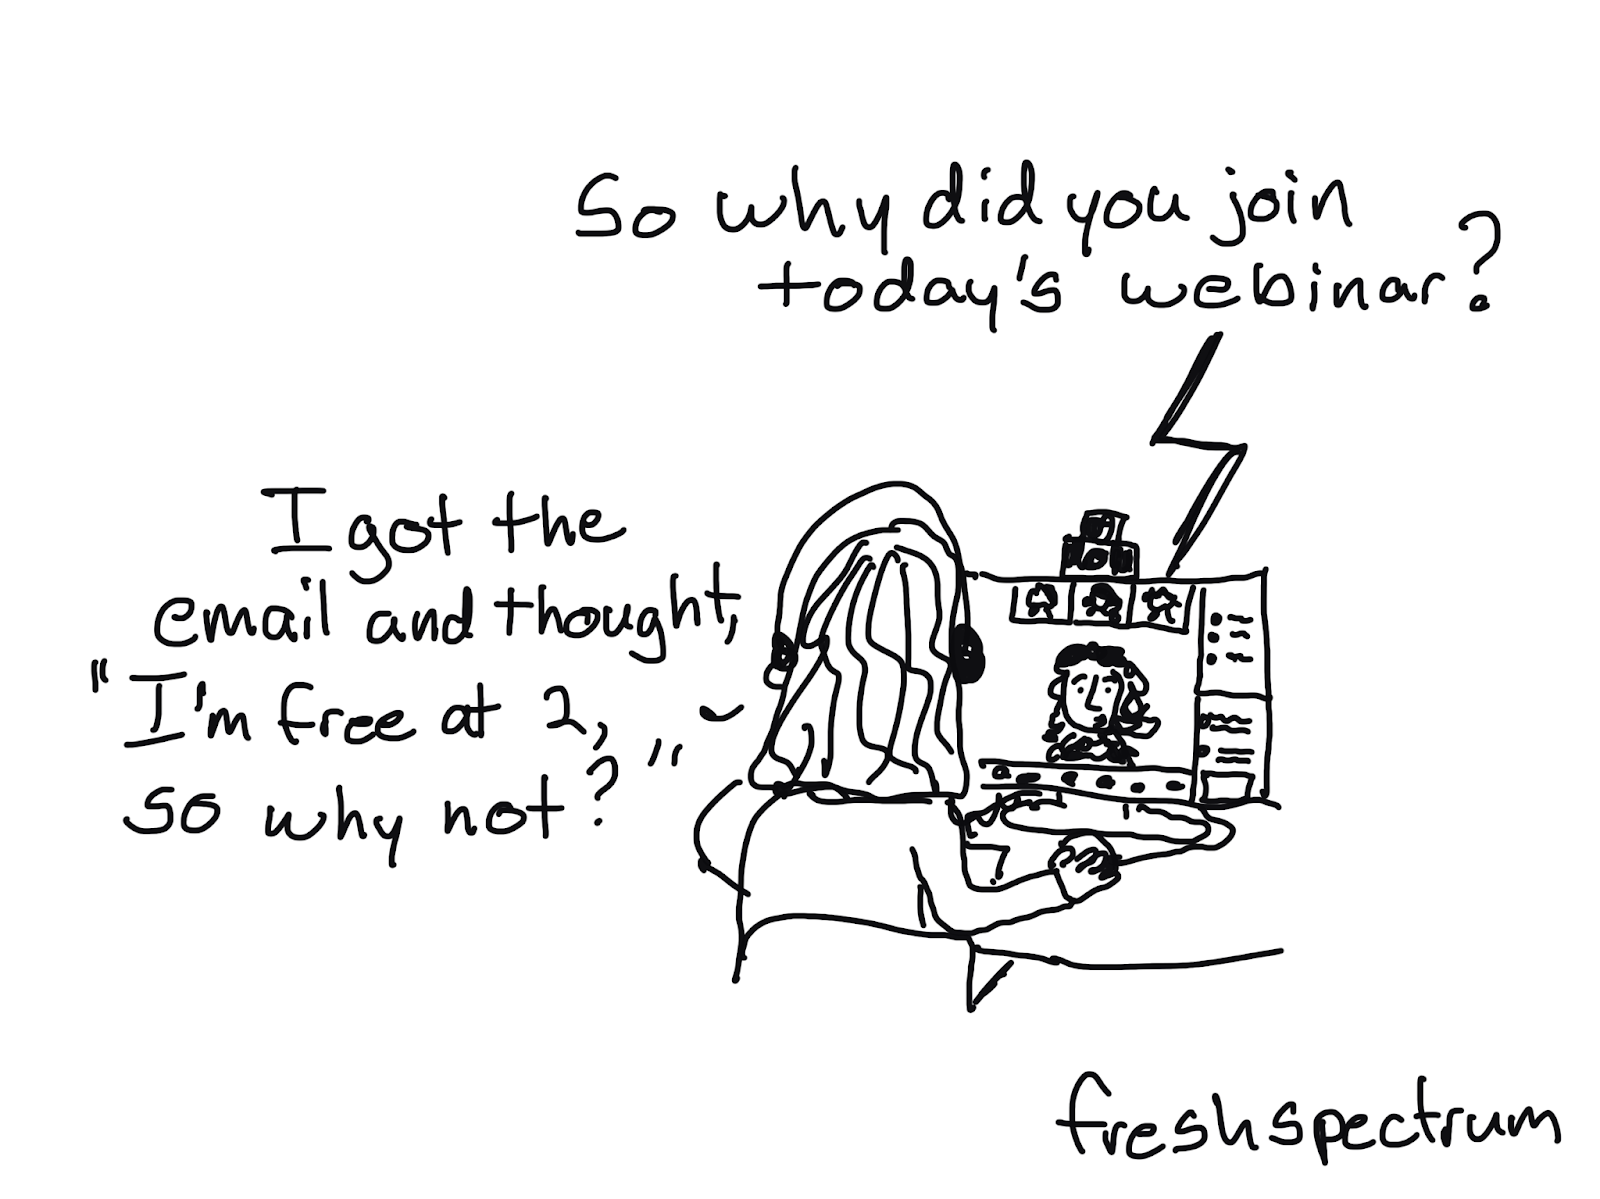
A Webinar Lecture Series is NOT a Community

Somebody wants a community. So they create a webinar lecture series with topics of interest for that specific community. That might work for community building IRL but it doesn’t work the same online. Do this instead.

  • Hold webinar conversations, not lectures.
  • Source presenters from inside the prospective community.
  • Hold panel webinars to distribute the content responsibility and increase exposure to peers.
  • People need to see/hear people to connect, so encourage cameras/headsets (just don’t require them!).
Cartoon illustration where a person is at a computer with headphones on and is saying "I got the email and thought 'I'm free at 2, so why not?'" and the person on the computer screen is saying "So why did you join today's webinar?"

An Email Newsletter is a Good Place to Start

It’s easy to create and just shows up in their email inbox (no need for them to visit a specific site or remember any kind of password/username). You can source newsletter content from the community and it pairs really well with a conversational webinar strategy.

Want more guidance?

I created a short practical guide.

Image of a flyer for Virtual Community Building 101: Because Virtual Capacity Building Starts with Virtual Community Building by Chris Lysy of freshspectrum.com

You can download it here: Virtual Community Building 101

Written by cplysy · Categorized: freshspectrum

Aug 10 2021

Better Storytelling with the Same Data: Upgrade that Board Packet!

Kristen Summers is the Senior Grants Manager at Saint Luke’s Foundation and a Depict Data Studio student. She emailed me an example of how she’s revamped her organizations grants docket and I knew I had to showcase her hard work. Keep up the great work Kristen! – Ann

_________________

I work at a grantmaking organization and it is my job to update the board three times a year on the grant applications we are considering for awards, the grantmaking budget and other information.

You will see below an example of the grants docket (slate of grant proposals under consideration) as well as a grantmaking budget summary. I am almost too embarrassed to show these!

Fortunately, after completing about 70% of the Dashboard Design course, I was able to revitalize a tired spreadsheet into an information powerhouse and a colorful budget visualization into a professional presentation.

It’s the same information, just presented differently!

The Docket

Before: Gridlines Galore and No Visualizations

This docket was printed on 11×17 paper for easier readability and called a “placemat”.

Gridlines, some highlighted cells in yellow to draw the eye.

A lot of information and a bit overwhelming to take in.

Applications were presented alphabetical by organization and not grouped in any way.

The grants docket before was gridlines galore and no visualizations.

After: Fewer Columns, Bigger Impact

When I started the Dashboard Design course with Ann, my intention was to revamp our organizational dashboard and not even this document (once I get that done, I will have to write another blog!).

But the course showed me what little changes I could make to have a big impact.

Although we do not compare numbers over time in this document as it is just a list of our applications, I was still able to use some helpful visualizations, icons, colors, and conditional formatting to tell a story.

The after example number one had fewer columns and a bigger impact.
The after example number two had fewer columns and a bigger impact.

A summary of the changes made:

  • Added logo and subtitle
  • Used brand colors in headings and their corresponding icon
  • Minimized the use of gridlines
  • Removed highlighting of a column but used font colors for key info
  • Grouped applicants together by type of grant (general operating vs. project)
  • Hid the column with the organization budget, but added an icon set of pie charts via conditional formatting
  • Correct alignment for numbers vs. text
  • Deviation bar visualization to show the percent change of the current request from their previous award instead of just expecting the reader to do the math
  • Added a budget summary chart at the bottom

This resulted in a much more well-received document with lots of compliments from board members!

I have begun creating a cohesive aesthetic for all the documents I produce for the board to give them the information they need but in the most streamlined way possible.

The Budget

In 2019 I developed the below budget visualization to up my game a bit from a spreadsheet that board members had a hard time understanding.

This was an improvement over the previous version, but Ann’s course challenged me to turn it up a few notches.

Before:

The old budget was hard for board members to understand.

After:

The revamped budget has less text and more icons to illustrate where the organization is in the budget, which the board members appreciated.

There were not many “big” changes to this in terms of conditional formatting or visualizations, but it has definitely been toned down.

The biggest change was that I replaced the text explanations with icons to illustrate where we are in the budget, which the board members appreciated.

As you can see, there is that cohesive title, subtitle, font, and color choice to keep the branding in line.

Take the Time to Take the Course!

I am pleased with what I am able to do now that I have completed Dashboard Design. The lessons were fun and I was able to put my skills to the test in a matter of weeks!

Now I am enrolled in Simple Spreadsheets which will really provide me a good base as my role stretches me to do more community engagement data evaluation and learning. Thank you, Ann!

Connect with Kristen

LinkedIn: @summerskristen

Lift every Voice 216: https://www.facebook.com/216lift

Saint Luke’s Foundation: https://www.facebook.com/saintlukesfoundationcleveland

Written by cplysy · Categorized: depictdatastudio

Aug 09 2021

Business Tools You Need to Run Your Evaluation Consultancy


Starting a company is daunting. Where do you even begin? When my business partner, Shelby Corley and I started Three Hive Consulting we had A LOT of questions. 

We knew (and still believe) that evaluation is a means for driving organizational impact, so starting an evaluation consultancy seemed obvious. What wasn’t as obvious was the HOW. How do we market ourselves? How do we determine our pricing structure? How do we find people to help do the work?  

Often it is some of those smaller, more operational type decisions that we’d get stuck on. How do we track our time?  How do we track accounts receivable and payable? How do we <insert business process>? 

This article will save you the hours of research and provide you with a list of tools that help us run our evaluation consultancy.  


1. Communication platform: Microsoft Teams

Microsoft Teams was a game-changer for us. Prior to using Teams, we were sending multiple emails a day to communicate with each other, struggling with versioning control on documents and spending way too much time trying to find where documents were located.

Now that we use Teams, we set up a team site for each evaluation project that organizes all the documentation and communication for that project in one spot. Our communication and workflows for each project are much more streamlined. Now we only use email for external communication.

Plus, more and more of our clients are using Teams and establishing us as guest users on their Teams site, which again means more streamlined external communication with them.

2. Time Tracking: Harvest

Let’s be honest: time tracking is a necessary evil as a consultant. I have to say that Harvest has made it a whole lot less evil. Prior to Harvest we used Excel, which was fine but not ideal.

What I like about Harvest is that I can have a timer on my desktop or even my phone that I can easily open to start tracking. It even lets you know when you may have forgotten your timer and nudges you to adjust it accordingly. The user interface when you log into the actual website is really helpful as well. There is one dashboard that shows us all our projects, our budget, what we’ve spent (billable amount and costs), and how much is left. We can also add contractors as users so all the project costs are tracked in one place.

We also use Harvest to invoice which makes invoicing easier for projects that are billed by the hour. Lastly, Harvest also integrates with our accounting software, which again streamlines processes.

3. Accounting platform: QuickBooks Online (QBO)

Prior to switching to QBO we were living in the accounting dark ages (think printing off receipts and other financial documentation and physically delivering that in an envelope to our accountant).

This antiquated process meant not only were we living in the dark ages in terms of process, but also just in the dark. We did not have timely insights into our finances to help guide our business decisions.

After switching to QBO it was like a light was turned on and we could finally see! Now we have a shared online platform where both business partners and our accountant can login to quickly and accurately assess what money is coming in and what money is going out and we can easily track what that looks like over time. We can even forward emails with receipts to QBO for automatic processing to lessen the bookkeeping workload.

4. Scheduling: Calendly

As evaluators, we are often scheduling meetings or interviews. I’ve eaten up a lot of time in the past emailing back and forth on potential meeting dates and times that would work to meet. Many companies will hire assistants or scheduling coordinators just to take on these tasks.

Calendly has saved us a tremendous amount of time and money by automating the scheduling and booking process. It makes scheduling interviews or focus groups so much easier for participants, too. Calendly connects with your calendar and is an add-in to your email. The email add-in means while you are trying to schedule a meeting you can just click on the Calendly button in your email and it will insert your availability (you also have the option to modify your availability if your calendar shows blocks that are inaccurate).

When you send the email to the recipient, they can then select the time and date that works and it will automatically schedule the meeting in both calendars. If you link to Microsoft Teams it will also insert the link that people need to use to join the meeting. Voila! No more emailing back and forth about who is available when.

5. Password Management: Zoho Vault

Managing passwords is the bane of my existence. Managing passwords in a company with multiple individuals gets even more complicated. In fact, all of the tools I have talked about in this article require passwords!

Thankfully Zoho offers a product called Zoho Vault that has helped make the password management process easier. With Zoho Vault, you sign-in to a “vault” that stores all your passwords for the various products. You can add people in your company as users and then select which ‘secrets’ (aka passwords) each person has access to and their access permission level to that secret.

6. Data Analysis: Excel, R, and ATLAS t.i.

Evaluation means we collect and work with a lot of data – both quantitative and qualitative. We still mainly use Excel for a lot of our analysis. You can run a lot of basic statistical analyses in Excel and also do some pretty incredible data viz in it. The best part with Excel is you don’t have to pay reoccurring fees to use it and everyone pretty much has it so you can also share reports made in Excel. For more complicated stats we use R, which is free! 

We also use Excel for some basic qualitative analysis. For any project where we need to manage and analyze larger amounts of qualitative data we use ATLAS.ti. ATLAS.ti has recently introduced a web-based platform that we expect will see continued rollout of the features we’re used to in the desktop version. 

7. Project Management: Excel and Microsoft To Do

We are still trying to figure out what project management tools will work best across Three Hive. We have tried a few like Harvest Forecast, but haven’t landed on one that fits quite right.

In the meantime, we use Microsoft To Do, which integrates with Microsoft Office 365 applications (i.e., Microsoft Teams), to plan and assign tasks. I’m told Microsoft Power Automate is also a useful tool that integrates with Office 365 that automates businesses processes and workflows, but we haven’t explored that yet.

8. Virtual Facilitation: Mentimeter, Mural, and Microsoft WhiteboardMural

In addition to being communicators, accountants, administrators, project managers, and analysts, evaluators also need to be good facilitators – my office is full of markers and sticky notes.

When the pandemic happened, I needed to figure out how to facilitate virtual whiteboard sessions. I’ve tried out Mural and really like it, but again once your free trial runs out you are stuck with yet another monthly charge.

Microsoft Whiteboard is a function that integrates with Microsoft Teams. I haven’t used it too much yet, but am keen to learn more. Another tool I have been using while facilitating to help engage with the audience is Mentimeter. If you need to wake people up, try a quick poll using Mentimeter to re-engage them.   


If you are just starting your evaluation consultancy and are a team of one you may not need some of these tools; Excel may be all you need. However, if your evaluation consultancy grows, you will find that your needs will too.

A growing evaluation consultancy means more people; more people means more processes and systems; more processes and systems means more tools to support people to do their best work. As Kevin Fishner of HashiCorp put it in this article:

“A company is a collection of both its people and its systems. People can come and go over the years, but the systems they put in place and gradually refine over time become part of the company – and companies ultimately compete based on if those systems are strong or not.”

Make sure to sign up for the Eval Academy newsletter for more evaluation consulting experience shares.


Sign up for our newsletter

We’ll let you know about our new content, and curate the best new evaluation resources from around the web!


We respect your privacy.

Thank you!


Written by cplysy · Categorized: evalacademy

Aug 09 2021

Comment on Factors that promote use: A conceptual framework by Dissertation: Overview of the study

[…] Factors that promote use: A conceptual framework […]

Written by cplysy · Categorized: danawanzer

Aug 06 2021

Gen Z are Identity Crafters: What does this mean for Cultural Institutions?

By: Sadiya Akasha

Population demographics have been shifting towards greater diversity for the last few generations with Generation Z being the most diverse generation yet. Research published by the Pew Research Center shows that nearly 48% of Gen Zers born between 1997 and 2012 belong to a racial or ethnic minority, compared to 39% of Millennials. As cultural institutions pivot towards serving this generation of visitors, it seems like a particularly salient time to query how this change in demographics might affect strategy, planning, and outreach for visitor engagement.

Researching and Crafting Identities

Many Gen Zers find themselves struggling with an outdated demographic model where they are expected to keep their race as clearly delineated as a shorthand way to describe themselves. In 2019, Vice Magazine led a research study enrolling older members of their Gen Z readership (aged 16 – 22) to answer questions about identity. Their findings suggest that this generation experiences many aspects of their identity, like racial and ethnic background, gender, and faith, as both more fluid and more holistic than our Western culture currently accommodates. For example, a study participant of Filipino and Korean American descent described her difficulty in simply checking a demographic box on forms:

“I remember for the longest time Filipino wasn’t an option,” she said. “And so my sister and I thought that we were Pacific Islanders just because of what the options were. I really don’t like the fact that you either have to be Hispanic or not Hispanic. Also, what does Hispanic even mean? The Spanish colonized the Philippines, so for you to say that I’m Filipino but not Hispanic or Hispanic, it’s so weird. The entire language needs to be changed.”

Beyond being multicultural, members of Gen Z also exhibit a flexible attitude with their adoption of religious traditions. Gen Zers approach their relationship with religion by researching the faiths of their living family members, and even their ancestors, in order to identify the elements that best align with their values and create an entirely new blend of religious rituals to better suit their needs. In this fashion, members of Gen Z are able to craft a well-researched and well-rounded identity that incorporates many of their cultural and religious practices into their daily lives.

But Gen Z doesn’t stop there! Since their identity is molded around their values, activism is also a part of their self-identity. The Pew Research Center has identified that a much larger percentage of Gen Z are born to immigrant parents in the United States when compared to Millennials. This means that on top of being more diverse, Gen Z is also less likely to be foreign-born. Early signs indicate that Gen Z is already playing an active role in civic engagement. The Vice Magazine study conducted research across the US and UK and found that 76% of Gen Z identify as activists and 54% plan to get involved in politics. It’s easy to see that for the generation whose members include the likes of Malala Yousafzai, X Gonzalez, and Greta Thunberg, activism and civic engagement is as much a part of their identity as their chosen gender, culture, religion, and so on.

Dynamic Intersectionality in Action

For Gen Z, all of these identifiers are not a hierarchical list but a multifaceted, self-consistent exposition on who they are becoming at present. For Gen Z, identity is actively shaped and carved like a sculpture out of stone, not accepted as handed down or absorbed through our cultural milieu. This kind of exploration and constant self-examination is such a foundational trait to Gen Z that it is clearly reflected in their overwhelming support of others’ rights to self-designation and exploration. The Culture Marketing Council released a comprehensive study on Gen Z in 2020 showing that values of freedom, equality & healthcare for all matter most to Gen Z, with heightened priority on the “For All”.

Gen Z is the most racially diverse and multiethnic generation to date. Their multicultural background is different from that of their predecessors in that many are US-born to immigrant parents rather than foreign-born themselves, and that they are much more likely to come from a mixed racial and multicultural background. This is reflected in a sense of self that is much more blended and holistic than our Western cultural model currently supports. So if we accept that Gen Z naturally inhabits an intersectional space with a flexible but intentional sense of identity that is ever-evolving, then we might need to re-consider current demographic data collection tools and their underlying assumptions.

Redefining Demographics

I recently collaborated with a prominent modern art museum in London to perform a user study targeting young people (high school and college-age) as well as families with young children (Gen Z and younger). The demographic data for the interviewees listed their ethnic background, in singular, such as Caribbean or Indian or Bengali. Curiously, I noticed interviewees who were not People of Color (POC) were listed as either ‘British’ or ‘White Other’. The idea here was to seek out diverse visitors within the target audience to ensure representation and inclusion for non-English speaking communities. However, what I learned during the interviews was that many of the interviewees who were identified by the museum as POC were in fact London-born Gen Z children of immigrant parents for whom the British culture and English language were an inseparable part of their identity. On the other hand, several of the interviewees who were listed as ‘White Other’ by the museum were first-generation immigrants themselves from other European nations who learned English as a second language in adulthood. It certainly turned some assumptions upside down about who was ‘British’ and which communities needed to be supported in their understanding of interpretive material.

It would be prudent at this point to question our assumptions and rethink our approach to racial demographics.  It is clearly out of date and largely irrelevant to the lived experiences of our Gen Z visitors.  We should start by asking Gen Z how they would like to be identified and go from there.

What’s next?

In my previous post in this series, I described how Gen Z actively investigates media narratives and questions sources, while in this post I’ve outlined that they take the same approach in crafting their own identities. With this in mind, my final post will investigate how cultural institutions can meet Gen Z where they are by engaging with them as collaborators.

About the Author

A brown woman with shoulder length hair looks into the camera. She is a millennial, not Gen Z.

Sadiya Akasha is the co-founder and Director of Product Development at Sitara Systems, a design and technology laboratory that creates interactive experiences with emerging technologies. Sadiya partners with cultural institutions to help them conceptualize and deliver technology initiatives by leveraging her background in human-centered design, agile thinking, and audience research. In her free time Sadiya enjoys exploring the rugged yet delicate landscapes of the great Southwest. 

The post Gen Z are Identity Crafters: What does this mean for Cultural Institutions? appeared first on RK&A.

Written by cplysy · Categorized: rka

  • « Go to Previous Page
  • Go to page 1
  • Interim pages omitted …
  • Go to page 168
  • Go to page 169
  • Go to page 170
  • Go to page 171
  • Go to page 172
  • Interim pages omitted …
  • Go to page 304
  • Go to Next Page »

Footer

Follow our Work

The easiest way to stay connected to our work is to join our newsletter. You’ll get updates on projects, learn about new events, and hear stories from those evaluators whom the field continues to actively exclude and erase.

Get Updates

Want to take further action or join a pod? Click here to learn more.

Copyright © 2026 · The May 13 Group · Log in

en English
af Afrikaanssq Shqipam አማርኛar العربيةhy Հայերենaz Azərbaycan dilieu Euskarabe Беларуская моваbn বাংলাbs Bosanskibg Българскиca Catalàceb Cebuanony Chichewazh-CN 简体中文zh-TW 繁體中文co Corsuhr Hrvatskics Čeština‎da Dansknl Nederlandsen Englisheo Esperantoet Eestitl Filipinofi Suomifr Françaisfy Fryskgl Galegoka ქართულიde Deutschel Ελληνικάgu ગુજરાતીht Kreyol ayisyenha Harshen Hausahaw Ōlelo Hawaiʻiiw עִבְרִיתhi हिन्दीhmn Hmonghu Magyaris Íslenskaig Igboid Bahasa Indonesiaga Gaeilgeit Italianoja 日本語jw Basa Jawakn ಕನ್ನಡkk Қазақ тіліkm ភាសាខ្មែរko 한국어ku كوردی‎ky Кыргызчаlo ພາສາລາວla Latinlv Latviešu valodalt Lietuvių kalbalb Lëtzebuergeschmk Македонски јазикmg Malagasyms Bahasa Melayuml മലയാളംmt Maltesemi Te Reo Māorimr मराठीmn Монголmy ဗမာစာne नेपालीno Norsk bokmålps پښتوfa فارسیpl Polskipt Portuguêspa ਪੰਜਾਬੀro Românăru Русскийsm Samoangd Gàidhligsr Српски језикst Sesothosn Shonasd سنڌيsi සිංහලsk Slovenčinasl Slovenščinaso Afsoomaalies Españolsu Basa Sundasw Kiswahilisv Svenskatg Тоҷикӣta தமிழ்te తెలుగుth ไทยtr Türkçeuk Українськаur اردوuz O‘zbekchavi Tiếng Việtcy Cymraegxh isiXhosayi יידישyo Yorùbázu Zulu