• Skip to main content
  • Skip to footer
  • Home

The May 13 Group

the next day for evaluation

  • Get Involved
  • Our Work
  • About Us
You are here: Home / Archives for cplysy

cplysy

Apr 01 2021

Perspective Taking Circles

The power of perspective is one of the things that differentiates high output and impact innovators from others. It’s easy to get lucky or have good timing, but it’s another to create value when those things don’t happen.

One of the ways we do this is by engaging in some perspective-taking. This simple exercise and question set can help build some of the ‘thought muscles’ that can help encourage us to see, imagine, and engage things differently for creative benefit.

The Exercise

This works best when physically in the same space and can work online as well. What you need is to create a space where people can re-position themselves against a central object that can be almost anything except a ball (because it looks the same from every angle). Place your participants around the object with a comfortable space to sit or stand.

You can do this virtually using a dynamic space like Kumospace or some other virtual reality-like environment. It can also work using a board like Miro or Mural with some designed object in the middle, but it is more awkward.

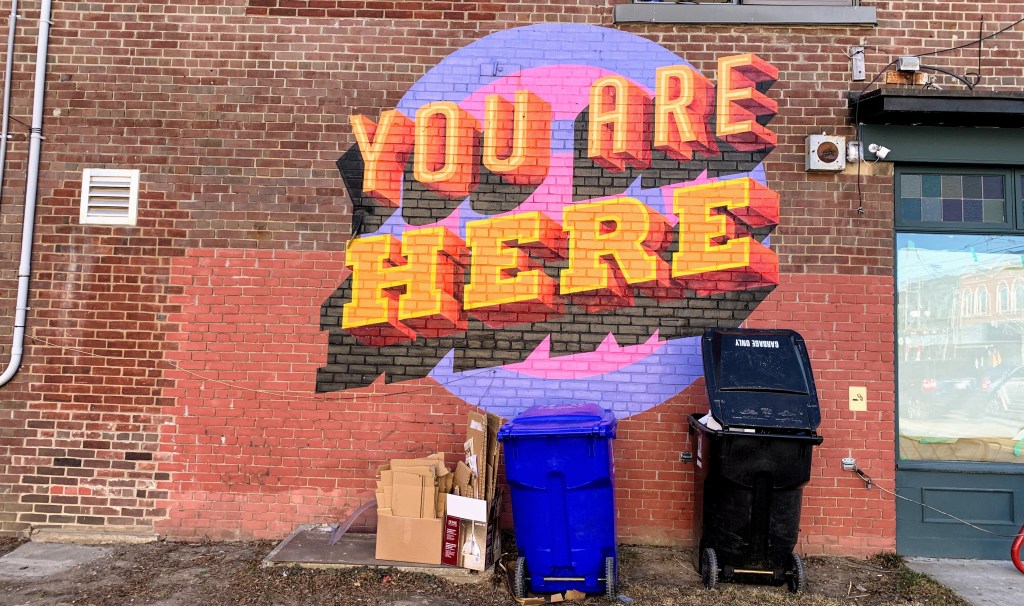
The idea is that everyone has a chance to literally see things from a different point of view.

This can be done as an observation exercise but is more enhanced when it is combined with drawing. Asking people to draw what they see — no matter what kind of skills or abilities participants have with sketching — is a great means to engage people in thinking more deeply about their perspective.

Once individuals have had time to observe and reflect on what they see, the next step is to have everyone share their perspective. This is where drawings are useful as people can speak to what they drew as drawing focuses us on certain elements and provides a means to account for those perspectives. It also allows others to point to the drawing and make specific, not general comments.

It’s that specificity that is key to illuminating and articulating differences of perspective.

Uses

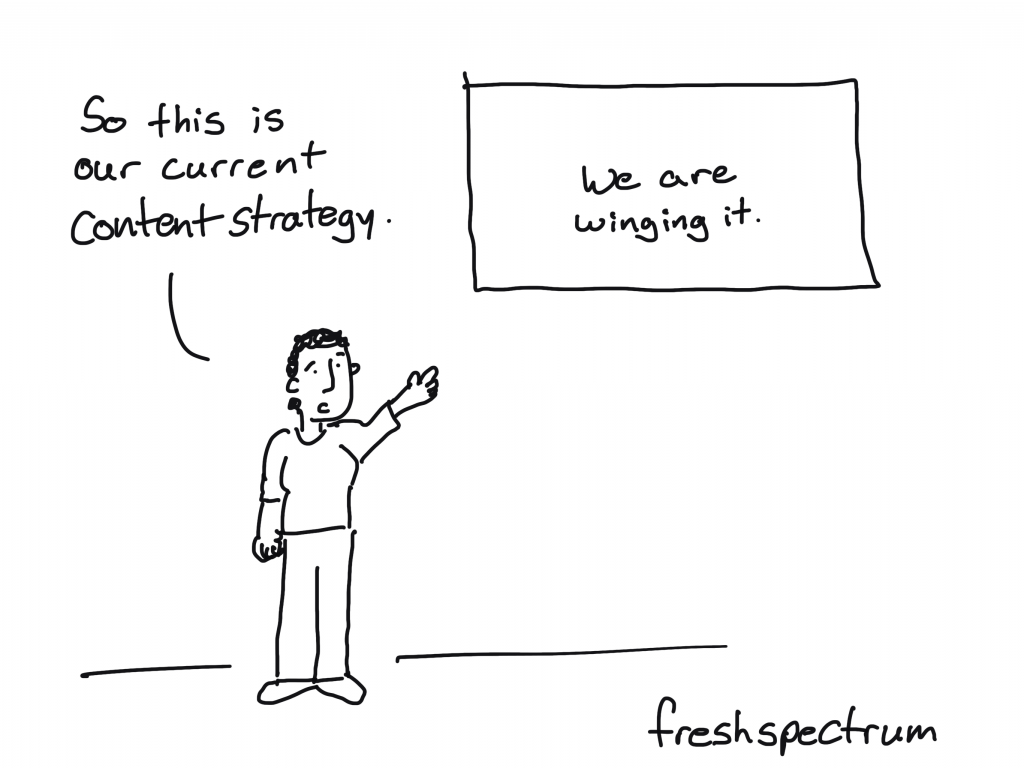
The role of this method is to reveal how where we sit in a system — even a small one of people interconnected around a shared experience of an object — can have remarkably different perceptions of the same thing in the same space.

It begins to build cultural practices around creating space for exploring and sharing perspectives within an organization and can serve as a base for better organizational design and learning.

It’s simple, engaging, and revealing in its method.

Written by cplysy · Categorized: cameronnorman

Apr 01 2021

Dial Down Your Data

Six hacks for renovating your evaluation report

PART 6

This article is Part 6 in a six-part series that walks you through how to reno your evaluation reports using six of Canva’s design lessons.

  • Part 1 focused on how to take your audience on a journey using storytelling techniques.

  • Part 2 focused on how to format your report with a consistent, cohesive look using colour and font.

  • Part 3 dove into grouping and spacing elements in your reporting.

  • Part 4 explored how to make elements in your report pop using focal points.

  • Part 5 explored how to use images as focal points.

This last article explores how to simplify data presented in graphs and tables in your report.

Simplifying data starts by having a clear message to convey

In the past, I have been guilty of putting any and all data I could into a report. I’m talking pages of charts to show ALL the results. If I’m being honest, in some instances, I didn’t know what the point was. I put in as much detail as I could to shift the burden of deciphering the meaning behind the data to my reader. Or, I fell back on my training that ingrained in my brain that I should be objective and not provide any insights into what the data might mean (see Part 1).

Regardless, what I learned the hard way is that I need a big idea (see Part 1), position, thesis, point, message, whatever you want to call it, when I am pulling my evaluation report together. Your big idea is your filter for determining what should and should not be included in your report; it will also help you determine how to present it. 


Choosing how to present your data is no longer limited to simple column and bar graphs. In fact, the number of different charts and ways to present the data in your report is sometimes overwhelming. Should you use a line chart? Bar chart? Column chart? Bubble chart? Scatter plot? Tree map? Heat map – the list goes on.

There are a number of different chart chooser tools out there you can find. Stephanie Evergreen has both quantitative and qualitative chart chooser tools. The Data Visualization Catalogue is another great online resource for selecting and understanding the various chart available to you. What you’ll notice though, is regardless of the tool you choose, they all rely on you being able to identify your story.  

The Data Visualization Catalogue

The Data Visualization Catalogue

Once you know what it is you are trying to convey, selecting the right chart becomes a whole lot easier – and more impactful. Take for example the chart below.

It probably took you some time to figure out the message – engagement within the HR department has tanked. The column chart is not doing anything to highlight that story. Compare that column chart to this slope chart.

The slope chart immediately highlights the change in scores from 2015 to 2017. Of course, there are many other formatting elements that help to convey our message, which brings me to my next point….

Don’t default to the defaults

Your software is smart, but not smart enough to know the message you are trying to convey. The column chart example highlights how default charts will only get you so far. Choosing the right chart (i.e., the slope chart as opposed to the column chart) helps to convey your message; however, formatting your chart to hone your message is where the magic happens. The slope chart highlights three ways we did that. We….

  1. Got rid of distractions – We removed the gridlines from the default column chart. I tend to always remove those since I find them distracting to the eye. We also removed the y-axis. If you include data labels, then often one of the axes becomes redundant and can be removed. You can also remove the tick marks on the remaining axes to dial down another default distraction. 

  2. Used colour intentionally – The blue and orange columns tell our eyes to look at the columns, but the colours compete with each other and for our eyes’ attention. The slope chart uses red intentionally to highlight the HR department and mutes out the rest of the data with grey. Immediately, the red draws attention to the message we want to highlight without being distracted by competing colours. 

  3. Stated the story – The column chart contains a generic title “Employee Engagement Scores Over Time.” The slope chart clearly states the key message the audience needs to know. 

Dialing down your data means you have a dialed message. That dialed message frames not only what data goes into your report, but how that data is presented. Take a look at some of the reports you are creating. Are there opportunities to dial down your data? Try it out! And don’t forget about the other five hacks outlined in this series.


Sign up for our newsletter

We’ll let you know about our new content, and curate the best new evaluation resources from around the web!


We respect your privacy.

Thank you!

Written by cplysy · Categorized: evalacademy

Apr 01 2021

Evaluation Roundup – March 2021

Welcome to our monthly roundup of new and noteworthy evaluation news and resources – here is the latest.

Have something you’d like to see here? Tweet us @EvalAcademy!

New and Noteworthy — Reads

Applying Evaluation Criteria Thoughtfully

The Organization for Economic Co-operation and Development (OECD) and the Network on Development Evaluation (EvalNet) laid out six evaluation criteria to support consistent, high-quality evaluation in the early 2000s. However, there was never a document to help evaluators and others understand these criteria and improve their use. OECD just released Applying Evaluation Criteria Thoughtfully. This document is meant to explore the criteria in detail by explaining what they are and how they are meant to be used.

Tools and Tips for Implementing Contribution Analysis

The Centre for Evaluation Innovation recently published a quick guide for implementing contribution analysis. The guide outlines what contribution analysis is and the six steps practitioners can take to implement it. The author also outlines challenges they have seen when conducting these types of evaluations and some ideas of how to mitigate those challenges. As always, the Centre for Evaluation Innovation has provided a very simple, practical document to help guide your practice.

Indigenous Made in Africa Evaluation Frameworks

The most recent American Journal of Evaluation published this article by Bagele Chilisa and Donna M. Mertens. This article discusses how issues of culture, ethics, and values from an Indigenous paradigm perspective have largely been ignored by international agencies when framing evaluations. This article describes an “Indigenous paradigmatic framework and then narrows the focus to a Made in Africa approach to evaluation that is designed to redress the epistemic violence perpetrated by the use of a Western Cultural lens to determine evaluation approaches.”

Using Twitter Data for Development Research and Evaluation

The World Bank and IEG staff shared their experience in a webinar using sentiment analysis (including using Twitter data) as a tool for collecting data for development research and evaluation. This article is a summary of the lessons from that webinar. If you are interested in using social media data for data collection, this is a good high-level overview of the benefits, opportunities, and risks.

New and Noteworthy — Events

A Conversation on Evaluative Thinking: A discussion with Chari Smith (Evaluation into Action) and Hayat Askar (EvalJordan)

Organized by: Evaluation into Action and EvalJordan 

Date: April 9; 9:00-10:00am (Pacific Standard Time) 

Facilitator: Chari Smith and Hayat Askar 

Using Art in Creative Data Collection and Evaluation

Organized by: Canadian Evaluation Society 

Date: April 15; 12:00-1:00pm (Eastern Daylight Time) 

Facilitators: Jennica Nichols and Maya Lefkowich 

Decolonizing ‘Development’ Evaluation

Organized by: Virginia Tech 

Date: April 15; 12:00-1:00pm (Eastern Time) 

Speaker: Candice Morkel  

Evaluation for Transformative Change

Organized by: Tamarack Institute  

Dates: April 20, 22, 27 and 29 

Facilitators: Michael Quinn Patton and Mark Cabaj 

Courses

Most Significant Change

Instructor: Clear Horizon Academy 

Start Date: April 16, 2021 

Evaluation Systems Change and Place-Based Approaches 

Instructor: Clear Horizon Academy 

Start Date: May 21, 2021 

Written by cplysy · Categorized: evalacademy

Mar 31 2021

Las cinco competencias en evaluación según UNEG

image-12

Dentro de nuestra sección de “Competencias“, continuamos y profundizamos el pasado post ¿Qué son las competencias? donde se definían las competencias en evaluación  basadas en el informe de UNEG El marco de competencias de evaluación de Naciones Unidas (2016).

Las secciones de este informe están organizadas por competencias, indicando las expectativas para los diferentes niveles de evaluador@s, jef@s de unidad de evaluación y comisionados. Las competencias se expresan intencionalmente como habilidades y destrezas y no como una lista de acciones o tareas.

Se basa en el supuesto de que l@s evaluador@s deben tener las bases profesionales necesarias y habilidades técnicas para asegurar que el diseño y los procesos de evaluación sean consistentes con los principios y requisitos éticos, que las evaluaciones cumplan con las normas y estándares apropiados del UNEG, que las evaluaciones se gestionen de manera eficiente y que los hallazgos se comuniquen claramente de una manera apropiada para la audiencia.

Sin embargo, aunque l@s evaluador@s tienen la mayor responsabilidad por la calidad y credibilidad de las evaluaciones, l@s jef@s de las unidades de evaluación y l@s que comisionan también desempeñan funciones clave. Los roles de l@s usuari@s de la evaluación también son importantes, ya que los usuari@s participan en la identificación de la necesidad de evaluaciones, la seguridad financiera y la promoción del uso de la información de las evaluaciones en la programación basada en evidencia para mejorar los logros hacia los ODS.

1. Fundamentos profesionales: aquellas competencias que son fundamentales para la práctica de la evaluación. Incluyen ética, estándares, una base de conocimientos y práctica reflexiva. Tod@s l@s involucrad@s en el proceso de evaluación deben estar familiarizados con las Normas y Estándares de Evaluación del UNEG. Sin embargo, l@s evaluador@s son responsables de un conocimiento profundo de los estándares y de ponerlos en práctica.

• Ética e Integridad

• Normas y estándares de evaluación

• Base de conocimientos

• Derechos humanos e igualdad de género

• Práctica reflexiva

2. Las habilidades técnicas de evaluación son fundamentales para garantizar evaluaciones de alta calidad que sean relevantes, confiables y que respalden la traducción y el uso de los hallazgos de la evaluación para informar e influir en las decisiones futuras de programas y políticas. Las habilidades de evaluación técnica incluyen: conocimiento para identificar las necesidades de evaluación y desarrollar diseños de evaluación con preguntas de evaluación enfocadas; conocimientos sólidos sobre enfoques y métodos de evaluación; y las habilidades analíticas para interpretar los hallazgos y formular conclusiones y, si es relevante, recomendaciones que estén claramente relacionadas con los hallazgos y conclusiones.

• Normas de calidad

• Propósito y diseño de la evaluación

• Enfoques, métodos y análisis de datos de evaluación

• Informe de hallazgos, conclusiones y recomendaciones

3. Habilidades de gestión. Las habilidades de gestión son fundamentales para liderar equipos que realizan evaluaciones (por ejemplo, para ser el líder del equipo de evaluación) y para gestionar o supervisar de otras formas la implementación de la evaluación. Si bien las habilidades de gestión incluyen muchas de las habilidades necesarias para gestionar cualquier proyecto, las habilidades de gestión para la evaluación se relacionan con las habilidades específicas para gestionar las evaluaciones.

• Planificación del trabajo

• Coordinación y Supervisión

• Adaptar la evaluación a las circunstancias

4. Las habilidades interpersonales son importantes para asegurar que el compromiso con las partes interesadas involucradas en el proceso de evaluación en todas las etapas sea efectivo y que se fortalezca el uso posterior de la evaluación. Estas habilidades a menudo se denominan “habilidades blandas” que ayudan a mejorar la influencia que la evaluación tiene en sus partes interesadas. Las habilidades incluyen comunicación, facilitación, negociación e intercambio de conocimientos.

• Planificación del trabajo

• Coordinación y Supervisión

• Adaptar la evaluación a las circunstancias

5. Las habilidades para promover una cultura de aprendizaje para la evaluación dentro de una organización, para involucrar a los usuarios y beneficiarios en los procesos de evaluación y para ampliar el uso de la evidencia en la toma de decisiones son importantes, como algunos de los principales propósitos de la evaluación.

• Integración de la evaluación en políticas y programación

• Centrado en la utilización

Written by cplysy · Categorized: TripleAD

Mar 31 2021

How to build an online community of practice (8 Tips)

For a little over a year I have had the pleasure of designing and facilitating a specific public health program focused evaluation community of practice. I have had a great partner in this work and have learned a lot about virtual community building.

Today’s post highlights just some of the tips I have learned through experience.

freshspectrum cartoon by Chris Lysy:
Can they really call it a community of practice if the community members don't know one another?

1. Build the Community First.

Far too many online “communities” are not much more than a virtual lecture series serving a defined audience. There is little space made for peer to peer engagement. Is it really a community if the people within don’t know each other or have the opportunity to interact?

One of the biggest challenges building communities in a virtual space is that you don’t need to just replace the lecture hall, you also need to replace the interactions that occur in the hallways and the line for coffee. Communities are built through interaction and engagement, not just a shared interest in a particular topic or membership in a particular group.

Design activities that don’t just serve your audience, but give your community members the space to learn about one another.

freshspectrum cartoon by Chris Lysy: Online communities are made out of people! They're people!

2. Show Faces.

We all want to belong to groups that include actual human beings. Communities of practice are built so that individual members can learn from “people like me,” not a disembodied voice from on high.

That means not just including the community in conversation, but also offering ways to see their faces. Regular, informal, “camera on” group conversations via zoom can help. So can including faces on your webinar invitations.

It’s easy to hide behind the keyboard, so plan your way around that.

*But don’t require videos be turned on during webinars, and don’t do it all the time for everyone. With so many people juggling household responsibilities (taking care of kids and other family) while participating in professional activities, requiring cameras on can alienate certain members of your community.

freshspectrum cartoon by Chris Lysy: All of you attending this webinar are hand selected experts. The greatest minds in our field. We asked you here so that we could deliver a boring forgettable presentation while you eat your lunch and scroll around on Facebook.

3. Bottom up, not top down.

The goal of a community of practice should be to draw upon the expertise of the community. Don’t just think about what they would like to hear, ask them what they would be willing to contribute.

It is certainly easier to just come up with a list of webinar topics and run with it. But sourcing expertise from your community is the best way I’ve found to increase ongoing participation. It takes time and trust building, but ultimately it builds a better community.

freshspectrum cartoon by Chris Lysy: What, they want me to answer a 5 minute survey? Who has time for that?
They want me to lead next month's hour long presentation? How could I say no?

4. When asking less can be asking too much.

We are all worried about taking up too much of people’s time. But don’t be afraid to ask for something big, like webinar presenters, instead of something smaller, like blog posts or comments.

Asking a community member to present during a webinar sounds like a really big commitment. But often they are presenting from their own personal experiences (without needing much in the way of planning) and there is a well-defined deadline. Plus, it feels good to be asked for your expertise.

Asking a community member who doesn’t participate much in the blogging or social media world to comment on a blog post, while a relatively easy ask, can often fall totally out of their comfort zone.

freshspectrum cartoon by Chris Lysy: When will they invent a vehicle that combines all the benefits of a bicycle, taxi cab, bus, train, and airplane into a single product.

5. Assembling your community tech stack.

I get asked a lot, “so what technology do you use?” The answer is a list, not any singular tool. And it always depends on the community.

I think it’s better to think of your tech as a bundle, not a single tool. Here are my go-to tools. Keep in mind, there are many alternatives for each that work just fine.

  • WordPress – for the community hub.
  • Zoom – for webinars and other virtual gatherings.
  • Mailchimp – for a regular email newsletter.
  • Eventbrite – for webinar/event registration.
  • Teachable – for hosting self paced learning modules.
  • Canva – for designing communications materials.
  • YouTube – for hosting webinar recordings.
  • Slack – for member to member communications.
  • Dropbox – for communal resource libraries.

You don’t need everything for every community. If you are not a techie, and don’t have the money to hire someone like me to handle things for you, I would certainly advise you to start small.

freshspectrum cartoon by Chris Lysy: So this is our current content strategy (we are winging it).

6. Developing a content strategy.

Regular content is important. Just how regular depends on your community.

Don’t make the mistake of creating a forum and expecting your community to just show up and fill it up with great content. Most of the time, this just leads to dead forums and little to no participation.

Instead try to set a content schedule. Not sure where to start, how about a monthly webinar? This requires you to create a registration page, put out an initial announcement blog post, sharing that announcement and post through email, sending a follow-up reminder email, creating a recap blog post after the event, posting the recording, and sharing the recap/recording through an email.

As you can see, even just one webinar a month can fill a content calendar. Especially if you add bonus content/downloads in the prep stages and the recap. Put it all down on a calendar, and repeat each month.

freshspectrum cartoon by Chris Lysy: 
Webinar Agenda
First 15 minutes- fumble around with the technology.
Next 10 minutes - expert presentation (who will be on mute but not know it).
Next 15 minutes- expert loses internet, time spent trying to get them back.
Next 15 minutes - Give up hope, spend rest of the time showing off pets.
Final 5 minutes - Expert returns (out of breath for some reason), tries to cram 40 minutes of presentation into 5 minutes.

7. Mixing your engagement methods.

Try expert seminars, panel presentations, informal roundtables, expert Q&As, and other engagement methods. There is no rule saying you need to stick to one and only one format. Experiment until you find the right mix for your community.

freshspectrum cartoon by Chris Lysy: When i was your age, we presented in front of real people. We could see their eyes and hear their voices. If our presentation was bad, we knew it.

8. Evaluating your efforts and determining needs.

Once you get an active community going, needs assessment should become easier. But it takes time to get to that point, and early surveys might see very low response rates.

Early on in your efforts I suggest forming an advisory group (drawn from your membership) to help guide your ongoing work. Try to get a group that represents different facets of your overall community. Then set up a regular virtual get together once a quarter or bimonthly.

Written by cplysy · Categorized: freshspectrum

  • « Go to Previous Page
  • Go to page 1
  • Interim pages omitted …
  • Go to page 192
  • Go to page 193
  • Go to page 194
  • Go to page 195
  • Go to page 196
  • Interim pages omitted …
  • Go to page 304
  • Go to Next Page »

Footer

Follow our Work

The easiest way to stay connected to our work is to join our newsletter. You’ll get updates on projects, learn about new events, and hear stories from those evaluators whom the field continues to actively exclude and erase.

Get Updates

Want to take further action or join a pod? Click here to learn more.

Copyright © 2026 · The May 13 Group · Log in

en English
af Afrikaanssq Shqipam አማርኛar العربيةhy Հայերենaz Azərbaycan dilieu Euskarabe Беларуская моваbn বাংলাbs Bosanskibg Българскиca Catalàceb Cebuanony Chichewazh-CN 简体中文zh-TW 繁體中文co Corsuhr Hrvatskics Čeština‎da Dansknl Nederlandsen Englisheo Esperantoet Eestitl Filipinofi Suomifr Françaisfy Fryskgl Galegoka ქართულიde Deutschel Ελληνικάgu ગુજરાતીht Kreyol ayisyenha Harshen Hausahaw Ōlelo Hawaiʻiiw עִבְרִיתhi हिन्दीhmn Hmonghu Magyaris Íslenskaig Igboid Bahasa Indonesiaga Gaeilgeit Italianoja 日本語jw Basa Jawakn ಕನ್ನಡkk Қазақ тіліkm ភាសាខ្មែរko 한국어ku كوردی‎ky Кыргызчаlo ພາສາລາວla Latinlv Latviešu valodalt Lietuvių kalbalb Lëtzebuergeschmk Македонски јазикmg Malagasyms Bahasa Melayuml മലയാളംmt Maltesemi Te Reo Māorimr मराठीmn Монголmy ဗမာစာne नेपालीno Norsk bokmålps پښتوfa فارسیpl Polskipt Portuguêspa ਪੰਜਾਬੀro Românăru Русскийsm Samoangd Gàidhligsr Српски језикst Sesothosn Shonasd سنڌيsi සිංහලsk Slovenčinasl Slovenščinaso Afsoomaalies Españolsu Basa Sundasw Kiswahilisv Svenskatg Тоҷикӣta தமிழ்te తెలుగుth ไทยtr Türkçeuk Українськаur اردوuz O‘zbekchavi Tiếng Việtcy Cymraegxh isiXhosayi יידישyo Yorùbázu Zulu