Hi Dana,
I am a graduate student at Arizona State University and we’ve been looking at the difference between research and evaluation. I appreciate the visual you provided and the thought that evaluation is the bridge between research and practice. Ii helped to illustrate the role that evaluation plays on both ends–in research and in practice. I am intrigued in your assessment that evaluation can use practice to inform research. And even more appreciate your thoughts on boundaries. How can you put a boundary on that? Clearly you did not have an answer for that, but as an evaluator, do you currently see boundaries? How have they impacted you in your work? Thank you for helping me gain better insight into this complex relationship!
Melanie Hunsaker
Self Care Corner: The “Well Done” List
My day-to-day didn’t change much, if at all, when the current pandemic began. As the months passed, I noticed that my mental health and self-esteem slowly declined. Much of it, outside of the psychological impact of dealing with a virus that still has many unknowns and sheltering in place, was due to feeling that I […]
The post Self Care Corner: The “Well Done” List appeared first on Nicole Clark Consulting.
Cleaning Messy Text Data is a Breeze with OpenRefine
We’ve all been there – you get some data from a client or a survey you’ve run, and you can’t wait to start answering your evaluation questions. But you find one of your data columns is a complete mess because it was an open-ended text field. Maybe you asked respondents to enter their province, job title, or favourite Halloween candy. And they answered your question, but everyone spelled things a little bit differently, some capitalized each word, others used all caps, some included their town and province, others entered the abbreviation for their province. The list of ways your open-ended text fields can become messy goes on and on.
Now, when you want to analyze the data from that text column you need to go through and clean the data so that everything is consistent. This can be a day-ruining, brain-melting task, especially if you have to go through and clean up hundreds or even thousands of data points. But this doesn’t have to ruin your day – I’m going to show you how to use OpenRefine to make this task a million times easier. And because it’s October, we’re going to talk about Halloween candy!

What is OpenRefine?
OpenRefine is a free, open-source program designed for data cleaning and transformation (a.k.a. “data wrangling”). It has many features, which you can learn about on their website, but for this tutorial we will focus on using it to clean the kinds of messy, inconsistent text data I mentioned above. This data might come from a survey with an open text field, or perhaps administrative data being entered by program staff. Whatever the source, it needs to be cleaned and standardized before you can do any kind of summarizing.
The Messy Survey Data
Picture it: October, 2019. It’s a regular year and you’re getting ready for trick or treaters to come knocking. But this year, you want to make sure you are giving out the best candy in the neighbourhood. Like any good evaluator, you decide to conduct a survey asking people which candy brings them the most joy – that way, you can be sure to stock up on everyone’s favourites.
When your survey is complete, some of the responses to “What Halloween candy brings you joy?” look something like this:
-
Little Debbie snack cakes.
-
Little Debbie snacks.
-
Little shot bottles of booze
-
Pay day, sweettart ropes, mentos
-
Payday
-
Payday Bar
-
Payday bar, Ferrero Rocher,
-
PayDay Bars
Of course, with any large survey you’re bound to get some jokesters (like little bottles of booze)! But more importantly, how are we going to know how many people want Payday when it’s all spelled differently? Excel won’t be able to recognize them as the same chocolate bar to add up. Let’s download OpenRefine so we can fix this.
If you’d like to follow along, download the 2017 Candy Hierarchy data here (credit to the University of British Columbia).
Step 1: Import data to OpenRefine
When you start OpenRefine, it opens in your web browser. Don’t worry, your data won’t be connected to the internet – it is all kept locally on your computer. The web browser is just the interface used to run the program.
Once you’ve launched the program, click Create Project (1), then Get data from… This computer (2). Choose a file, navigate to your spreadsheet of choice (in this case, our candy data), and click Next.
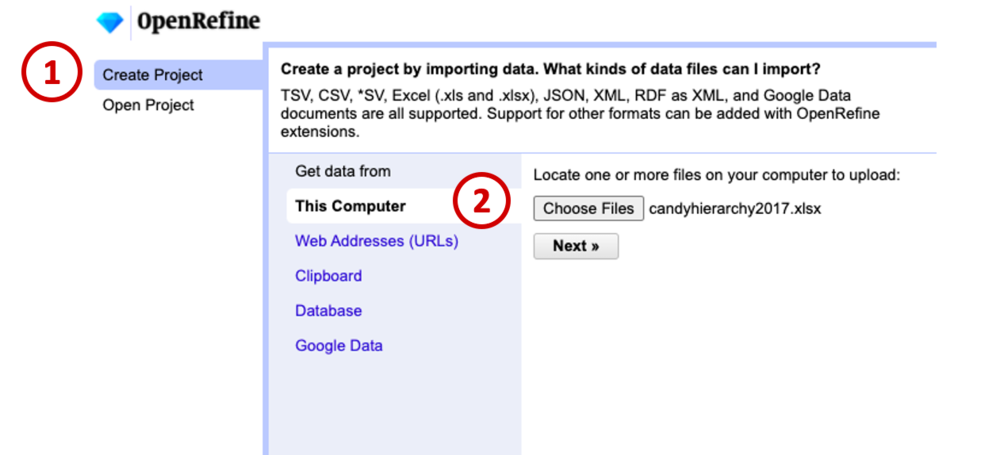
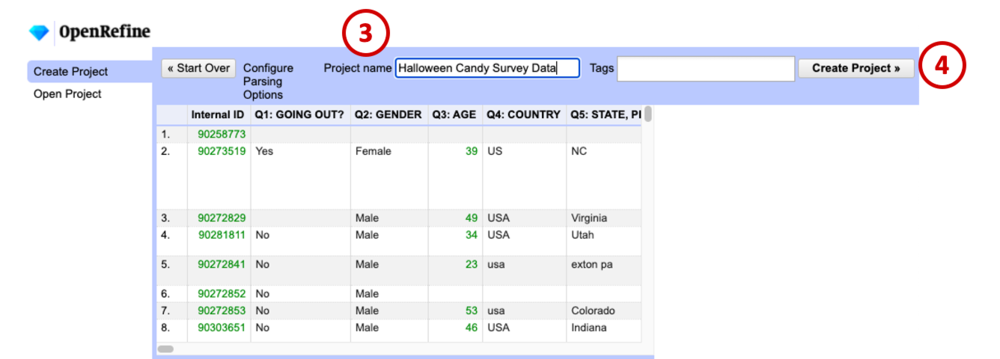
Make sure the data looks right in the preview window, give your project a name (3), and click Create Project (4).
Step 2: Split columns with lists of candy
The first transformation we’ll do is split up cells containing more than one candy. For example, we need the computer to recognize “Payday bar, Ferrero Rocher” as 1 vote for Payday, and 1 vote for Ferrero Roche. To do this, navigate to the relevant column in your data (in our example it’s Q7), click the down arrow on the column header to open the menu (5), select Edit cell, then Split multi-valued cells… (6).
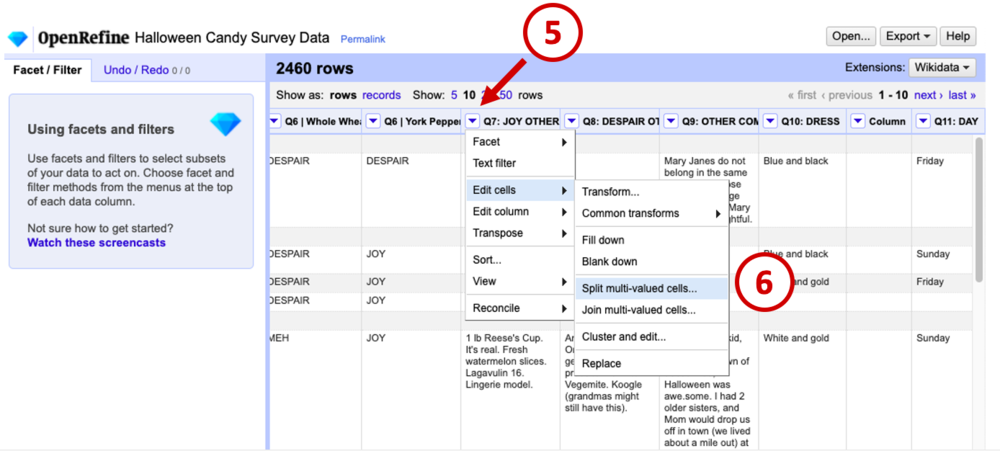
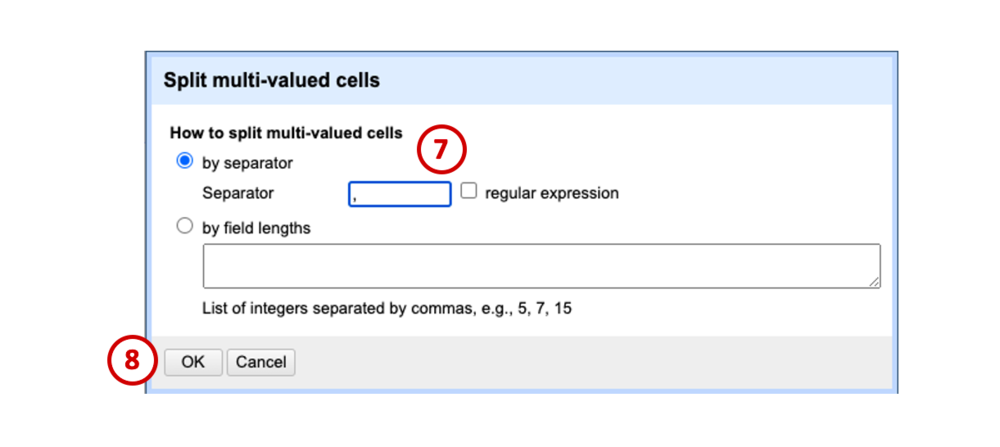
In the dialogue box that appears, leave the default, which is to separate cells by comma (7), and click OK (8). This tells the program “Everywhere you see a comma in this column, split the text into a new cell.”
Before we did this, we had 2460 rows, and now we have 3267 rows. This is because each item is now in its own row instead of being listed with commas between. For example, “Payday, Fererro Roche” becomes:
Payday
Ferrero Roche
Step 2: Merge similar candy names together
Now that we have separated lists of candies into individual candies, we can start to clean the text by grouping similar candies together. For example, we need to change pay day, payday, PayDay, and payday bars all to “Payday.” Without OpenRefine, this would be a manual task of searching through the list and fixing them.
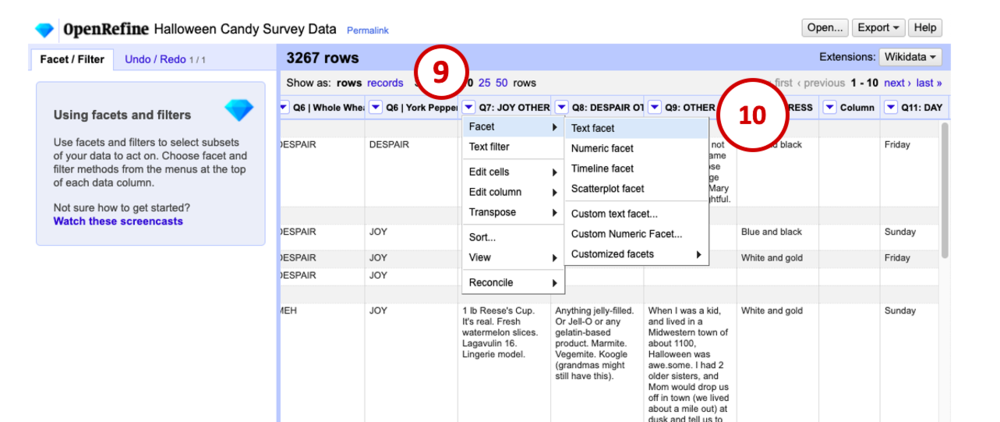
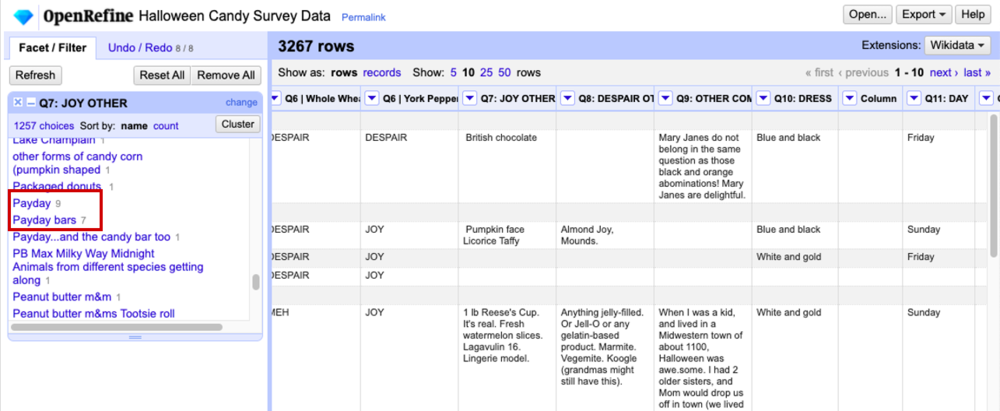
OpenRefine can do this automatically using a facet. Facets are like filters that allow you to summarize and clean entire chunks of your data. First, go back to that dropdown menu on the Q7 column (9), choose Facet, then Text facet (10).
The text facet we just created on the Q7 column appears in the panel on the left side of the window. It shows each value of Q7 and how many times it appears. You can see some of the different variations of Payday that people entered, and lots of them show a 1 beside them, meaning only one person entered that exact answer. We’re going to change that though. The cluster button in the facet pane allows us to group together similar responses and rename them as a batch.
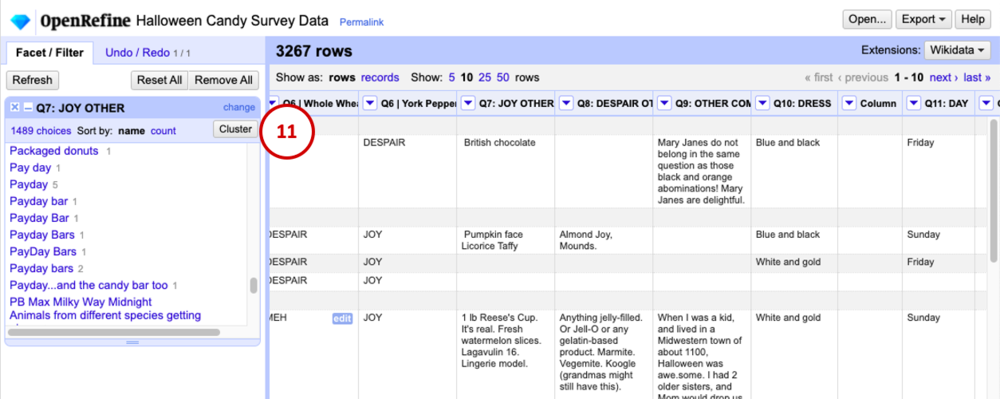
Click Cluster (11). Ta da! This is the part that gets me really excited as a data nerd – the program uses “fuzzy matching” to take a best guess at which pieces of text actually refer to the same thing. You can play with the Method and Keying Function to change the type of algorithm used to fuzzy match – but we’ll leave the defaults for this tutorial.
The Values in Cluster column shows you which values it thinks belong together. The first one looks good, it’s just a bunch of variations on “Almond Joy.” To clean all of these values in the dataset, we will check the box under Merge? (12) and make sure the New Cell Value is correct (13). Now, every item in Values in Cluster will be updated to the New Cell Value.
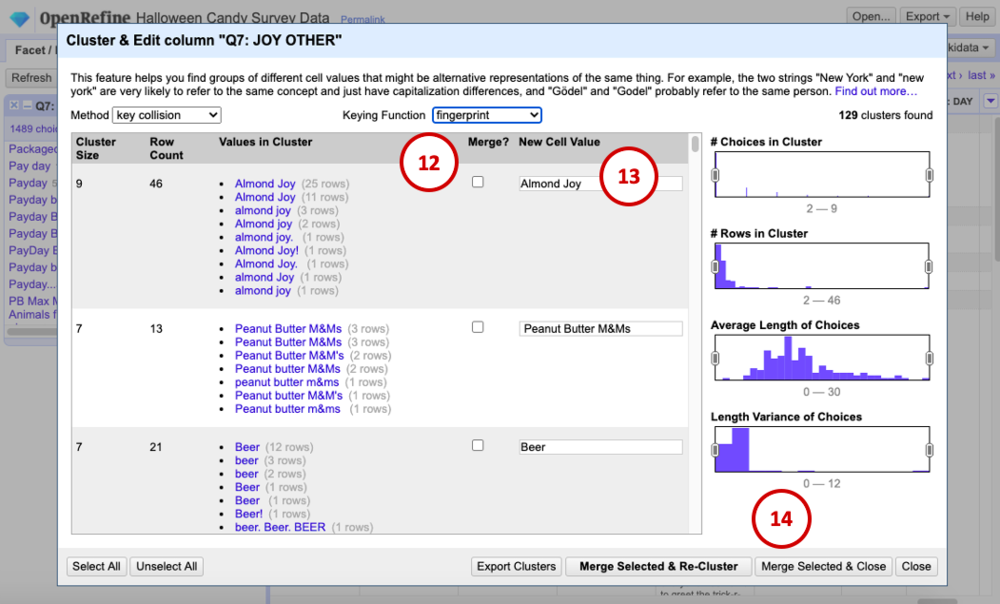
Continue going through the list in the same way, checking the box for clusters you’d like to merge, and when you’re done, click Merge Selected and Close (14). Before we started merging, there were 1489 different values in the Q7 column. Now there are 1257, meaning we were able to automatically clean 232 values from the dataset!
The program does a great job of matching the correct values, but as with anything automated, you should go through and look at your data for any discrepancies. For example, “Payday” now has 9 entries, and “Payday bars” has 7 because the algorithm doesn’t know these two actually refer to the same thing (we would simply manually merge these two categories).
When you are done cleaning, you can export your data back to Excel by clicking the Export button in the top-right, then do a little happy dance for all the time you saved!
Summary
Using OpenRefine, we took some messy (and delicious) Halloween candy survey data, separated the cells by comma, then used fuzzy matching to cluster and rename batches of values. Now we have data that is in much better shape for any final cleaning or analysis.
If you try OpenRefine on your own messy text data, tell us about it on Twitter or the comments below!
Sign up for our newsletter
We’ll let you know about our new content, and curate the best new evaluation resources from around the web!
We respect your privacy.
Thank you!
Narration Interrogation

Police (and some parents) know the secret to spotting a lie in a story: ask someone to repeat that story backwards. As it turns out, it’s a lot easier to concoct a false story going forward than it is backward because of the way we logically connect events in our heads.
This same technique can be used to help spot gaps in logic. Even if we’re not lying to one other (or ourselves) we may find some parts of the story that don’t quite make sense. This gap in logic is not uncommon because as humans we often will fill in the story because of how we are wired for narrative coherence as a species.
Narrative interrogation is a way that we can walk through the story of our program or service to help us identify the key elements that are present in most good stories and how or whether we have them organized (or have them at all). Unlike real interrogation, this is not aggressive or adversarial — rather a way to explore stories through inquiry.
Story Elements
Some of the key elements in a good story are:
- Actors. These are your protagonists (the leads), the supports, and the chorus — those in the background. Ask yourself who the main actors are in each scene of the story (e.g., who has the problem that needs solving? What are they looking for? What is their motivation?). This is where using personas can be helpful to fill in the details about these characters.
- Relationships. How are the actors related to each other? Are they working collaboratively or competitively and do they need each other? Are there roles that individuals fill? Are there special qualities to their relationship (e.g., power, partnership, etc.).
- Setting and Structures. Where are things taking place? Do people need a particular service or product in a specific setting or context? Articulating these will also help you to frame the way in which system structures shape the interactions between the actors and help contribute to or facilitate the problem (or solutions).
- Time. Determining when things are to happen and how that temporal aspect shapes everything is important. Does timing matter? Does the amount of time matter? is the problem and solution one that is highly dependent on when something happens or not?
- Arc. The last piece is creating some form of coherent story arc between them all. Tying them together helps us understand who is involved, what they are interested in or seeking, why they have the challenges they do, how they are going about things now (and how we could change that with an intervention of a product or service) and the ways in which that will be affected.
Together, this starts to generate a theory of change and helps us connect what we’re seeking to do through our innovation (service, product, policy) and what is needed by those we are aiming to serve.
Using the Method
Stories are told by people, not objects, so this is one method where speaking with individuals is key. Involve those for whom the story matters in the telling of that story. This might be customers or clients, service operators, managers, or founders; it depends on what story you are looking to hear. The aim is usually not to capture everything, rather keep it focused on a specific aspect of your innovation. It might be in use (customers or clients), the development (product team) and marketing, or in understanding the purpose relative to the organization (e.g. senior management).
Using an open-ended approach — free-form — ask people to speak about the topic using a story lens:
- Start with the beginning: what is the first thing someone needs to know. This might be the choice to start the project, the moment the ‘problem’ appeared that required a solution, or even the backstory. This is something that the storyteller determines on their own.
- Focus. Encourage the person to speak in a manner that focuses on the purpose, however, ask points of clarification when it is unclear what the connection is at different parts. Good stories often involve non-sequiturs and so do poor ones; it’s important to know which one it is.
- Reflect back. Once the story is told, re-cap the logic of the story from front to back and
- Go backwards. This is the ‘interrogation’ part of sorts. Ask people to retell the story backward from the end. For example, ask what happened right before the conclusion of the story and then what happened before that and before that. It’s similar to the reverse of A Day in the Life method.
What you might find is that the story has different descriptors, relationships, or emphasis when told backward. These allow us to see different configurations of the issues that are associated with the story. It’s not that the person is necessarily lying or keeping anything from you, it’s about the limitations of narrative in that it only works with one set of issues connected logically at a time. Going backward allows us to see things differently, expanding our view.
The interviews and conversations with those involved should be informal and relaxed and can go into as much depth as you want. Generally, this is an approach that makes for a good ‘coffee conversation’ of about 30 minutes. It also can be done remotely, if necessary. It can be done internally by staff associated with the project or externally by an outsider. If the story involves highly sensitive subject matter or material, it is best to use an outsider to the project.
Learn more from your program, your people, and your work with this simple, powerful method for design exploration and research.
We help with storytelling through data. Contact us if you want to implement this with your organization.
The 2020 Election: A Little Context
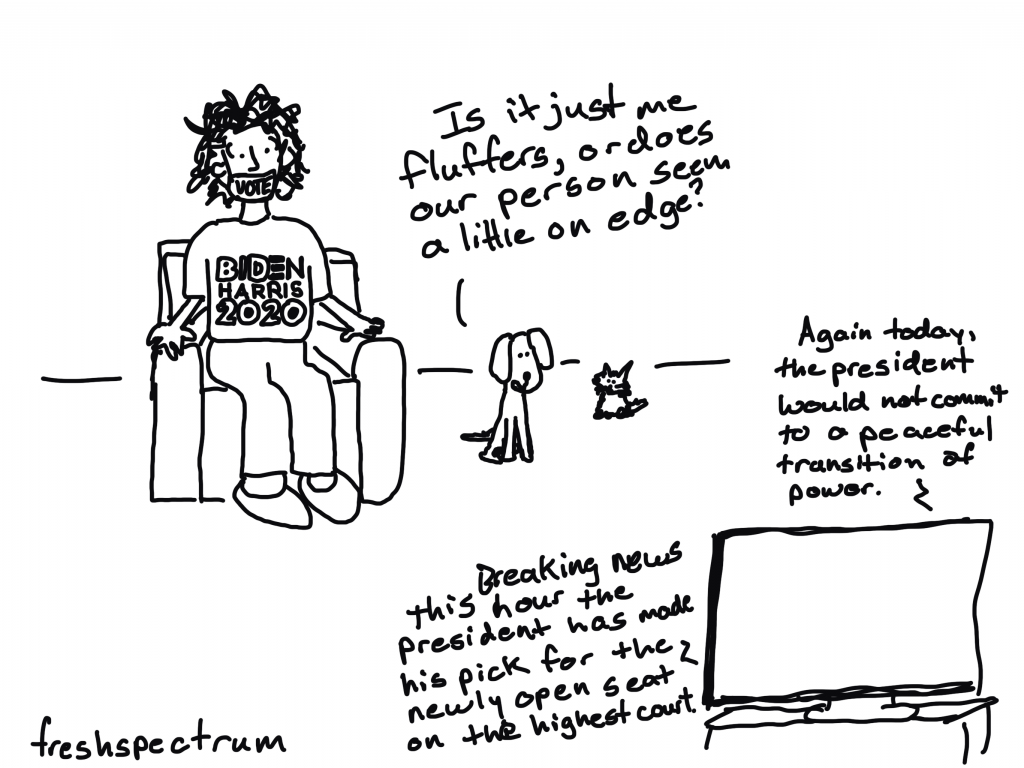
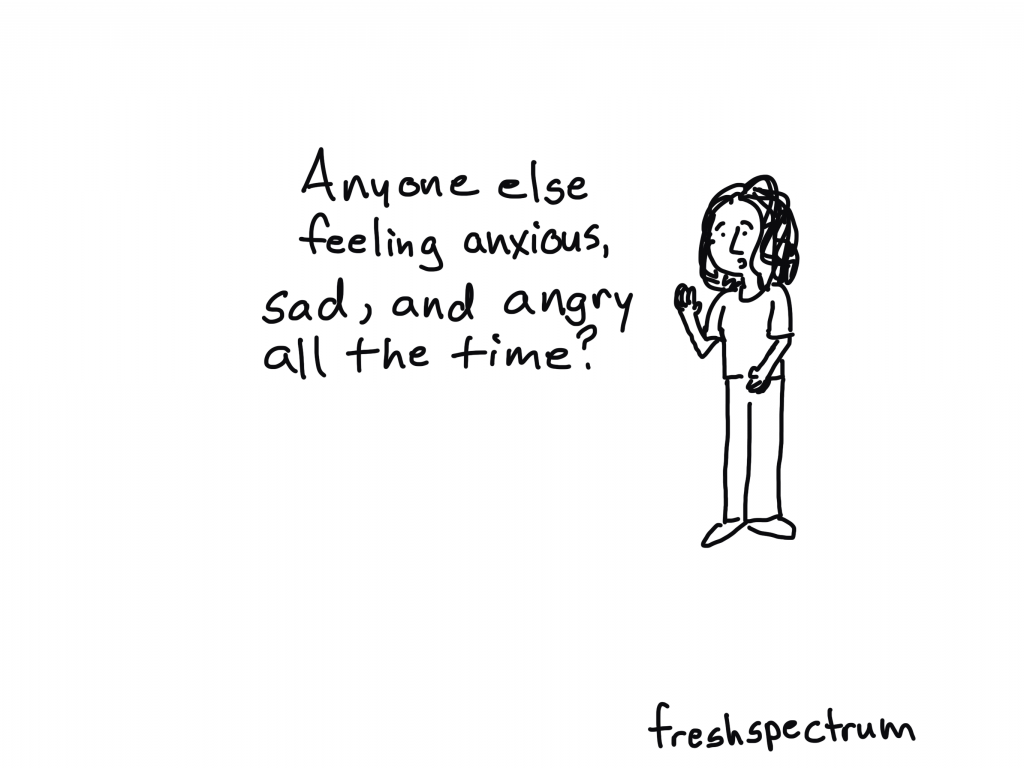
I am a little stressed out.
In the US, voting in the general election has begun. My wife and I dropped our ballots off at the post office yesterday.
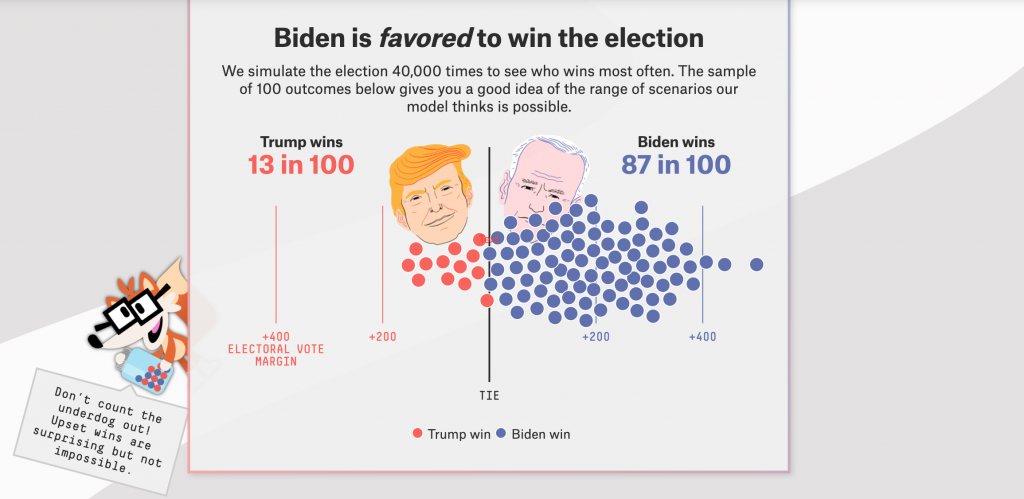
It’s not that I don’t think we have good shot of voting Trump out office, I think we do. But after the events of 4 years ago, I take nothing for granted.
If you look at the national numbers, this election shouldn’t be particularly close. But unfortunately, that’s not how it works. While not the likely outcome, Trump still has the chance for an upset.
As a good number of you who follow my cartoons and receive this newsletter are not in the US, I thought I would provide a little bit of extra historical context. Cartoon Style.
The United States is a representative democracy that slants toward a republic.
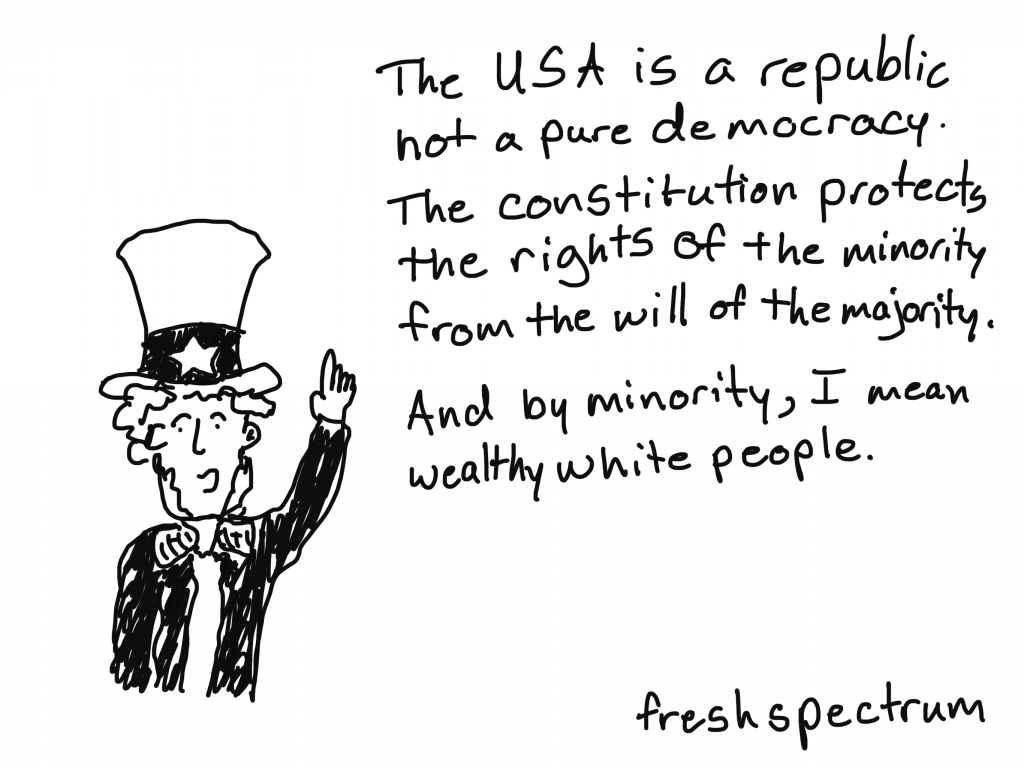
The United States, like most modern nations, is neither a pure republic nor a pure democracy. Instead, it is a hybrid democratic republic.
The popular vote doesn’t elect the president and vice president. Instead the election is the result of voting by the electoral college. This how Trump won in 2016 even though he did not win the popular vote.
The powers given to southern slave states during the founding of the US continue to reverberate.
Altogether, the three-fifths compromise had a detrimental impact on vulnerable populations, such as the enslaved and the nation’s Indigenous peoples. Slavery may have been kept in check rather than allowed to spread without it, and fewer Native Americans may have had their way of life upended, to tragic results, by removal policies. The three-fifths compromise allowed the states to unite, but the price was harmful government policies that continued to reverberate for generations.
The uneven representation within our political system has existed since the dawn of our democracy. Even as men and women were treated as though they were not men and women, southern representatives were fighting for enslaved people to be “counted” in the formulas that established political power.
This unequal political power continued well after the fall of slavery.
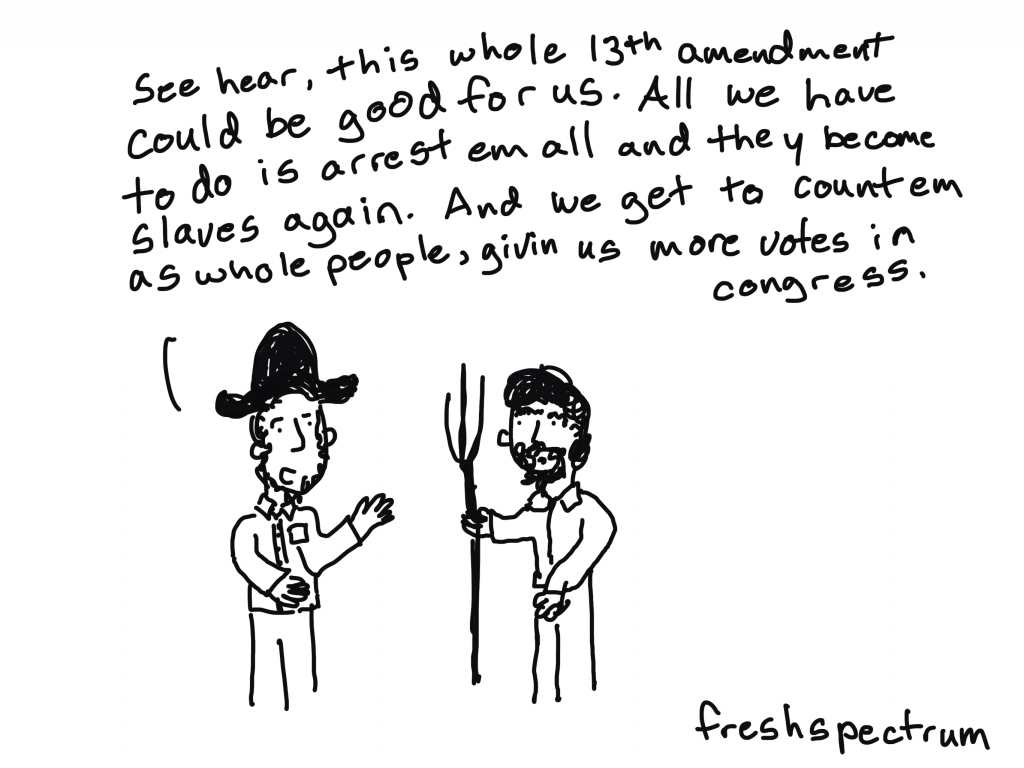
Even the 13th Amendment, written to end slavery, gave enough wiggle room for southern states to suppress the votes of black southerners (or re-enslave through the prison system) while accumulating additional representational power in congress.
Section 1. Neither slavery nor involuntary servitude, except as a punishment for crime whereof the party shall have been duly convicted, shall exist within the United States, or any place subject to their jurisdiction.
All 50 states in the US were established prior to the Voting Rights Act of 1965.
All but 2 states (Alaska and Hawaii) were established prior to the 19th Amendment in 1920, which gave women the right to vote (white women).
Each state is given 2 senators. And the senate holds a lot of power, including the power to confirm Supreme Court nominees.
Washington DC is home to approximately 700,000, and the majority group in the district is black. Washington DC is not a state, and has no voting members in the US Senate.
Wyoming is home to approximately 600,000, and the majority group is overwhelmingly white. Wyoming is a state (it become one in 1890). It has 2 voting members in the US Senate.
These states were created as the country broke treaty after treaty with the indigenous peoples who’s ancestors lived on this land long before the first colonists.
Interested in diving deeper into US history?
One book I would recommend is Paul Ortiz’ An African American and Latinx History of the United States.
Spanning more than two hundred years, An African American and Latinx History of the United States is a revolutionary, politically charged narrative history, arguing that the “Global South” was crucial to the development of America as we know it. Scholar and activist Paul Ortiz challenges the notion of westward progress as exalted by widely taught formulations like “manifest destiny” and “Jacksonian democracy,” and shows how placing African American, Latinx, and Indigenous voices unapologetically front and center transforms US history into one of the working class organizing against imperialism.
An African American and Latinx History of the United States.
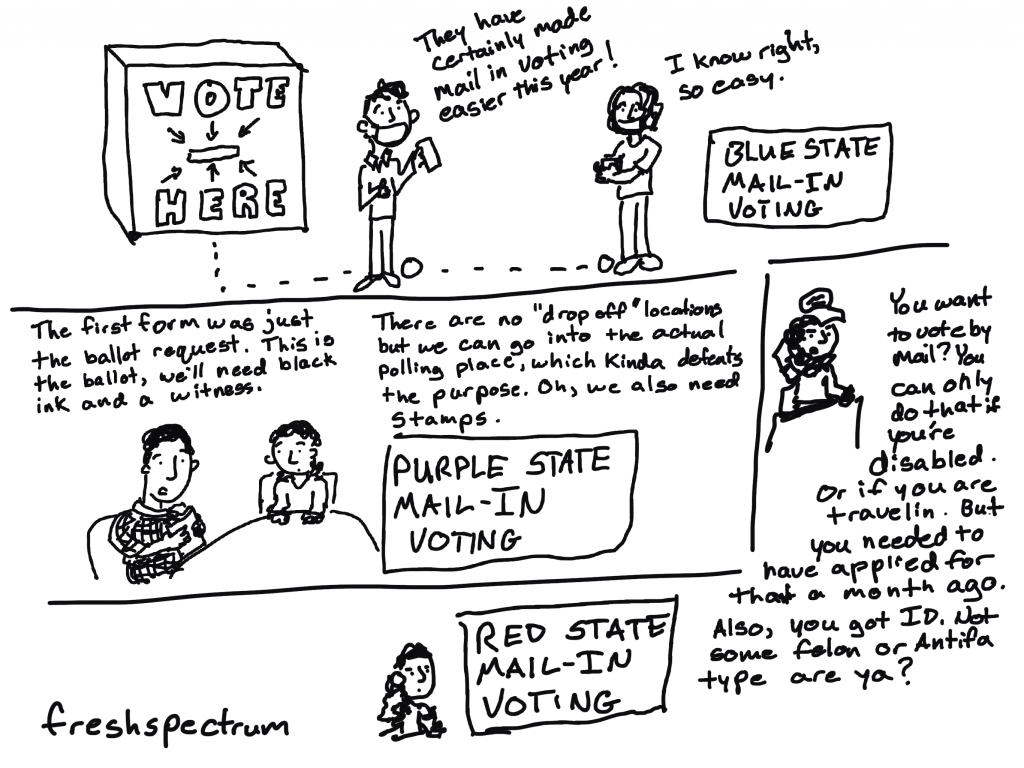
Why you see lines at polling stations.
I live in North Carolina, which is a purple state.
We have a governor who is a democrat, two republican senators, and a state legislature full of republicans.
Mail in voting here was not exactly easy, but it wasn’t impossible. We didn’t have to make an excuse, just request a ballot. And we had to have a witness sign our envelope before putting our ballots in the mail.
Friends in Maryland seem to have it easier. But some friends in the deeper south definitely do not.
I’ve written so far about just some of the history behind our country. Making it hard for some people to vote in order to gain an unfair advantage is simply an American tradition.
The United States is a Deeply Segregated Country
The United States is on track to be a majority-minority nation by 2044. But census data show most of our neighbors are the same race.
The US is know for its wide open spaces. And if you’ve ever had the opportunity to drive across this country, you’ve seen them. Where we live, and the people who surround us, shape our lives in so many ways.
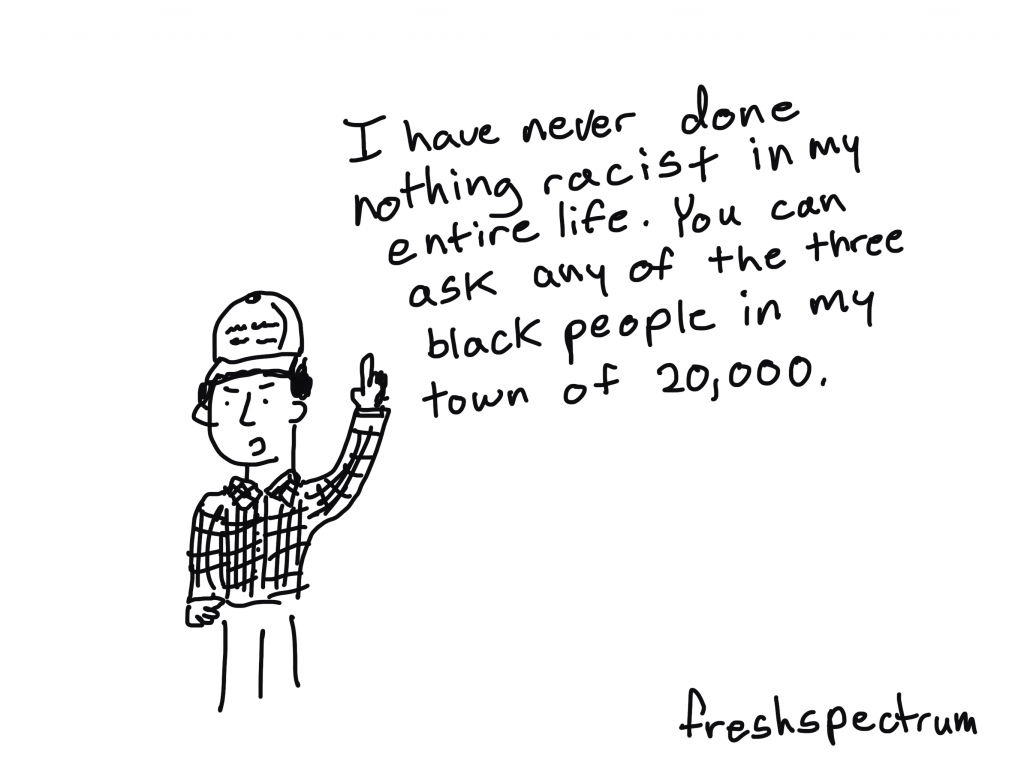
I grew up in a red pocket of a blue state. It was a segregated (white majority) exurb about a half hour west of Baltimore. Many of the people where I grew up are now Trump supporters.
The vast majority would never consider themselves racist, even the ones who support overtly racist policies and laugh at horrible racist jokes/memes.
Living connected but very different lives
Neither racism nor segregation is just a southern thing in the US. Racism has had a huge impact in this country, north and south. And the north’s racist history has also shaped politics.
But in Vienna, as in hundreds of mostly white towns with similar histories across America, much is left unspoken. Around here, almost no one talks openly about the violence that drove out Black residents nearly 70 years ago, or even whispers the name these places were given: “sundown towns.”
Unless they’re among the handful of Black residents.
“It’s real strange and weird out here sometimes,” said Nicholas Lewis, a stay-at-home father. “Every time I walk around, eyes are on me.”
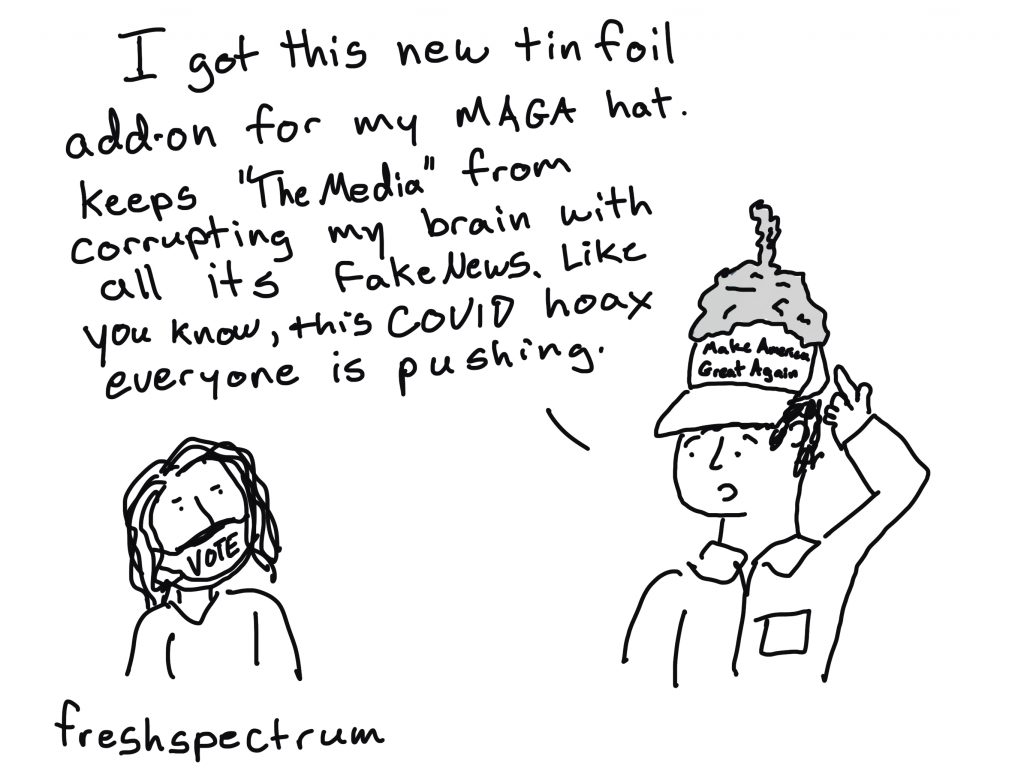
Building paranoia and fanning the flames
Popular right wing bloggers are doing their best to spread misinformation. And considering our internal disconnects from people who don’t think like us, and social media’s echo chamber creating algorithms, this misinformation is boosting dangerous rhetoric.
It’s a little too easy to draw parallels between current events and the McCarthy era red scare.
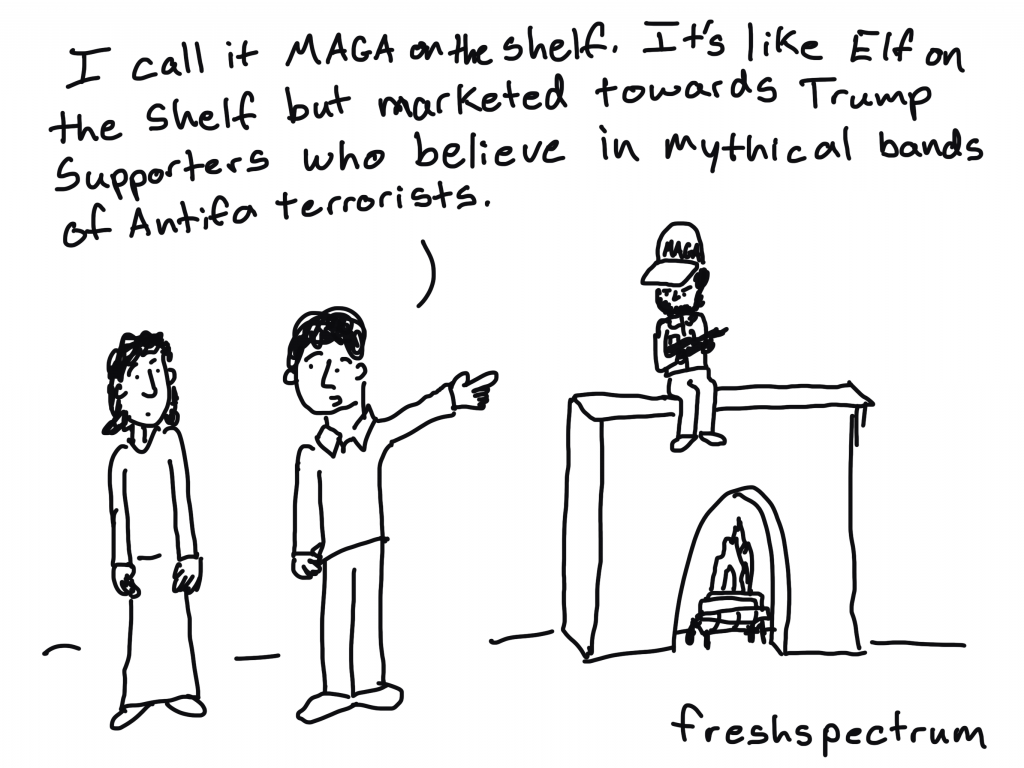
The far right has been shown to pose a far greater danger, so why are so many Americans afraid of anti-fascists?
Whether COVID or ANTIFA, the president and his political allies are boosting the lies.
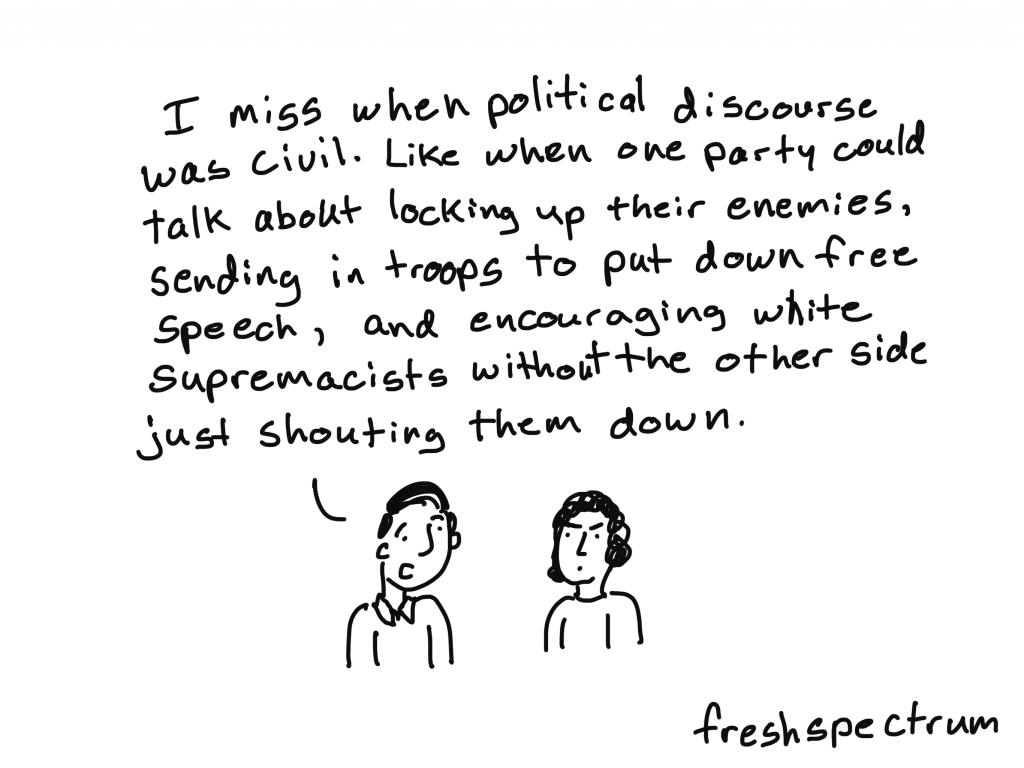
Politics have always come with a bit of “spin.”
But what the president has been doing consistently is not spin. It’s just plain lies. Lies that ramp up his base and trigger extreme actions.
President Trump, who announced overnight that he and first lady Melania Trump have tested positive for the coronavirus, has repeatedly downplayed the severity of the coronavirus pandemic and often contradicted public health experts and members of his own administration in their more grave warnings about the virus.
They believe they are patriots
White supremacy and far-right terrorist groups have a supporter in the highest office in the country. When white guys wearing camouflage and holding assault rifle show up at polling places, they believe they are doing what’s right.
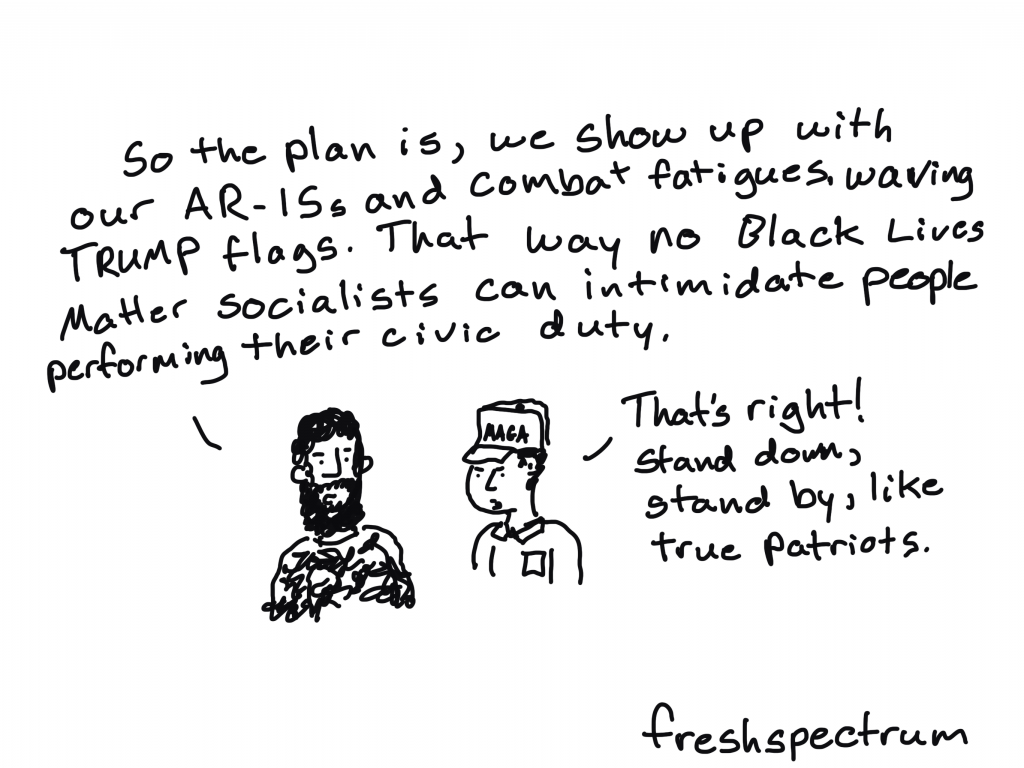
Even after the FBI disrupted an alleged terrorist plot to kidnap Michigan Governor Gretchen Whitmer, the president keeps fanning the flames of violence.
Oh, and we are still a country run mostly by white men.
You’ll likely see a bunch of rhetoric tying Kamala Harris to socialism in a way that won’t be done for Biden. And the language used to talk about Harris is horrible. I mean just a week ago Trump called Harris a Monster.
But as extreme as Trump can be, I think the insidious nature of misogyny in this country was more on display during the presidential debate. And then in discussions following the debate, which quickly shifted away from the constant manterruptions to the fly that landed on Pence’s head.
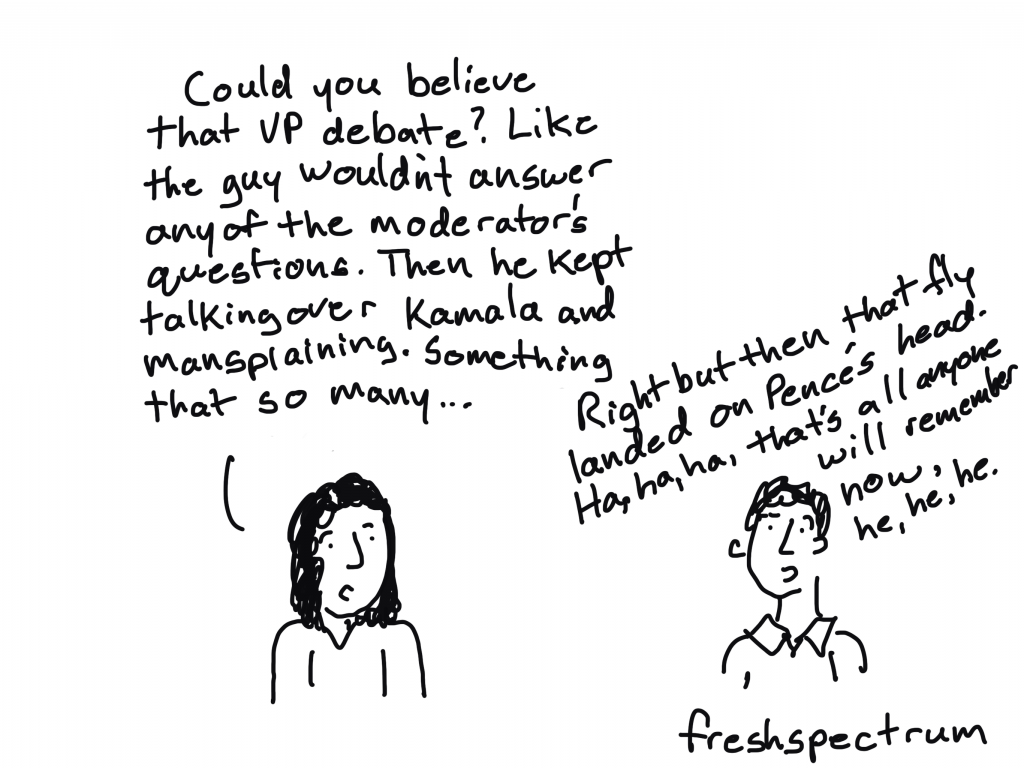
Yes, there was a fly on Vice President Mike Pence’s head during this week’s vice presidential debate. But before the insect stole the show, social media was already abuzz with comments about Pence’s multiple interruptions of his opponent, Senator Kamala Harris, and his refusal to stop talking when moderator Susan Page called time.
Page signaled to Harris to stop talking 13 times. She had to signal Pence 45 times.
Vote
If you are in the US and reading this, please vote. Even if it’s hard. Even if it doesn’t seem like it will matter in your state. Please vote.
If you have family or friends in the US that you can encourage to vote. Please do. Don’t assume that everyone votes, because they don’t.
This election needs to be a referendum on how this country should be governed. And while I am not happy that this is an election between two old white guys, I do know that one is far better equipped to lead this country.