• Skip to main content
  • Skip to footer
  • Home

The May 13 Group

the next day for evaluation

  • Get Involved
  • Our Work
  • About Us
You are here: Home / Archives for cplysy

cplysy

Oct 07 2020

How is Making Bread Related to Evaluating Communities?

by Ann Price

Two loaves of Sourdoughbread

You may or may not have heard about the COVID bread craze. Just to set the record straight, I didn’t start baking bread out of some fear that the store shelves would be stripped of all carbs. I just happen to like to cook and since we couldn’t go anywhere, I found solace in the kitchen. I started by learning how to make no-knead breads. Then one day, I took the plunge into the world of sourdough breadmaking.

When I attempted my first starter, I failed miserably. For three weeks I tried to feed the starter. But no matter what I did, the yeast colony would not grow. Frustrated, I started all over. During this time, I questioned if this was a good use of my time and precious flour. I fretted and fussed. I wanted to quit. I got advice and encouragement from my older sister, and kept going. Don’t give up she said. Look at your starter, not the instructions. Finally, after 3 weeks, I had a healthy starter.

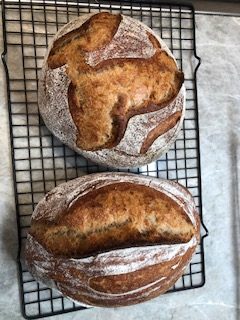
Getting your starter going is only the half of it. Then you have to learn to bake it. My first few attempts were, well, less than stellar. My starter was still young and some loaves didn’t rise well. Some loaves were too doughy. Some were overcooked. More than one was dense and heavy.

I know, by now you are wondering what the heck baking bread has to do with evaluation or community change?

Just like learning to bake bread, real community change takes time.

First, you need to build the evaluation capacity of your organization, staff coalition, or community. You also need the right recipe. You need to understand your local data and root causes; have the right partners; develop a strategy that address the root causes; and design and implement your strategy. Finally, you need an actionable evaluation plan that will yield the powerful evidence you need to demonstrate that you are making a difference.

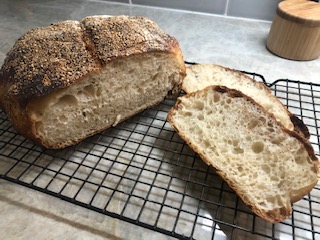
It’s a process; a complicated, messy process. But just like learning to make bread, so worth it. Nothing tops the smell of fresh baked bread or enjoying it once baked. And nothing tops an effective community coalition.

Helping communities build their evaluation capacity brings me a special kind of joy. Curious about your nonprofit, foundation or community coalition’s evaluation capacity? I have a free capacity assessment for you.

And just in case you want to give sourdough breadmaking a try, here is my go-to, almost always works, favorite recipe.

Take care and be well-

Ann

P.S. Let me know if you need and sourdough starter.

P.S.S. Or an evaluator. I bake bread and help communities.

Written by cplysy · Categorized: communityevaluationsolutions

Oct 07 2020

Six Hacks for Renovating Your Evaluation Report Part 2: Consistency is Cool


This series of posts walks you through how to reno your evaluation reports using six of Canva’s design lessons. Part 1 focused on how to take your audience on a journey using storytelling techniques. Part 2 in this six-part series focuses on how to format your report with a consistent, cohesive look using two formatting elements: colour and font.


Patterns make learning easier

Human brains love taking in information. Visual information is our brains’ favourite information – it is our brain’s priority sense. Because of our brains’ proclivity for information they are constantly searching for visual cues (e.g. shapes) and particular attributes of those cues (e.g. colour, size, texture, angle, etc.). When our brains see those cues, they try to process that information as easily and efficiently as possible. Over the years our brains have evolved to adapt the ‘work smarter, not harder’ mentality; our brains look for patterns because it makes learning easier.

We need to take advantage of our lazy (but evolved) brains with our evaluation reporting. Let’s make reading our reports as easy as possible by giving our brains some consistent patterns that increases the chances our readers will more easily learn the information we are trying to convey. Two easy ways you can create a consistent cohesive look in your evaluation report is through the consistent use of colour and font.


Using colour consistently

When you are using colour in your report you want to think about two things: 1) Creating a strong palette and 2) Considering colour theory. There is no need to reinvent the colour wheel. You can find strong colour palettes using sites like Coolors, ColourLovers, or Adobe Color. My colour palette is often inspired by an image I used for my report. Most of the sites I just mentioned will allow you to upload an image and create a palette based on the colours in that image. 

Evaluation report image and associated colour palette


The image above was used for a report I did where the outcomes were focused on women’s wellness and well-being. Using that image, I developed a colour palette that focused mainly on the greens in the picture. I chose green because green is often associated with concepts like nature, peace, growth and health – concepts related to the intended outcomes. Being intentional about your choice of colour and the mood it conveys is being considerate of colour theory, but also helping our brain with pattern recognition.

Once you’ve decided on your palette you can create a custom palette in Microsoft and use it throughout your report to create a consistent, cohesive look to your report. The image below shows how I used the colour palette throughout the report (i.e. in tables, graphs and call out boxes), along with the cropped sections of the main image, to create consistency throughout the report.

Example of using a colour palette in an evaluation report

Using font consistently

Another way to create consistency throughout your report is with fonts. Similar to colour, fonts should be used purposefully to signal important elements. The best way to do this is to create hierarchies in your report. This means your titles, subtitles and heading levels have different fonts, formatted differently, but used consistently throughout your report to create a report hierarchy (see below).

Use heading levels to create consistency in evaluation reports

An easy way to make sure you are using your fonts consistently is to use the style pane in Microsoft and set up your font hierarchy. You can also do it manually using a table like this:

For each heading style (e.g., Title, Sub-title, Heading 1) include information on font type, font size, font RGB (colour), and font style.

For each heading style (e.g., Title, Sub-title, Heading 1) include information on font type, font size, font RGB (colour), and font style.


You want to make sure that the fonts you choose accurately reflect the mood you want to portray. Similar to colour, our brains have ingrained ideas of fonts and the personality each represent. In our storytelling with data workshop we illustrate this by showing words to our constitution act in two different fonts (see below). As you can see, the comic sans font on the right looks more appropriate as a note to a child.

A comparison of Canada's constitution in a serif font vs. comic sans

A comparison of Canada’s constitution in a serif font vs. comic sans

Remember, creating consistency in our reporting isn’t just about formatting elements consistently throughout your report, but choosing elements (e.g. colour and font) that are consistent with what your audience expects. 

Try it out and make sure to stay tuned for the third article in our six-part series, “Practice Proximity” where I show you how I reno’d an evaluation report just by grouping and spacing information.


Sign up for our newsletter

We’ll let you know about our new content, and curate the best new evaluation resources from around the web!


We respect your privacy.

Thank you!


Written by cplysy · Categorized: evalacademy

Oct 07 2020

Evaluation is a dangerous profession.

Evaluation is a dangerous profession.

Not dangerous as in it requires hard hats or tethers. But dangerous in that it questions realities most would rather ignore. Traditions that are so deeply entrenched within organizational structures that merely hinting at their instability can lead to alienation and professional isolation.

Our frameworks and methods exist not only to allow us to answer important questions and make proper evaluative judgements of merit, worth, and significance. They provide the important structural scaffolding we, as evaluators, require to be effective.

Society must accept that some things are real; but he must always know that visible reality hides a deeper one, and that all our action and achievement rest on things unseen. A society must assume that it is stable, but the artist must know, and he must let us know, that there is nothing stable under heaven. One cannot possibly build a school, teach a child, or drive a car without taking some things for granted. The artist cannot and must not take anything for granted, but must drive to the heart of every answer and expose the question the answer hides.

James Baldwin from The Price of the Ticket: Collected Nonfiction

The real difference between research and evaluation.

While researchers follow their intellectual curiosities in order to answer questions. Evaluators follow their own as they proceed to question answers.

For a non-profit executive director that has put their heart and soul into a mission that has become their life’s work, of course the program works. Because if it didn’t, what does mean?

For the civil servant who is sworn to protect the health and welfare of thousands, of course they are fulfilling their mission. If they do all they can and give it their best, how could they possibly be making things worse?

If the decisions made by a group of people around a table set into action teams of highly qualified professionals, the wrong decisions could waste not only the decisionmaker’s own money and time but also keep others from making a real difference elsewhere. So they just have to be the right answers. Even if they are not.

If a new political party assumes control of their government, changes to programs will occur. Because they are programs the other people put into place, therefore, they must not work.

Someone already knows the answer (that yes, the program works or no, the program does not work). Questioning those answers is the purpose of evaluation.

The entire purpose of society is to create a bulwark against the inner and outer chaos, in order to make life bearable and to keep the human race alive. And it is absolutely inevitable that when a tradition has been evolved, whatever the tradition is, the people, in general, will suppose it to have existed from before the beginning of time and will be most unwilling and indeed unable to conceive of any changes in it. They do not know how they will live without those traditions that have given them their identity. Their reaction, when it is suggested that they can or that they must, is panic… And a higher level of consciousness among the people is the only hope we have now or in the future, of minimizing damage.

James Baldwin from The Price of the Ticket: Collected Nonfiction

Uncovering inconvenient realities.

So as a data visualization designer I sometimes play a role in simplifying complexities.

But so often those complexities that evaluators want to simplify, are not the kind that need data visualization design. Because they are not complex in the way that they are hard to understand. They are complex in that they are inconvenient and call into question all sorts of other assumptions.

These types of complexities don’t need to be simplified. They just need to be communicated.

A chart can be a good medium for communicating things that are hard to hear. And it doesn’t even need to be a complex chart. It’s the reason why simple bar charts and line graphs have stood the test of time. Numbers have power, and charts can amplify that power, even when the source is suspect.

A cartoon can also be a good medium for communicating this type of complexity. The medium allows you to say things you would never put down with words on paper or even say out loud.

The crime of which you discover slowly you are guilty is not so much that you are aware, which is bad enough, but that other people see that you are and cannot bear to watch it, because it testifies to the fact that they are not. You’re bearing witness helplessly to something which everybody knows and nobody wants to face.

James Baldwin from The Cross of Redemption: Uncollected Writings

You are not alone.

To each his suff’rings: all are men,
Condemn’d alike to groan,
The tender for another’s pain;
Th’ unfeeling for his own.
Yet ah! why should they know their fate?
Since sorrow never comes too late,
And happiness too swiftly flies.
Thought would destroy their paradise.
No more; where ignorance is bliss,
‘Tis folly to be wise.

Ode on a Distant Prospect of Eton College by Thomas Gray

For a little while a few years back, I tried to pretend that I was no longer an evaluator.

I was disillusioned by the amount of money we as a society would spend collecting data and writing reports that would subsequently not be read. I began to doubt that even the best designed most useful reports would receive more than just a handful of skims.

But maybe I was expecting too much. Sometimes it only takes a few reads for a report to have an impact. Or maybe I was just working with the wrong clients. I just needed to work with the people who were open to change.

Either way, I can’t stop being an evaluator. I can’t stop questioning answers. Maybe what I say won’t be heard, but I have to try.

And from the feedback that I receive when I share my cartoons, my guess is that maybe you can relate.

Not everything that is faced can be changed. But nothing can be changed until it is faced.

James Baldwin from I Am Not Your Negro (currently streaming in the US on Amazon Prime).

Written by cplysy · Categorized: freshspectrum

Oct 07 2020

Ask Nicole: My Best & Worst Client Experiences

Have a question you’d like to be featured? Let me know. As we head closer to the end of 2020, I’m starting to think about where I want my business to go and who I want to be, have, and experience in 2021. Considering we’re still in the middle of a pandemic, it feels futile […]

The post Ask Nicole: My Best & Worst Client Experiences appeared first on Nicole Clark Consulting.

Written by cplysy · Categorized: nicoleclark

Oct 06 2020

Aprendizaje social: por observación

Fuente: https://valuexperience.com/los-beneficios-del-aprendizaje-social/

Dentro del Aprendizaje por observación, una de las teorías más influyentes del aprendizaje es la Teoría del Aprendizaje Social (TAS) formulada por Albert Bandura: La TAS se basa en que hay tipos de aprendizaje donde el refuerzo directo no es el principal mecanismo de enseñanza, sino que el elemento social puede dar lugar al desarrollo de un nuevo aprendizaje entre los individuos. La TAS es útil para explicar cómo las personas pueden aprender cosas nuevas y desarrollar nuevas conductas mediante la observación de otros individuos.

Así pues, esta teoría se ocupa del proceso de aprendizaje por observación entre las personas.

En la TAS de Bandura elaborada el año 1977 se basa en teorías del aprendizaje conductista sobre el condicionamiento clásico y el condicionamiento operante. Sin embargo, añade dos ideas importantes:

  1. Los procesos de mediación se producen entre estímulos y respuestas.
  2. Conducta es aprendida desde el medio ambiente a través del proceso de aprendizaje por observación.

De acuerdo con la TAS de Bandura, gran parte del aprendizaje humano es un aprendizaje que se realiza a través de la observación del comportamiento de otra persona que actúa como modelo. Por ello, es llamado aprendizaje observacional, aunque también recibe el nombre de aprendizaje social.


Aprendizaje social, aprendizaje por observación en los tiempos que corren: empezamos i qué idea i


Written by cplysy · Categorized: TripleAD

  • « Go to Previous Page
  • Go to page 1
  • Interim pages omitted …
  • Go to page 228
  • Go to page 229
  • Go to page 230
  • Go to page 231
  • Go to page 232
  • Interim pages omitted …
  • Go to page 304
  • Go to Next Page »

Footer

Follow our Work

The easiest way to stay connected to our work is to join our newsletter. You’ll get updates on projects, learn about new events, and hear stories from those evaluators whom the field continues to actively exclude and erase.

Get Updates

Want to take further action or join a pod? Click here to learn more.

Copyright © 2026 · The May 13 Group · Log in

en English
af Afrikaanssq Shqipam አማርኛar العربيةhy Հայերենaz Azərbaycan dilieu Euskarabe Беларуская моваbn বাংলাbs Bosanskibg Българскиca Catalàceb Cebuanony Chichewazh-CN 简体中文zh-TW 繁體中文co Corsuhr Hrvatskics Čeština‎da Dansknl Nederlandsen Englisheo Esperantoet Eestitl Filipinofi Suomifr Françaisfy Fryskgl Galegoka ქართულიde Deutschel Ελληνικάgu ગુજરાતીht Kreyol ayisyenha Harshen Hausahaw Ōlelo Hawaiʻiiw עִבְרִיתhi हिन्दीhmn Hmonghu Magyaris Íslenskaig Igboid Bahasa Indonesiaga Gaeilgeit Italianoja 日本語jw Basa Jawakn ಕನ್ನಡkk Қазақ тіліkm ភាសាខ្មែរko 한국어ku كوردی‎ky Кыргызчаlo ພາສາລາວla Latinlv Latviešu valodalt Lietuvių kalbalb Lëtzebuergeschmk Македонски јазикmg Malagasyms Bahasa Melayuml മലയാളംmt Maltesemi Te Reo Māorimr मराठीmn Монголmy ဗမာစာne नेपालीno Norsk bokmålps پښتوfa فارسیpl Polskipt Portuguêspa ਪੰਜਾਬੀro Românăru Русскийsm Samoangd Gàidhligsr Српски језикst Sesothosn Shonasd سنڌيsi සිංහලsk Slovenčinasl Slovenščinaso Afsoomaalies Españolsu Basa Sundasw Kiswahilisv Svenskatg Тоҷикӣta தமிழ்te తెలుగుth ไทยtr Türkçeuk Українськаur اردوuz O‘zbekchavi Tiếng Việtcy Cymraegxh isiXhosayi יידישyo Yorùbázu Zulu