• Skip to main content
  • Skip to footer
  • Home

The May 13 Group

the next day for evaluation

  • Get Involved
  • Our Work
  • About Us
You are here: Home / Archives for cplysy

cplysy

Aug 18 2020

How to Design Reports that Actually Inform Decisions

I used to write hundred-page reports… I was trained to write lengthy reports filled with statistical jargon. Important information sat around and gathered dust.

Now, I design reports that people actually want to read. Fewer paragraphs. More graphs. My audience can understand the information, so the data actually gets used.

Ann K. Emery will teach you how to write engaging reports.

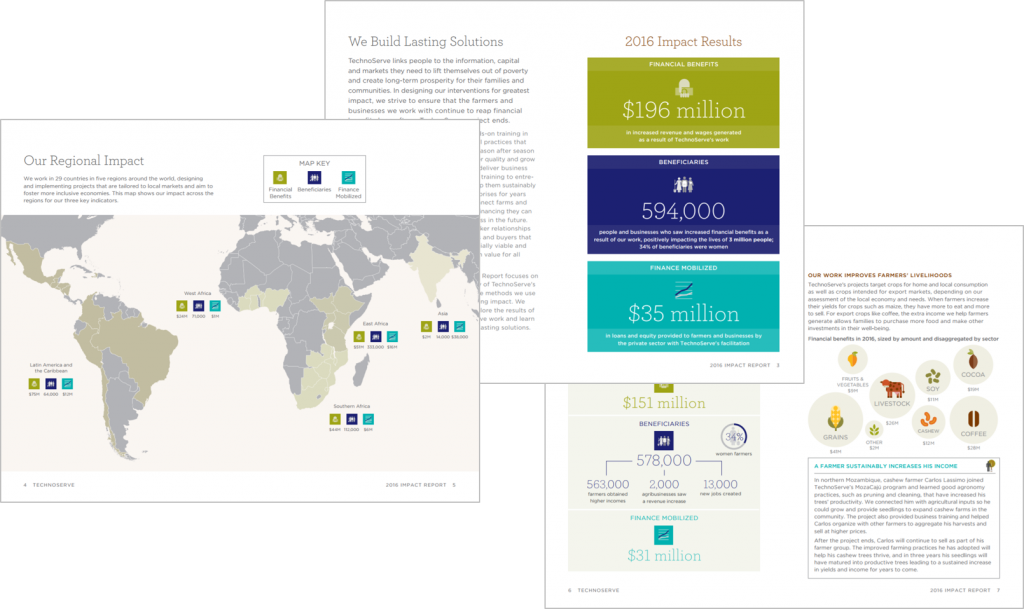
Reports aren’t supposed to feel daunting.

We’ll walk through my Report Redesign Pyramid, a step-by-step process that you can apply to your own projects.

You’ll learn how to:

  • match your dissemination format’s complexity to your audience;
  • follow the 30-3-1 approach;
  • design a one-pager with my seven ingredients;
  • set up your Theme Colors and Fonts inside Word;
  • use landscape for on-screen reading;
  • add a 20-minute cover;
  • visually chunk content with dividers;
  • apply a text hierarchy;
  • start with the “so what?;”
  • aim for 1+ visual per page;
  • add 15+ styles of visuals using my checklist;
  • go beyond the bar chart;
  • lower the reading grade level of your writing; and
  • tell a story through dark-light contrast and takeaway text.

What’s included in this training program?

I’m going to transform you into the report-redesigning hero that your organization needs. Here’s what’s included to make that happen.

  • 30+ video lessons that you can watch anytime (the equivalent of my two-day Report Redesign workshop)
  • Step-by-step process to transform Dusty Shelf Reports into reports that actually inform decisions
  • 2 Office Hours sessions every month to talk about your projects and hear from guest speakers
  • 6 additional Live Trainings just for participants in this program
  • 60-page Report Redesign ebook with our checklists and case studies
  • Discussion boards to ask questions and post your own work
  • Private Facebook community of fellow participants
  • Weekly emails to cheer you on
  • Lifetime access so you don’t feel rushed
  • Examples from a variety of industries (public health, juvenile justice, museums, and more)
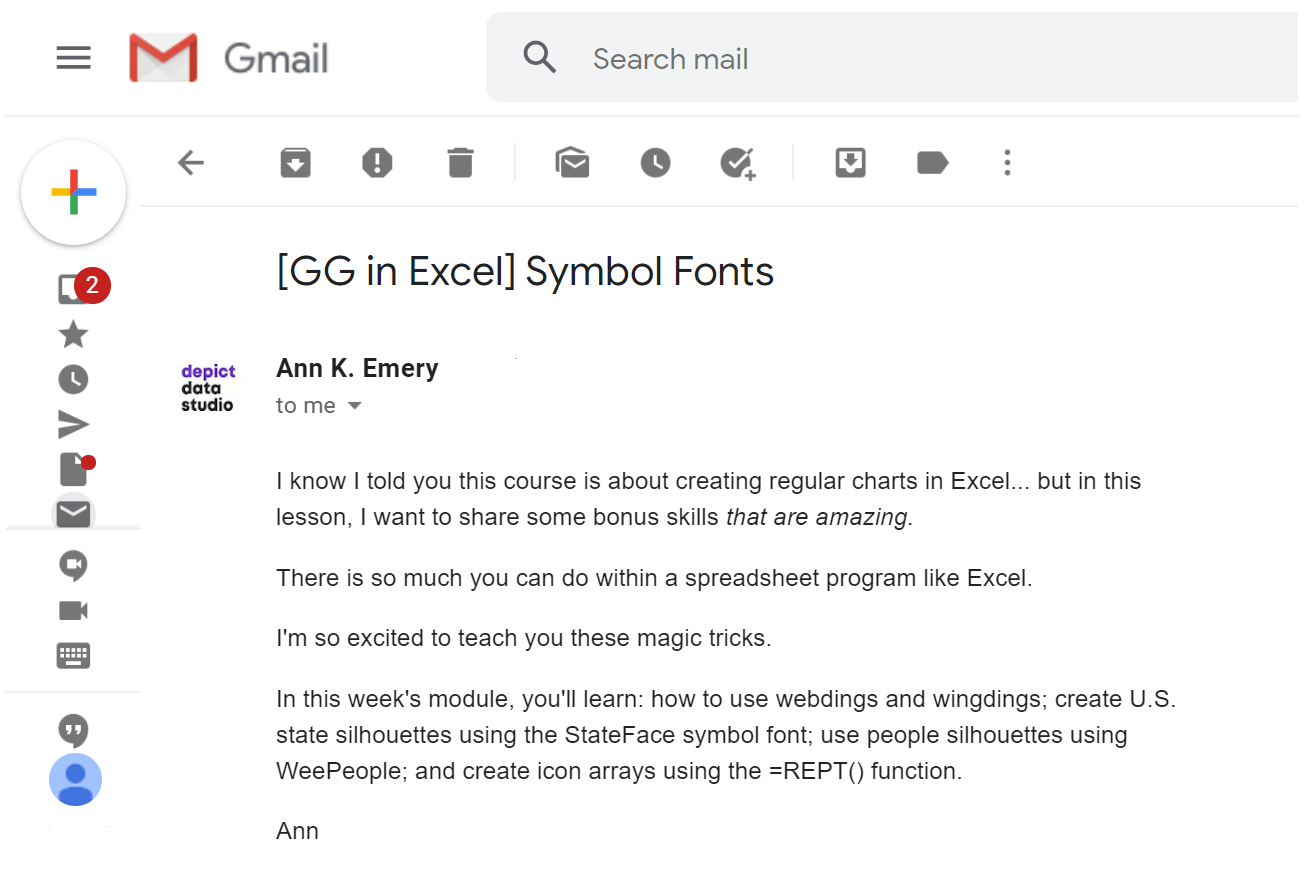
  • Behind-the-scenes Word and PowerPoint magic tricks guaranteed to make your jaw drop

Who This Training is For

This training IS for those of us who work on reports and one-pagers ourselves. This course is NOT for supervisors who delegate all their report production to someone else. (Supervisors, enroll your staff. Ask me about group rates.)

This training IS for people using everyday software like Excel, Word, and PowerPoint. This course is NOT for graphic designers who exclusively use Adobe Illustrator or Acrobat.

30+ Video Lessons

You’ll get instant access to 30+ lessons–the equivalent of a two-day training. You can watch these lessons anytime around your own schedule.

Office Hours Twice a Month

We’ll even provide feedback on your projects. You’ll get instant access to recorded lessons that you can watch anytime and two live Office Hours sessions every month to get targeted feedback on your reports.

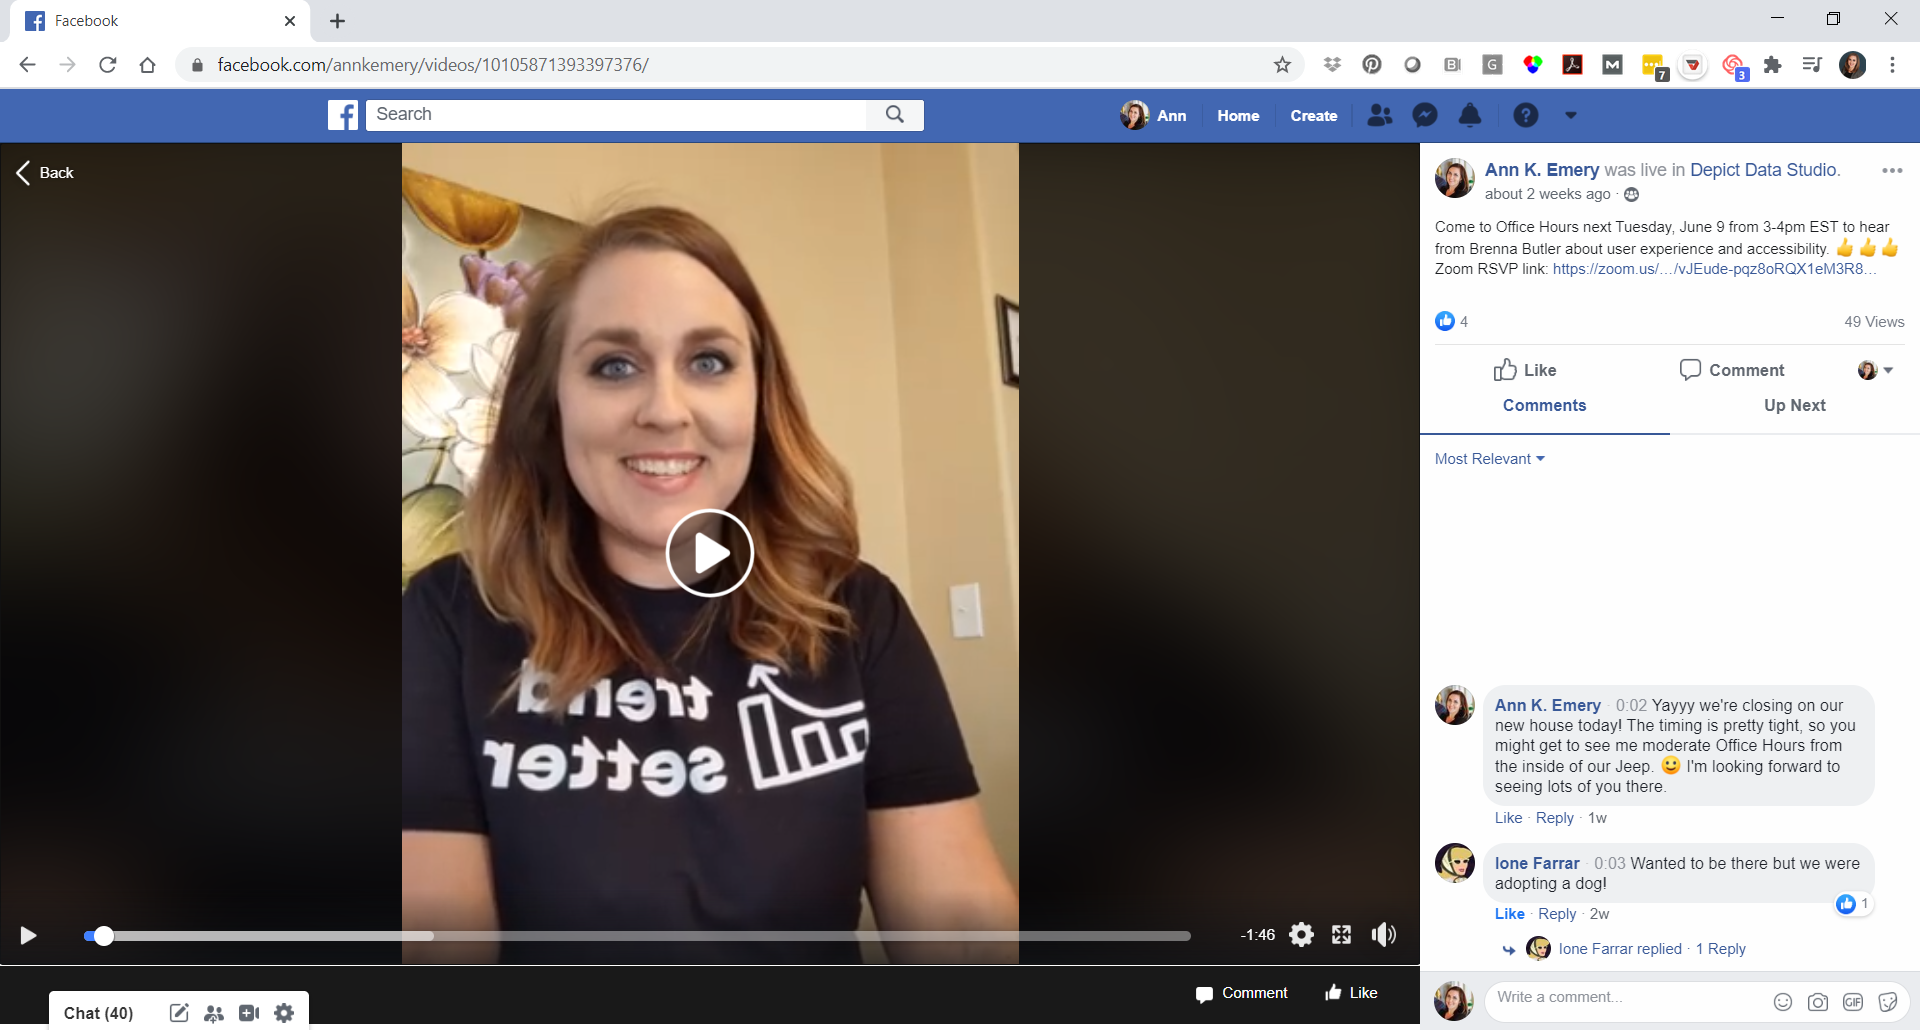
Guest Speakers in Office Hours

Sometimes we invite guest experts to speak with us during Office Hours. You’ll be able to access recordings from our sessions with Elizabeth Grim (about Connecticut’s COVID-19 response), Ione Farrar (about Tennessee’s COVID-19 response), Brenna Butler (about user experience), Chris Lysy (about using data for social action), and Sara Vaca (about visualization qualitative data).

By Popular Demand! 6 Live Sessions

Office Hours are open to everyone who’s taking online courses with me. By popular demand, we’ll also hold six additional Live Trainings just for the participants in this course.

  1. Tuesday, August 25, 2020 from 4 – 5 pm EST: Orientation Session & Self-Assessment
  2. Tuesday, September 29, 2020 from 4 – 5 pm EST: Emily Mills, author of The Art of Visual Notetaking
  3. Tuesday, October 27, 2020 from 4 – 5 pm EST: Kathleen Oh, breathwork session
  4. Tuesday, November 24, 2020 from 4 – 5 pm EST: Redesigning your reports together (first 5 participants to register will be eligible to have their reports used as case studies)
  5. Tuesday, December 29, 2020 from 4 – 5 pm EST: Redesigning your reports together (first 5 participants to register will be eligible to have their reports used as case studies)
  6. Tuesday, January 26, 2020 from 4 – 5 pm EST: Graduation Party

The sessions will be recorded in case you can’t make it live.

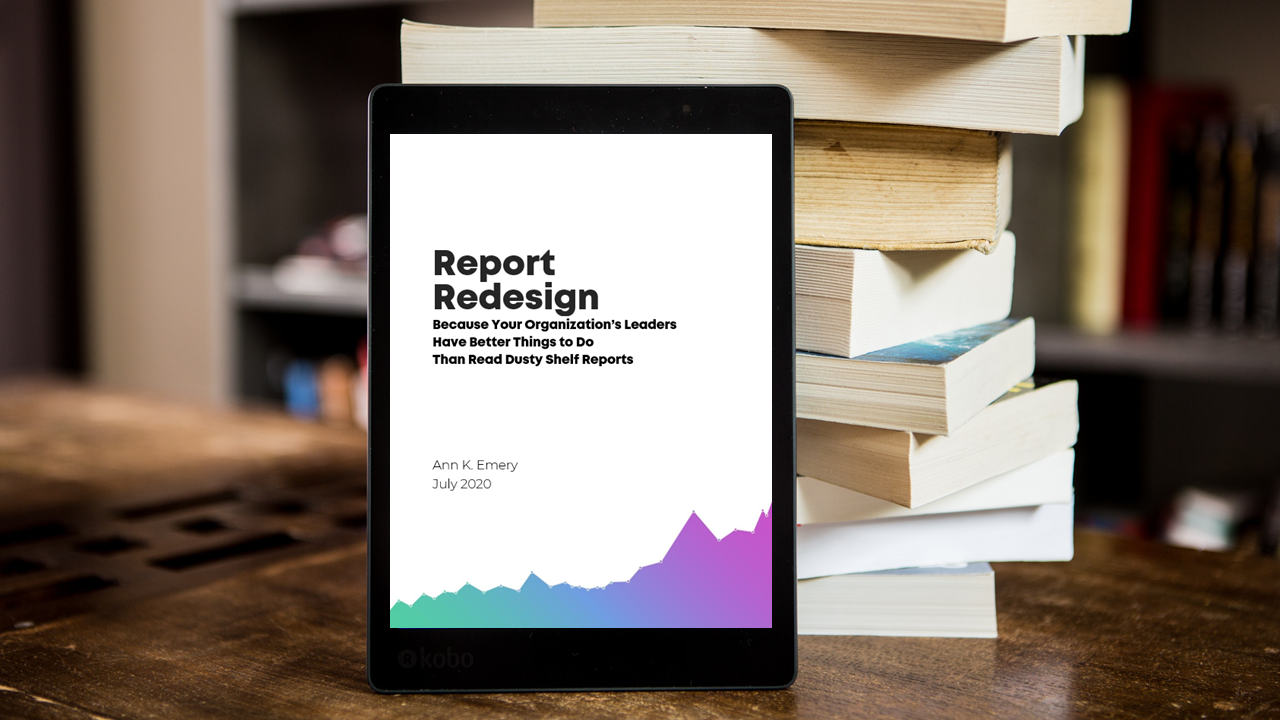
60-Page Report Redesign Ebook

You’ll get a license to download our 60-page ebook, which contains our 7 Ingredients for Designing One-Pagers, Checklist of 15+ Ideas for Visuals, and additional reporting case studies. This ebook is only available for participants in the Report Redesign full course and is not available anywhere else.

Discussion Boards to Ask Questions

Every module includes discussion boards where you can ask questions, comment on the lessons, and share your own tips with the community.

Private Facebook Community of Fellow Participants

You’ll be invited to join our private Facebook community, where I offer additional Facebook Lives. You can also post your own questions and get feedback from me and from your colleagues.

Weekly Emails to Cheer You On

I know you’re going to skip straight to the juicy reporting magic tricks, but I’m going to email you on Mondays around 11 am EST and pretend like we’re working through the course one module at a time.

Once-a-Year Registration

Mark your calendars! This course only opens once a year for registration. The 2020 enrollment window is Monday, August 17th through Friday, August 21st. When it’s open, it’s open. When it’s closed, it’s closed.

We’ve also got special Early Bird Bonuses for the earliest registrants.
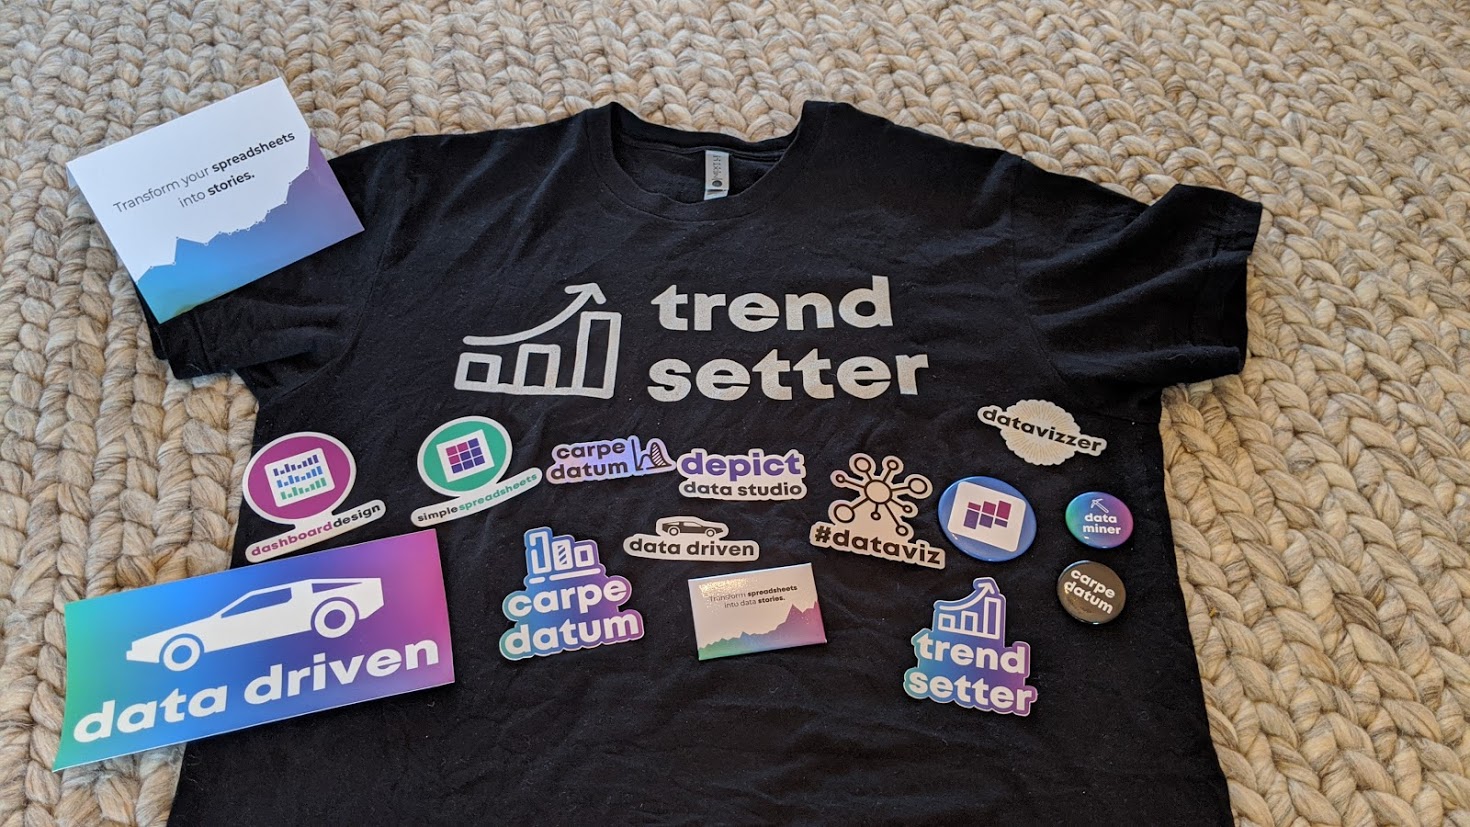
First 25 People

The first 25 people to register will receive a Swag Bag with a dataviz shirt, stickers, buttons, and magnets.

First 10 People

The first 10 people to register will ALSO receive verbal feedback on their graph, report, dashboard, or infographic. I’ll spend 15-20 minutes talking through everything you’re already doing well, and then give you a couple priority areas to focus on the next time you design a report like this. The feedback will be recorded and posted as a case study inside the course.

First 5 People

The first 5 people to register will ALSO receive a report makeover. You’ll send me your report. Then, I’ll work on it directly for ~30 minutes during one of the Live Trainings with the 2020 cohort. This is a great opportunity to have me consult on your project.

3,620+ participants from around the globe

have already taken the leap into better reports, slideshows, dashboards, and infographics by participating in our online courses.

Your Instructor

Ann K. EmeryAnn K. Emery

Each year, I lead dozens of in-person workshops for thousands of people. My online courses bring those skills to you, too.

Depict Data Studio also consults to the United Nations, State Department, and Centers for Disease Control, plus dozens more foundations, nonprofits, film companies, banks, hospitals, and universities worldwide.

Your data deserves to be out in the world–actionable, talked about, used–not gathering dust in spreadsheets.

What does an online course look like inside?

I talk with you like a real person, not a monotone robot reading off a boring script.

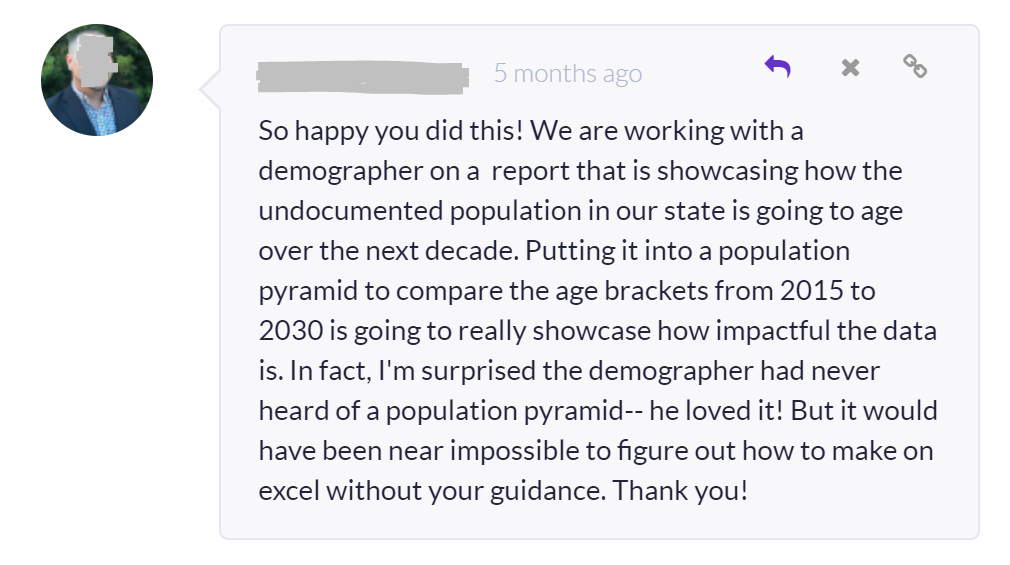
What Participants Are Saying

“Before this course, I was visualizing data in all the wrong ways. We had such compelling data, but it wasn’t telling a story– it wasn’t coming alive. Ann’s course really helped me transform my data and reports. I utilize the skills from this course every day— when developing reports and papers, doing dashboards for my team, and presentations. I have begun to develop a reputation within my department, as well as from other departments, for making compelling reports and having a knack for data visualization. In turn, I always recommend this course. This course has even helped me become better at data analytics and even data collection and survey writing, because you can better visualize the data that you want to see. The course has been an amazing resource, and the fact that you have access to it indefinitely is astounding. If you’re on the fence, take the leap! It’s worth it!”

– Padraic Stanley, Program Coordinator, Rush University Medical Center

Frequently Asked Questions

How long do I have access to the course?

Indefinitely. I used to limit access to just 12 months. I wanted to encourage you to get in here and learn with me, but instead it just stressed you out, so I’m not cutting off your access anymore.

Can’t I just find this information on the internet or in books?!

No. I’ve given workshops and webinars on Report Redesign, but you won’t find these techniques in books, blogs, or on YouTube anywhere.

I know you’re a perfectionist and always update your courses.

Yes, and you’ll receive all future updates to this course.

What if I am unhappy with the course?

Contact us in the first 30 days and we will give you a no-questions-asked full refund.

Register by Friday, August 21, 2020

  • $747 USD one-time purchase
  • 3 payments of $249
  • 6 payments of $125

See you in the course!

— Ann K. Emery

Written by cplysy · Categorized: depictdatastudio

Aug 18 2020

Dive In Process

Much attention is paid to tools, methods, models, and other artifacts as a means to support learning and innovation while much of what makes real change happen is actually a process. It is doing, not thinking. It’s diving in to the pool rather than focusing on the fences around it.

Today we look at one of the most simple, powerful means for creating change in complex systems: the diving-in process.

From Confusion to Coherence

Uncertainty is troublesome and often prompts a pause. When the situation is murky and situation complex, the strategy forward is to generate coherence where there isn’t any. That comes from taking action with a commitment to evaluation and learning.

By taking action we start to affect the situation around us creating a pathway forward. By paying attention and learning as we go ahead we can quickly determine whether the coherence we create is beneficial or not and start adjusting as we go until we are able to generate a stable situation where the path forward is clearer.

Diving in to a situation is not being reckless when accompanied by strategic learning through evaluation. Capturing data on what happens (e.g., observations, quantitative, etc..) will provide you with something to focus on amid the confusion and that will lead to seeing patterns, which is where coherence emerges.

Application

Diving in is as it sounds: take a leap of hope. First, make a conscious, deliberative strategic decision to pursue a path of action without expectation for an outcome, only for learning.

Build a set of metrics that are simple, have low ambiguity, and can be applied readily to capture feedback from your actions. These might be sales numbers, website traffic, number of clients or patients seen, occurrence figures — anything that is tied directly to your actions. It’s about creating that smallest visible system. These can be observational, numerical, or something else.

Next, commit to attentive, reflective sensemaking. This means capturing and examining your data regularly and often to look for patterns. Where you see patterns — and preferably, where your team sees them (this is best done as a group) — start reflecting on what it might mean. Is it positive? Negative? Too soon to tell? As patterns emerge, you follow them and document what actions you take in response to those patterns.

The last step is to adjust your strategy as necessary and repeat until you’re moving into a place of greater certainty and clarity about what to do.

This will generate coherence and enable you to take a wise action next.

It doesn’t eliminate uncertainty altogether, rather this approach allows you to avoid being paralyzed by it and potentially create positive benefits in the process of reducing it.

If you want help with finding pathways forward through uncertainty reach out and contact us. We can help you see opportunities and design strategies to take you away from confusion to coherence, safely.

Written by cplysy · Categorized: cameronnorman

Aug 17 2020

El aprendizaje como fuerza transformadora que puede romper los silos

Acaba de publicarse el nforme de la “Joint Inspection Unit” de Naciones Unidas: “Políticas y plataformas de apoyo al aprendizaje: hacia una mayor coherencia, coordinación y convergencia“, coordinador por Petru Dumitriu:

Dado que el principal activo del sistema de las Naciones Unidas es su personal, el aprendizaje es una herramienta esencial para mejorar la calidad y la eficiencia. Mediante el aprendizaje, el personal puede desarrollar nuevos conocimientos y habilidades, adquirir nuevas competencias y mejorar comportamientos y actitudes. El aprendizaje no es opcional; es condición sine qua non para que las organizaciones y su personal se adapten a un entorno altamente competitivo y dinámico.
Además, el sistema de Naciones Unidas no puede escapar a la transición hacia el futuro del trabajo, lo que implica agilidad para las organizaciones y aprendizaje continuo para las personas. Según estudios recientes, más de la mitad de todos los empleados en el mundo requerirán un desarrollo de capacidades significativo y una mejora de sus habilidades en solo los próximos tres años. Tal transformación solo se puede lograr mediante un mayor aprendizaje.
Para el sistema de las Naciones Unidas, el aprendizaje también puede ser una fuerza transformadora que puede (1) romper los silos, (2) estimular la cooperación entre organismos, (3) crear sinergias y (4) aumentar la eficiencia en el uso de los recursos, ya sea de los presupuestos ordinarios o de las contribuciones voluntarias. Más allá de la diversidad de mandatos y arreglos de gobernanza, las organizaciones de las Naciones Unidas son, después de todo, entidades intergubernamentales creadas y apoyadas por los mismos Estados Miembros.
El objetivo principal de esta revisión fue identificar y recomendar formas de optimizar el capital intelectual que representa el personal de las Naciones Unidas, a través del aprendizaje.

Written by cplysy · Categorized: TripleAD

Aug 17 2020

Comment on If we cannot define “museums,” how do museums survive? by Lyndall Linaker

I agree with much that you are saying throughout the article. As a museum professional I found the second definition unattractive – I get the sentiment but there are too many words. There are times when the bigger museums forget about staying relevant and the fact that they are “for the people” but the smaller volunteer museums can over step the mark and do the same, repelling visitors by only accepting visitors who are like them. I wrote a blog post a few years ago about Museums in the 21st Century on Museum Whisperings and my view is still the same, that museums are about being “connected” – museums to their own collections and museums to their audiences. Nothing is static. Collections must be researched and reinterpreted and audiences need to be studied and nurtured so that they keep coming back. Museums are about connecting their visions and collections (or exhibitions if there is no collection) with the public to share knowledge and shape/reflect community values or discuss issues which may add value in a place that is safe for all.

Written by cplysy · Categorized: rka

Aug 14 2020

Don’t Be Like Myers-Briggs: Measure Your Impact

When I started my doctoral program at Vanderbilt, I certainly didn’t expect to get into a … heated discussion, shall we say? … with the professor of my first course. 

We were discussing characteristics of effective leaders, and our professor mentioned that the Myers-Briggs Type Indicator, one of the most well-known personality tests, was essentially worthless.

You see, despite its incredible popularity, there is actually no data to show that Myers-Briggs is a valid and reliable assessment — that it measures what it intends to, and that you’d consistently get the same outcomes if you took it again and again. 

Now, I’ve always been a pretty introspective person, and I (still) love personality tests as a fun way to reflect on how I think, feel, and interact with others. I’d never taken them as a scientific assessment of my psyche, but Myers-Briggs especially had stood out to me as a somewhat revelatory framework for why people interact and act the way they do.

I had always gotten the exact same result when I’d taken the Myers-Briggs (ENFJ, if you’re curious), so when my professor started talking about how most people get quite different results each time they take it, and that there was no research to support its utility, part of me was bummed, and part of me was fired up. 

I argued (civilly, of course) that I didn’t use it as a formal diagnostic tool, but instead as a helpful resource or an interesting way of looking at things. So why should it matter? (Newsflash: It does matter.)

For fun, I recently read The Personality Brokers: The Strange History of Myers-Briggs and the Birth of Personality Testing by Merve Emre. Of course, she confirmed what my professor had said many years ago. However, it reminded me of something I see often in education. 

People who are passionate about helping children and families often feel that they KNOW that what they’re doing is helping the communities they serve, even without any real data to back it up. 

We KNOW that our Family Science Night was a success because there were lots of families there, and everyone enjoyed themselves. We BELIEVE that a teacher is effective because the children love them. We FEEL the impact of an after-school program because, well, it’s been in the community forever. 

Unfortunately, we can’t rely on gut instincts, feelings, and beliefs alone to tell us if something is effective… just like I couldn’t make decisions based on only an affinity for Myers-Briggs. 

Let me be clear: education, and family engagement in particular, tends to get kind of fuzzy. While we can’t rely on intuition, it’s also true that we can’t rigorously test everything that happens in schools. We need to find a middle ground.

But this isn’t just my random interest in personality theory. 

When it comes to children and families, we need to make sure that what we’re doing to try to help them actually works. 

Luckily, it’s not that hard to get started. We can begin tracking data, analyzing trends, and ultimately, measuring our impact so that we know we aren’t just THINKING that we’re changing lives. We actually are. 

If you need help getting started with building your evidence base, the Evidence for Engagement email series is back! Learn more and sign up so you can begin your evidence journey. 

Written by cplysy · Categorized: engagewithdata

  • « Go to Previous Page
  • Go to page 1
  • Interim pages omitted …
  • Go to page 241
  • Go to page 242
  • Go to page 243
  • Go to page 244
  • Go to page 245
  • Interim pages omitted …
  • Go to page 304
  • Go to Next Page »

Footer

Follow our Work

The easiest way to stay connected to our work is to join our newsletter. You’ll get updates on projects, learn about new events, and hear stories from those evaluators whom the field continues to actively exclude and erase.

Get Updates

Want to take further action or join a pod? Click here to learn more.

Copyright © 2026 · The May 13 Group · Log in

en English
af Afrikaanssq Shqipam አማርኛar العربيةhy Հայերենaz Azərbaycan dilieu Euskarabe Беларуская моваbn বাংলাbs Bosanskibg Българскиca Catalàceb Cebuanony Chichewazh-CN 简体中文zh-TW 繁體中文co Corsuhr Hrvatskics Čeština‎da Dansknl Nederlandsen Englisheo Esperantoet Eestitl Filipinofi Suomifr Françaisfy Fryskgl Galegoka ქართულიde Deutschel Ελληνικάgu ગુજરાતીht Kreyol ayisyenha Harshen Hausahaw Ōlelo Hawaiʻiiw עִבְרִיתhi हिन्दीhmn Hmonghu Magyaris Íslenskaig Igboid Bahasa Indonesiaga Gaeilgeit Italianoja 日本語jw Basa Jawakn ಕನ್ನಡkk Қазақ тіліkm ភាសាខ្មែរko 한국어ku كوردی‎ky Кыргызчаlo ພາສາລາວla Latinlv Latviešu valodalt Lietuvių kalbalb Lëtzebuergeschmk Македонски јазикmg Malagasyms Bahasa Melayuml മലയാളംmt Maltesemi Te Reo Māorimr मराठीmn Монголmy ဗမာစာne नेपालीno Norsk bokmålps پښتوfa فارسیpl Polskipt Portuguêspa ਪੰਜਾਬੀro Românăru Русскийsm Samoangd Gàidhligsr Српски језикst Sesothosn Shonasd سنڌيsi සිංහලsk Slovenčinasl Slovenščinaso Afsoomaalies Españolsu Basa Sundasw Kiswahilisv Svenskatg Тоҷикӣta தமிழ்te తెలుగుth ไทยtr Türkçeuk Українськаur اردوuz O‘zbekchavi Tiếng Việtcy Cymraegxh isiXhosayi יידישyo Yorùbázu Zulu