The post Toss the Confetti: Celebrating 3 Years in Business appeared first on Elizabeth Grim Consulting, LLC.
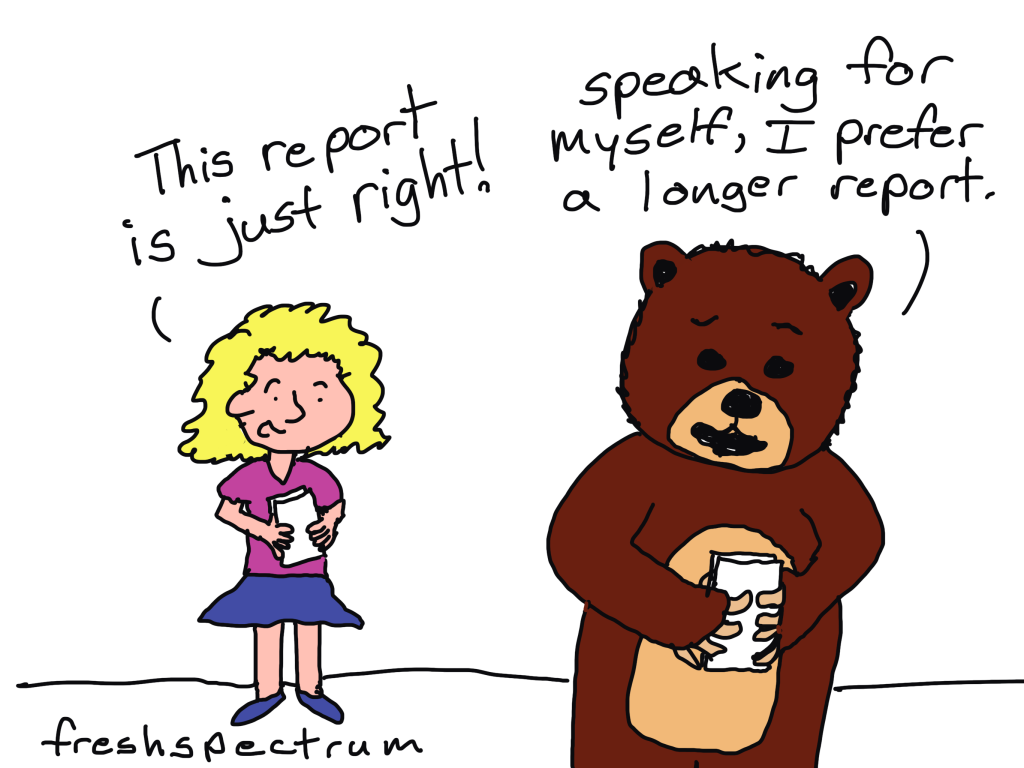
El Zoo de los Indicadores
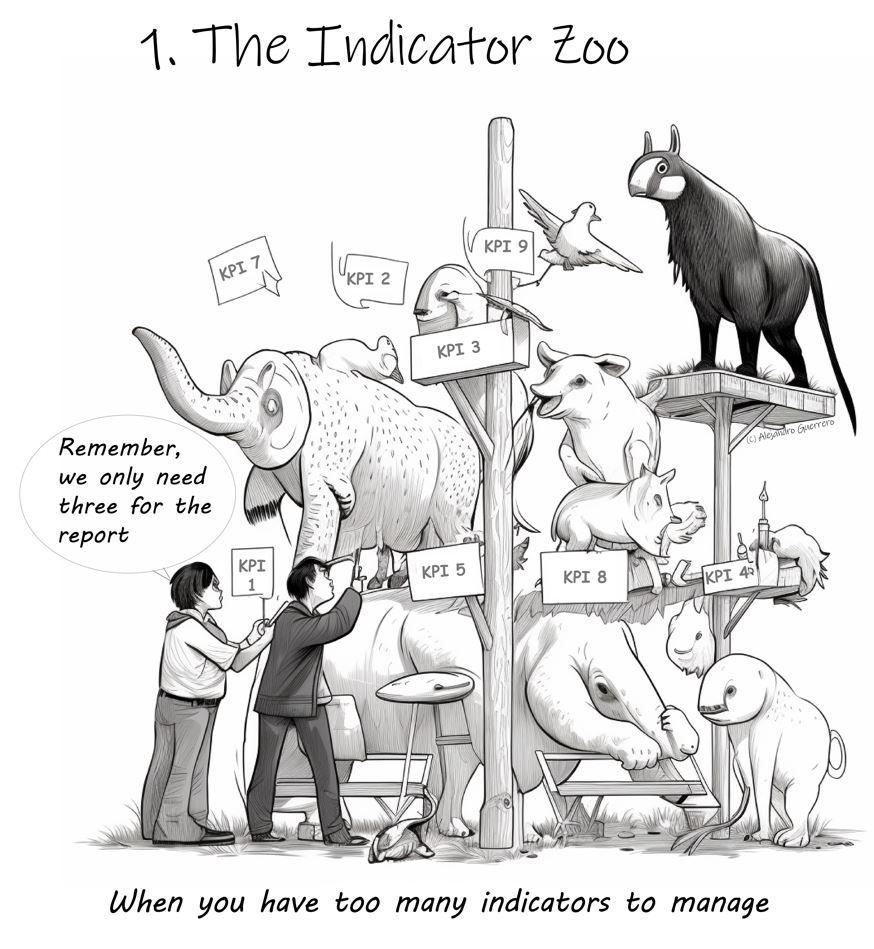
Alejandro Guerero, experto de OCDE en evaluación, nos contaba sobre » el Zoo de Indicadores«, donde las métricas se vuelven locas y sólo los más aptos sobreviven. Algunas razones por qué pasa esto:
1. «Miedo a perderse algo». El temor a que falten áreas clave de desempeño conduce a una sobreabundancia de indicadores.
2. La idea errónea de que un mayor número de métricas garantizará la seguridad (¡visibilidad = presupuesto!).
3. El carácter inherente complejo de los proyectos de desarrollo se refleja a menudo en una excesiva variedad de indicadores. Pero eso muchas veces falla.
4. La proliferación y fragmentación de los actores y esfuerzos de la cooperación para el desarrollo (en lugar de unir fuerzas para lograr los mismos resultados) contribuye a la expansión de métricas redundantes.
A ello sumaba Ian C. Davies, evaluador: El Zoo de indicadores es una comorbilidad de la locura basada en resultados que es una consecuencia del virus político neoliberal/conservador de los años ochenta que se ha convertido en una pandemia global. Entre los síntomas se encuentran:
(1) la ausencia de pensamiento reflexivo y crítico, la falta de rigor intelectual,
(2) la ignorancia de los fundamentos de la investigación y la evaluación,
(3) el uso mecanicista de los términos,
(4) las injusticias epistémicas rutinarias y la tendencia delirante a pensarse a sí mismo como un experto y, en casos extremos, a intentar que otros también lo crean.
How to become a data designer.
Ever wonder why some data teams deliver really nice looking reports while others seem like they’re stuck in the late 90s?
The more I work with different research and evaluation teams, the more I find that reporting quality usually comes down to the skills of just a few people.
First, you need a manager who is willing to allow their team to try new things and occasionally break from the status quo. They don’t have to be creative themselves, or even have a good eye for design, but they have to trust the people on their team and give them the time and flexibility required to grow.
Second, you need at least one member of your data team with the interest, and the skills, required to do the hard creative work. Most research and evaluation teams are small, even teams that work in larger organizations. And one member with the right creative skills can make a big difference in how effectively data is shared internally and externally.
The much needed role on every evaluation, research, and data team.
At least at this point in time, you are rarely going to find someone on a data team with the title of data designer. But while the position doesn’t often exist, the role usually does.
The data designer on your team is the one everyone goes to when there is some kind of creative project. Need an infographic created, that’s a job for (insert person’s name here). Need someone to run a social media account, call (insert person’s name here). Is someone asking you to turn your long pdf into a shorter visual report, time to email (insert person’s name here). Want some really nice looking charts, reach out to (insert person’s name here).
If you have a good data designer on your team, that person usually becomes a linchpin. And if you don’t have a good data designer on your team, you will likely struggle with creative requests.
What is data design?
Data design is a blend of two very different skillsets. It requires a mix of skills in research methods, data analysis, graphic design, communications strategy, UX design, and data visualization.
That skill mix allows an individual to create useful data products, find and tell good data stories, uncomplicate complex information, connect with audiences across multiple platforms, increase reporting effectiveness (a.k.a. create better reports), and increase reporting efficiency (a.k.a. implement a faster design process).
These skills are usually not taught together in graduate school. Most data analysts, researchers, and program evaluators leave university without taking a single course on graphic design, communications strategy, or UX design. So the people who take on the data design role are usually university instructed data people who also happen to be self-taught creatives.

First, how NOT to become a data designer.
There is not just one way to develop your creative side. But try not to do what I did and attempt to learn EVERYTHING.
I spent over a decade teaching myself web design, dataviz, coding, BI tools, professional graphic design tools, UX design, UI design tools, communications strategy, and more. I would go from one rabbit hole to another. Trying to learn a bit of everything can be fun if you love learning, and it does make you really well-rounded, but it’s not very practical.
I also don’t suggest focusing on learning a specific software product. Most design challenges faced by data teams can be met using simple tools, whether they are freemium web software products or just the basic software you already have installed on your computer.
Instead, here are some things I suggest you do learn.
Learn some graphic design.
The modern digital world is a visual place. Graphic design is critical to your ability to uncomplicate complex information, which is super important for data products. Whether you are formatting reports, designing graphs, creating social media content, or building web pages, a solid grasp of graphic design fundamentals will serve you well.
Learn some user experience design.
You need a design process that can get you from nothing to something useful. And that’s what UX design can do for you. UX design is not interface design, instead it is a design process where you let the needs/desires of the end user guide your process. I have found consistently that a good UX design process results in better data products.
Learn some modern communications strategy.
“If you build it, they will come,” is bad advice in our modern digital world. The web has fundamentally changed how people send and receive information. Knowing a bit about communications strategy can help you to increase the likelihood that your audience will actually experience your work.
Learn how to create basic graphs and maps.
Most of the time, you can get by with really basic charts, graphs, and maps. And often, the simpler the better. Knowing a bit of data visualization best practices is helpful for any researcher or evaluator as charts, graphs, and maps are some of those most common and impactful illustration tools we have in our creative toolkit.
But just keep in mind, that data design is so much more than just data visualization. Knowing how to create a good graph will only get you so far.
Learn a basic set of software tools.
In the field of web development there is this concept of a software stack. Basically it’s a set of software tools that allow you to do something (like a host a website). The stack itself is made up of individual pieces of software that can be somewhat interchangeable. I suggest building off the concept for your own work.
Here are some basic categories to consider.
- Writing Tools: Word, Google Docs
- Graphic Design Tools: PowerPoint, Canva, Adobe Illustrator/InDesign
- Data Visualization Tools: Excel, Flourish, DataWrapper, R, Tableau, PowerBI
- Web Design Tools: WordPress, Squarespace, Wix
Most data people start by writing in Word, designing in PowerPoint, and creating charts and graphs with Excel. This is the stack people know, and are sometimes forced into by their organization’s software policies. But as many have shown, you can still do impressive creative data design work even if you are stuck with MS Office.
My favorite stack right now is to write using Google Docs, design and illustrate using Canva, visualize data using Flourish, and design interactive web reports using WordPress. The tools are all user friendly, inexpensive, and help speed up the data design process.
There are certainly data designers that have built impressive portfolios using tools like Adobe Creative Cloud, Tableau, and R. These professional tools do provide benefits but also come with steep learning curves and sometimes high subscription costs (R excluded).
Continue building your creative skills through practice.
After you have a firm grasp of the fundamentals, you continue building your skillset through practice. Seek out inspiration from people and organizations you admire, then try to replicate those products using the tools you know. Give yourself specific creative challenges and work through the design process.
Want a guide to help you learn? I can be that guide.
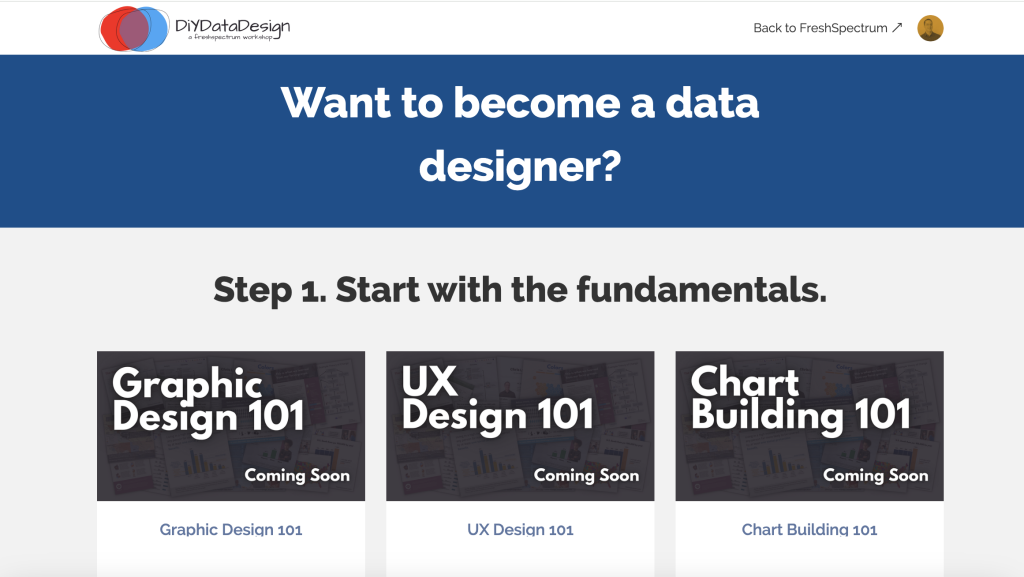
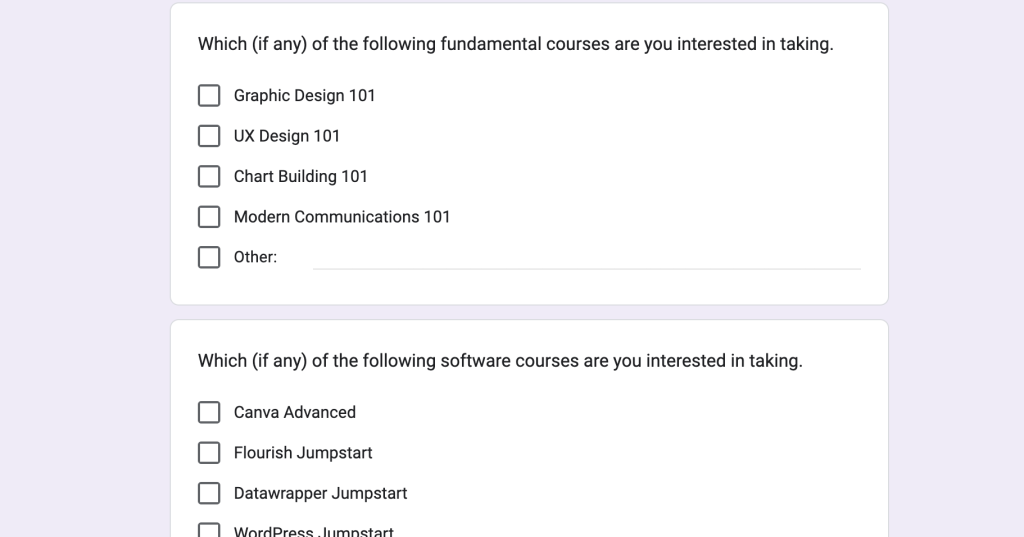
I’m currently in the process of updating my online workshop, DiY Data Design. The goal of the workshop is to train, mentor, and support data designers by teaching researchers and evaluators the creative skills they did not learn in graduate school.
The new updates are intended to create a program that will ultimately give you the experience you need to take on the data design role for your team. Many of the courses are currently in the development phase, but if you want to join the waitlist for a specific course, you can do so by following this link and filling out the Google form.
Evaluation Sustainability Plans: Why you need one for your next evaluation project.

Evaluations are important tools for assessing the effectiveness, efficiency, and impact of programs and initiatives. They provide valuable insights that inform decision-making, resource allocation, and strategic planning. You can discover more reasons why you should evaluate by exploring our infographic here.
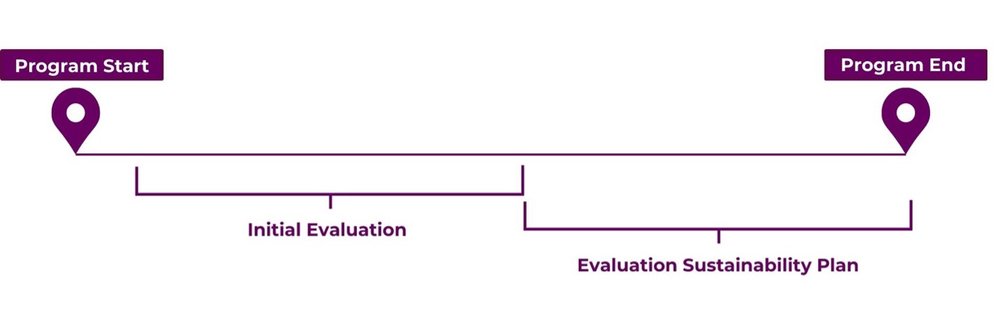
However, as organizations increasingly recognize the value of evaluations, ensuring the sustainability of these efforts becomes front of mind to maintain long-term impact and continuous improvement. Sustainability is important for evaluations led by both internal and external evaluators because it ensures that the knowledge gained, and the processes developed can be integrated into the organization’s culture and operations. An Evaluation Sustainability Plan is particularly important for projects that involve long-term initiatives to ensure that outcomes, and measurement of those outcomes, persist beyond the initial evaluation. This is where an Evaluation Sustainability Plan steps in.
What is an Evaluation Sustainability Plan?
An Evaluation Sustainability Plan is a framework created by evaluators to maintain the effectiveness and relevance of evaluation efforts beyond evaluation project completion. It consists of strategies and processes to preserve the evaluation over time, acting as a roadmap for organizations to sustain and benefit from the evaluation for ongoing learning, improvement, and accountability. It aligns continued evaluation efforts with organizational goals, fostering a culture of learning and adaptation. An Evaluation Sustainability Plan enables organizations to integrate evaluation insights into their operations, facilitating continuous growth.
Why Should You Have an Evaluation Sustainability Plan?
1. It Can Support Continuous Improvement
By facilitating ongoing assessment and refinement of programs and initiatives, an Evaluation Sustainability Plan can support organizations to adapt to changing needs, optimize program delivery, and achieve better outcomes over time.
-
A key component of continuous improvement outlined in an Evaluation Sustainability Plan is the commitment to ongoing evaluation activities. By continuing to conduct evaluations at regular intervals, organizations can systematically assess the effectiveness and impact of their programs and initiatives.
-
By outlining post-evaluation activities and metrics for success in an Evaluation Sustainability Plan, organizations can track progress over time and assess the sustainability of outcomes.
-
An Evaluation Sustainability Plan emphasizes the importance of using evidence to guide organizational strategy, program planning, and resource allocation. By synthesizing evaluation findings into actionable recommendations, organizations can make informed decisions.
2. It Highlights Strategies for Internal Capacity Building
An Evaluation Sustainability Plan highlights the importance of building internal evaluation capacity within organizations to ensure the ongoing effectiveness and sustainability of evaluation efforts. To enhance internal evaluation capacity, an Evaluation Sustainability Plan highlights ways to integrate evaluation practices into organizational processes and decision-making frameworks.
-
An Evaluation Sustainability Plan presents a unique opportunity for organizations to leverage the expertise of the evaluator. Evaluators bring a wealth of knowledge, experience, and best practices to the table, gained from working on various evaluation projects across different contexts. Through collaboration and knowledge sharing, organizations can tap into this expertise to enhance their own evaluation capacity. Additionally, evaluators may develop customized tools and processes during the evaluation that can be valuable assets for the organization moving forward. By incorporating these tools into their own evaluation practices, organizations can streamline their evaluation processes and ensure consistency and rigour in their approach.
-
An Evaluation Sustainability Plan advocates for allocating staff time and resources to prioritize evaluation tasks. By designating individuals or teams responsible for leading and coordinating evaluation efforts, organizations can ensure that evaluation activities receive the support needed to be conducted effectively.
-
An Evaluation Sustainability Plan emphasizes the importance of providing training and skill development to staff involved in evaluation activities. By offering ongoing training and skill development opportunities on topics such as evaluation planning, methods, ethics, data collection and analysis, and reporting and utilization of evaluation findings, organizations can support the competencies and confidence of staff conducting evaluations internally. Take a look at our latest article on 12 Training Ideas Beyond Conventional Evaluation.
3. It Can Support Transparent Communication and Accountability
In any evaluation, transparent communication and accountability are key elements that drive trust, facilitate learning, and ensure the utilization of evaluation findings. An Evaluation Sustainability Plan underscores the importance of these principles to guide organizations in fostering a culture of transparency, accountability, and continuous learning.
-
An Evaluation Sustainability Plan highlights the necessity of sharing evaluation findings regularly with partners. Transparent communication of evaluation results ensures that partners and other relevant parties are kept informed of program progress, outcomes, and any emerging insights.
-
Engaging partners throughout the evaluation process is crucial for promoting buy-in, transparency, and accountability. An Evaluation Sustainability Plan outlines strategies for soliciting feedback, analyzing data, and incorporating lessons learned into program planning. This includes mechanisms such as establishing advisory committees and conducting partner consultations to gather diverse perspectives. By actively involving partners, organizations can demonstrate a commitment to responsiveness and ensure evaluation efforts remain relevant and credible.
-
An Evaluation Sustainability Plan guides communication and dissemination strategies to ensure that evaluation findings reach and resonate with intended audiences. By employing targeted and tailored communication strategies, organizations can maximize the impact and reach of evaluation findings, fostering a culture of transparency, accountability, and continuous learning.
4. It Presents a Plan for Adapting the Evaluation to Changing Contexts
In today’s rapidly evolving landscape, organizations must remain agile and responsive to shifting needs, priorities, and contextual factors. An Evaluation Sustainability Plan can serve as a strategic tool to equip organizations with the flexibility to adapt their evaluation approaches, methodologies, and indicators to effectively address emerging challenges and opportunities.
-
An Evaluation Sustainability Plan ensures that evaluation efforts remain aligned with organizational goals and priorities, even as contexts evolve. By encouraging updates to logic models, the evaluation purpose, scope, and questions, and refining data collection processes, an Evaluation Sustainability Plan can ensure that evaluation activities continue to generate actionable insights that contribute to achieving organizational objectives.
Key Components of an Evaluation Sustainability Plan:
An Evaluation Sustainability Plan should be tailored to each organization and program, meaning its components may vary depending on the specific evaluation it is designed to support. However, we have identified several key components that we have found useful below:
-
State Clear Objectives and Outcomes:
-
Define the purpose, scope, and intended outcomes of the sustainability plan, aligning them with the organization’s mission, goals, and priorities.
-
-
Include a Partner Engagement Strategy:
-
Identify key partners, their roles, and responsibilities in sustaining evaluation efforts.
-
Develop suggested strategies for ongoing engagement, communication, and collaboration throughout the evaluation lifecycle.
-
-
Suggest Capacity Building Initiatives:
-
Assess and address organizational capacity gaps related to evaluation planning, implementation, and utilization.
-
If possible, provide training, resources, and support to enhance staff skills and competencies in evaluation methodologies and techniques.
-
Suggest the allocation of dedicated staff time and resources for evaluation tasks.
-
-
Present a Knowledge Management Framework:
-
Establish suggested mechanisms for capturing, documenting, and disseminating evaluation findings, lessons learned, and best practices.
-
-
Establish Monitoring and Evaluation Standards:
-
Define indicators, benchmarks, and monitoring mechanisms to track the sustainability of outcomes over time.
-
Suggest periodic reviews and assessments of these measurements to ensure they remain aligned and adjust strategies as needed.
-
-
Consider Resource Allocation and Sustainability Financing:
-
Suggest the allocation of financial and staff resources to support evaluation activities, including investing in necessary tools, software, and professional development opportunities for staff involved in implementing the evaluation.
-
Key Considerations when Developing an Evaluation Sustainability Plan:
-
Bias:
-
Bias may arise if the individuals responsible for implementing the program are also involved in collecting, analyzing, or interpreting the evaluation data. This can skew the results and compromise the integrity of the evaluation. To minimize the likelihood of bias, programs can promote transparency throughout the evaluation process by clearly documenting roles and decision-making procedures, involve partners from diverse backgrounds and perspectives, and provide bias awareness training to evaluation team members.
-
-
Data Quality and Integrity:
-
Poor data quality, such as incomplete or inaccurate data, can undermine the credibility and reliability of evaluation findings. Ensuring all staff involved in evaluation processes are trained in the principles of data quality is important to maintain the integrity of the evaluation. Implementing quality assurance measures, such as regular data audits and validation checks to assess data accuracy, completeness, and consistency, can also help to identify and correct any errors or discrepancies in the data
-
I believe that, where possible, an Evaluation Sustainability Plan should be a critical component of any evaluation project, ensuring that the investments made in evaluations yield lasting benefits and impact. By strategically planning for sustainability from the outset, organizations can maximize the value of evaluations, enhance organizational learning, and drive continuous improvement.
Have you created an Evaluation Sustainability Plan before? Let us know the key components you’ve included in the comments below!
(Mostly Free) Resources for Learning How to Code Qualitative Data

What is coding for qualitative data?
If you’ve found your way to this article, you probably have an idea of what coding for qualitative data looks like. Hint: It doesn’t require knowing Python, C++ or any other programming language.
Qualitative coding is a systematic process of labelling and organizing qualitative data. It is a way to analyze non-numerical data like interview and focus group transcripts, photographs, and field notes.
In my current role as an evaluator, I usually use coding as a way to identify common and interesting themes from interviews I’ve conducted. These themes are then examined as a whole, to see what kind of narrative insights they can provide about the program that is being evaluated. If you want to know more about how to analyze qualitative data thematically, check out our Eval Academy article: Interpreting themes from qualitative data: thematic analysis.
How do you do it?
There are a lot of different ways to code qualitative data. In the past, I’ve used paper and a pen, sticky notes, MS Word, Excel, or a software program like Nvivo or Dedoose. I usually code my data thematically and inductively because it helps me to uncover unexpected insights. This is because inductive coding involves creating codes as you are going through the data. It forces me to keep an open mind about what the data could be saying – even if it differs from my preconceptions. I’ve also done deductive coding before, starting my coding with a set of agreed upon codes. I find that this method usually helps me to look for the answers to my evaluation questions more efficiently and can be useful when I don’t have a lot of time for analysis.
When I first started learning how to code qualitatively, it was a bit overwhelming because there are so many ways that you can do it. I really struggled to understand that there isn’t necessarily one “right way” of coding in evaluation. There are some general rules for rigour but beyond that, everyone seems to have their own preferred style. This approach slightly differs from academic institutions where you are often required to pick an established qualitative method with a specific underpinning theory, stick with it, and document your steps for review.
In my struggle to find answers about how to code qualitative data, I came across some resources that helped me learn a bit more about the theories behind qualitative coding and how others do it. These resources continue to help me to refine my coding processes. I hope you find them useful as well!
And if you still have questions after exploring my resource list, I recommend asking other evaluators and researchers about their methods or taking a course with a practical component.
You’re also welcome to leave a question or a comment on our Eval Academy LinkedIn!
(Mostly Free) Resources List for Learning Qualitative Coding
Most of these resources include some kind of step-by-step process for coding qualitative data. Some of them also include information on the different types of qualitative coding and when to use them.
Courses:
Delve’s Free Qualitative Data Analysis Course (mostly free)
Delve has created a free course on qualitative coding to promote their paid coding platform. This is a short, self-paced course suitable for beginners. I like that it guides you through coding for the first time with short, practical assignments. You don’t need to use their software to complete the course, but you can trial it for free if you want to use it for your learning.
Qualitative Research Methods: Data coding and Analysis (mostly free)
MITx online offers free access to this self-paced course which is a shortened version of a semester long version taught by Professor Susan Silbey of MIT. The paid version allows you to participate in the assignments and receive a certificate upon completion. The free version still allows you to access all the content, as long as you sign in with an MITx online account. I found this course to be a really good study of step-by-step qualitative coding within an academic setting. Professor Silbey does a great job of explaining and demonstrating things like how to do line-by-line coding, create a codebook, and refine your codes.
Videos:
Qualitative Data Analysis 101 Tutorial: 6 Analysis Methods + Examples (free)
This is a 25-minute informational video by Grad Coach on YouTube about the different types of qualitative analysis. This is NOT a step-by-step guide to coding, but it does explain 6 different types of qualitative methods and when to use them. This is a good video to watch to learn about what kinds of qualitative methods exist outside of the ever-popular thematic analysis.
Qualitative Coding Tutorial: How to Code Qualitative Data for Analysis (4 Steps + Examples) (free)
This 27-minute YouTube video by Grad Coach explains the minute details of how to code qualitatively. It goes over some steps for how to code, as well as discussing different methods that you can use at each stage of coding. It ends with some tips for how to code your data.
Qualitative data analysis – Coding Tutorial – Initial Codes | “From Codes to Themes” episode 1 (free)
This video is the first part of a YouTube series on how to code by Dr. Kriukow. He’s sort of a qualitative data analysis influencer – if that is a thing. In this 23-minute video, he explains his thought process while he demonstrates how to code a transcript. If you ever wanted to know how other people code, this one is a good demonstration to watch. If you like the way that he codes, I think he has a paid course on Udemy. I’ve never taken it before, so I didn’t include it in this list.
Qualitative coding and thematic analysis in Microsoft Word (free)
MS Word is probably one of the most accessible ways to code because it is an app that most people already have on their computers. Dr. Kriukow shows you how to use MS Word to code and thematically analyze your data in this 28-minute YouTube video.
Ten Top Tips in Qualitative Data Analysis for New Researchers – Jude Spiers (free)
The International Institute for Qualitative Methodology hosted a master class webinar series, and this 1-hour lecture was part of it. This video is less practical than the other resources listed here, but it does offer some useful tips and tricks for how to code qualitative data in an academic setting.
Articles:
Interpreting themes from qualitative data: thematic analysis (free)
This Eval Academy article is one of our most popular. It’s a thorough guide on how to do thematic analysis, including a useful illustration on interpreting themes. Most of the other resources in this list focus on coding, but this one focuses on what you do AFTER coding all your data.
Using thematic analysis in psychology (mostly free)
The authors of this academic article on thematic analysis are well-known researchers of qualitative data methods. If you’re looking for some peer-reviewed literature on how to conduct thematic analysis, you should definitely read this one. It includes step-by-step explanations on how to conduct thematic analysis. This article may be paywalled on some sites.
The Essential Guide to Coding Qualitative Data (free)
Alongside their free course, Delve also has a free guide to coding qualitative data. It discusses a range of useful topics such as how to transcribe interviews, tools for coding qualitative data, and a step-by-step process for coding.
Analyzing Qualitative Data (free)
Learning for Action wrote this step-by-step article with tips for how to analyze qualitative data. Their example uses Excel to code the qualitative data, so it is a useful guide for that specific type of coding method.