• Skip to main content
  • Skip to footer
  • Home

The May 13 Group

the next day for evaluation

  • Get Involved
  • Our Work
  • About Us
You are here: Home / Archives for allblogs / depictdatastudio

depictdatastudio

Jan 09 2023

Looking Ahead to 2023: What’s Coming to Depict Data Studio 

Wondering what I’ve got planned this year? 

Here’s what’s in store for 2023 related to: 

  • Online Courses, 
  • Private Training, 
  • Conference Keynotes,
  • Data Visualization Consulting, and 
  • My Personal and Professional Goals. 

Online Courses 

I have courses on 6 different topics.

Here’s the calendar:

  • Great Graphs in Excel, my Excel-specific dataviz course: Registration closes on Friday, March 3. The first live class is Tuesday, March 7.
  • Report Redesign, my deep dive on creating reports that people actually read: May 2023.
  • Dashboard Design, my deep dive on building static and interactive dashboards: September 2023.
  • Powerful Presentations, my public speaking and slide design course: ​ November 2023.
  • Simple Spreadsheets, my data analysis course: March 2024.
  • Great Graphs, my software-agnostic dataviz course: May 2024.

Tuition

Registration is $997/participant for 2023.

No price increases for the third year in a row.

We also have group rates available. 

Private Training 

Want to bring me in to speak to your team? 

Each year, I lead ~200 private sessions for foundations, nonprofits, universities, and government agencies who work on social good issues. 

Here’s more info about my workshops, which can be held virtually or in-person. 

Option 1: Private Training

What’s included:

  • 8 Hours of Live, Custom Training for up to 25 People. The most popular scheduling option is two half-day sessions (eg., 12 – 4 pm, two afternoons in a row).
  • Review of Sample Materials. I’ll review 5 of your sample materials ahead of time (participants’ reports, slideshows, dashboards, infographics, etc.).
  • Customized Agenda. After I review your sample materials, I’ll customize the agenda to fit your team’s current skill level. For example, we might skip over beginner-level topics and move right into advanced techniques. Or, we might focus on maps, qualitative data, or before-after graphs. I have 6 full-length classes that we can pull topics from.
  • Zoom Set-Up and Hosting. I’ll handle the behind-the-scenes Zoom setup. You’ll simply send your staff a link to RSVP for the sessions. I’ll also host the Zoom trainings so you don’t have to worry about it.
  • Recordings. I’ll post the recordings to a password-protected site. Each participant will receive a username and password for the site. I’ll keep this site up for an entire year.
  • Slides. Each participant will receive the PDF’d slides from the sessions.
  • Handouts. Each participant will receive a handout with checklists of key points.
  • Ebooks. Each participant will receive a license for our 250-page ebook with even more examples and tips.
  • Excel How-To’s. Our templates and step-by-step instructions for making 25 advanced graphs.
  • Recommended Resources. You’ll get a resource list with our favorite books, websites, and tutorials for learning more.
  • Certificates of Completion. After the training, each participant will receive a Certificate of Completion.
  • Satisfaction Surveys. I’ll administer a satisfaction survey and share the feedback to help with future planning.
  • Email Recaps. I’ll also send emails before and after the sessions to keep the conversations going.
  • Data Vizards Community. Everyone will be invited to our students-only LinkedIn group, where you can network, post drafts, and get feedback from others.

Option 2: Private Training + Longer-Term Support

New for 2023!

By popular request, I’m adding an option for longer-term support.

What’s included:

  • Everything from the Private Training package.
  • Course access. All 25 staff will get lifetime access to one of my online courses, which goes broader and deeper than our training together.
  • Makeovers. We’ll create 3 quick makeovers of your work. For example, we’ll transform your report’s cover, revamp a text-heavy slide, etc.
  • Accessibility Audit. We’ll meet for 60 minutes over Zoom and review one of your publications, slideshows, dashboards, etc. for both “Big A Accessibility” (508 Compliance) and “little a accessibility” (making sure it’s easy to understand).
  • Style Guide Consultation. We’ll meet for 90 minutes over Zoom and review your existing branding materials, like style guides, brand colors, brand fonts, photographs, and/or icons. Then, we’ll set up chart templates to make sure staff know exactly how to format their charts, tables, and diagrams to meet your branding standards. We’ll also go through my Dataviz Style Guide Checklist to get ideas for how you might improve branding resources in the future, whether you’re branding for the first time, re-branding entirely, or just making some minor tweaks.
  • Office Hours. All 25 staff will be invited to weekly 60-minute Q&A sessions for an entire year. These are group “consulting lite” sessions where I’ll review your draft dashboards, reports, and slides.

Want to learn more about private training? Book a call.

Conference Keynotes

I’m looking forward to providing keynote speeches, pre-conference workshops, and breakout sessions at a variety of in-person and virtual conferences this year.

Want to learn more about conference keynotes? Book a call.

Data Visualization Consulting 

Want me to create your report, slideshow, dashboard, or infographic? 

Get in touch!

Please note: Availability is very limited.

If I can’t personally work on your project, I’ll refer you to a trusted colleague.

Personal Goals 

I’m going to continue working the K12 school calendar. When my kids are home from school, the Depict Data Studio office is closed. (No courses or private trainings over spring break, summer break, Thanksgiving, winter holidays, etc.)

Last year, I got really into edible gardening. I planted papayas, oranges, avocados, mangos, blueberries, raspberries, blackberries, sour sops, guavas, pineapples, and an assortment of veggies. As an absolute beginner, I ran into a massive learning curve. I had tons of luck with fruit trees and berry bushes, but the veggies were tougher. (Super hot in Florida, so much rain, etc.) Hopefully I’ll get more veggies growing this year!

Professional Goals

I’m going to focus on blogging this year. Little to no YouTubing, podcasting, guest lectures in universities, free talks, etc. My time’s limited, and blogging is the most efficient one to many structure.

In past years, my goal was 24 blog posts (about 2 per month). I was also producing new videos, podcasts, etc. This year, I’ll try to publish 36 blog posts (about 3 per month). Since I’m taking off the entire summer again, this means I’ll need to blog every week during the work year to make up for zero blog posts over the summer. Whew! Can I do it??? TBD.

(I’ve posted some amazing tips on Instagram, Twitter, and LinkedIn over the years… but they’re impossible to find later on. Those social media posts should’ve been blog posts.)

(I have a MASSIVE folder of blog post drafts. I suppose I’ll have to actually finish those. 🙂 So maybe 36 blog posts is feasible??? TBD.)

I’ve considered really learning Tableau, R, and/or InDesign for years. I might attend the Tableau conference or take David Keyes’ R in 3 Months course, but… let’s be honest… I probably won’t. It’s much better for my career to focus on Excel than spread myself thin. In my experience, the niched, specialized consultants have the easiest time keeping their businesses booming. I need to find some advanced Excel courses to take. Recommendations?? It could be online or in Orlando. Let me know.

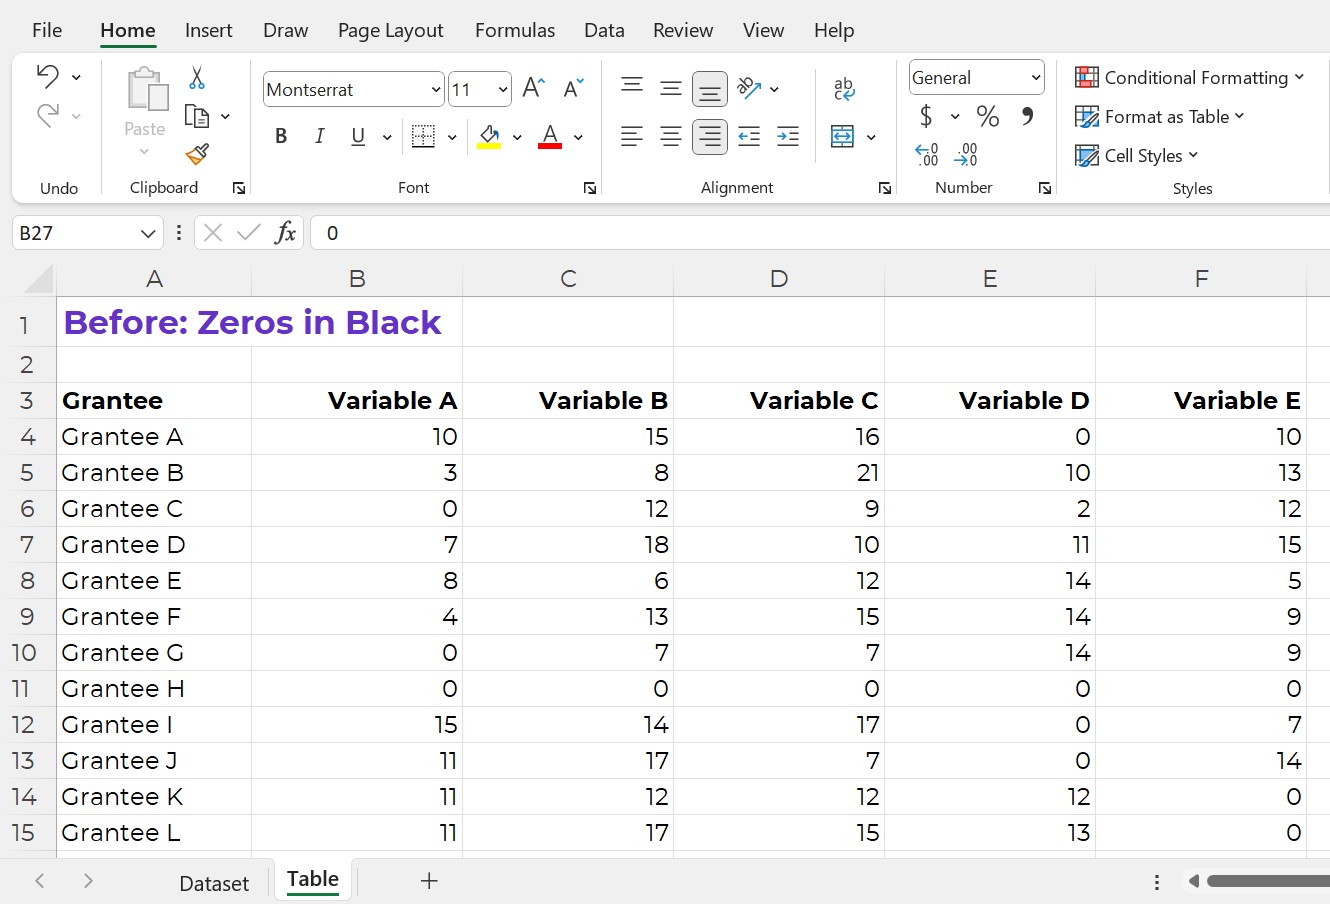
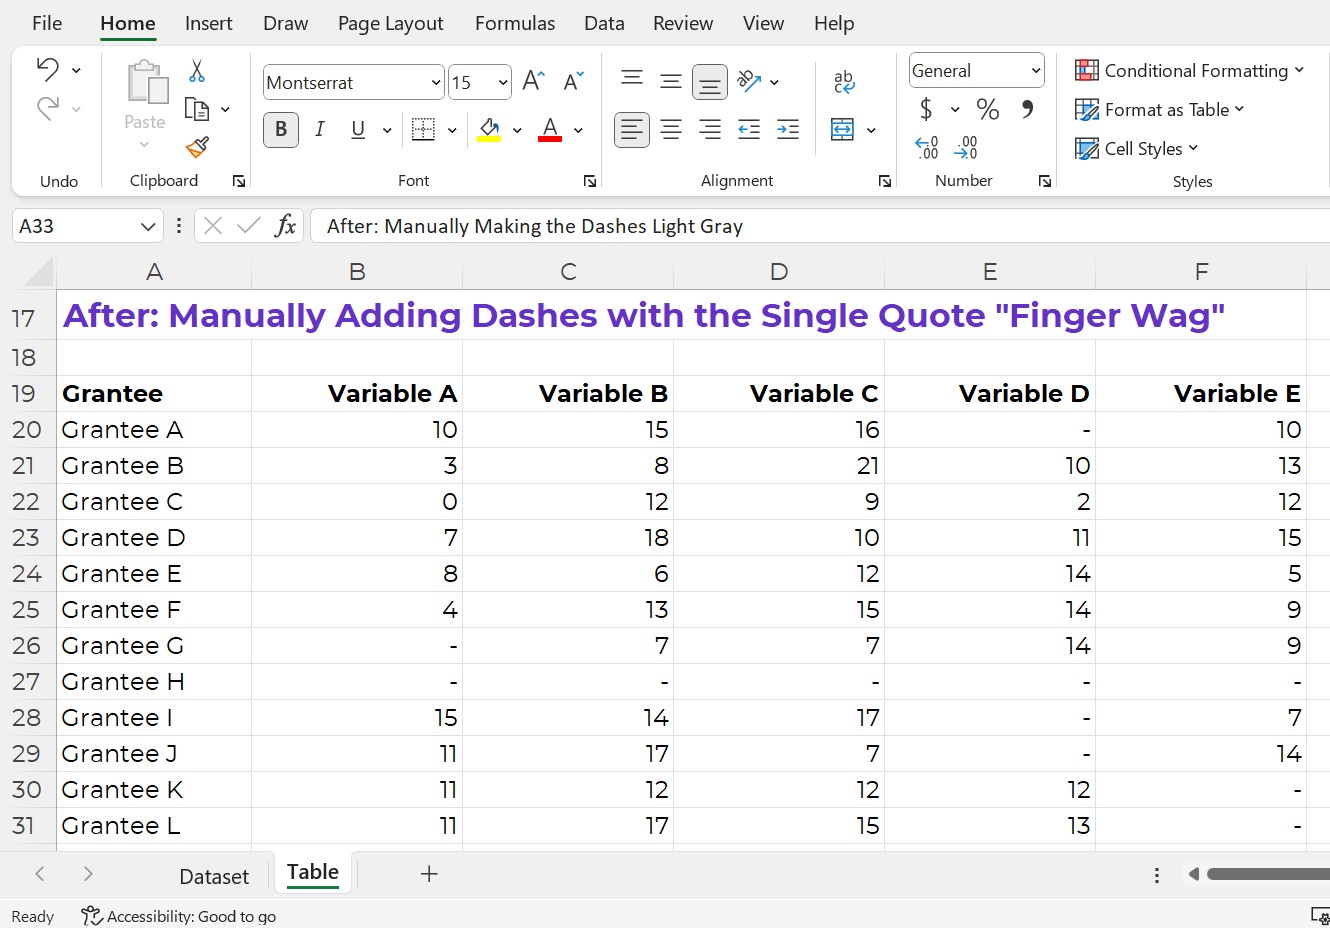
Speaking of Excel… a very, very, very aspirational project is to get Microsoft to improve their default settings so that they’re Accessible and accessible. I might write blog posts on the topic, post on their message boards, try to get in touch with the right people (who????), or maybe even join some sort of committee. This would practically put me out of a job. GOOD!!! I want to spend even more time with my kids. 🙂

I doubt I’ll take on any other projects this year. I don’t aspire to write a book in 2023. I won’t be starting a podcast in 2023. Etc. My private client trainings and my online courses keep my brain energized. I don’t have time or interest in starting other new projects this year. Life’s near-perfect already. Why change it?

Administrative & Logistical Tasks

I hesitated to mention these, since they’re so boring.

Are you interested in behind-the-scenes details??

If so, here’s what’s also on my radar:

  • Lean staffing. I let my virtual assistant go last year. She was excellent!! But I didn’t need administrative support anymore. I’ve automated the vast majority of tasks (thanks to software like Zapier, ConvertKit, etc.).
  • Accounting. In 2021, I upgraded from H&R Block to an accountant. In 2022, with my accountant’s support, I switched accounting software platforms. I also switched business structures (LLC to S corp). In 2023, we’ll investigate mega backdoor Roths, plus fine-tune some additional tax details.
  • Website. In 2012, I started a DIY blog. In 2017, I hired a company to design my website. In 2022, I re-hired them to update the website. In 2023, we’ll make a few more tweaks (e.g., describing what’s included in my courses and workshops a bit better).
  • Newsletters. I’ll continue sending newsletters ~weekly throughout the year; scrubbing the list; A/B testing the subject lines; and keeping the open rate and click-through rates high.
  • Digital resources. I’ll continue posting digital resources, like ebooks and chart templates, on Gumroad.
  • Social media. Like many others, I’ll be decreasing my Twitter time and increasing my time on LinkedIn and the Data Visualization Society’s Slack channel. I’ll continue making Instagram images, too (which are embedded here). I’ve learned a lot about sharing micro-content with Canva-made images over the past year, and there’s always more to learn.
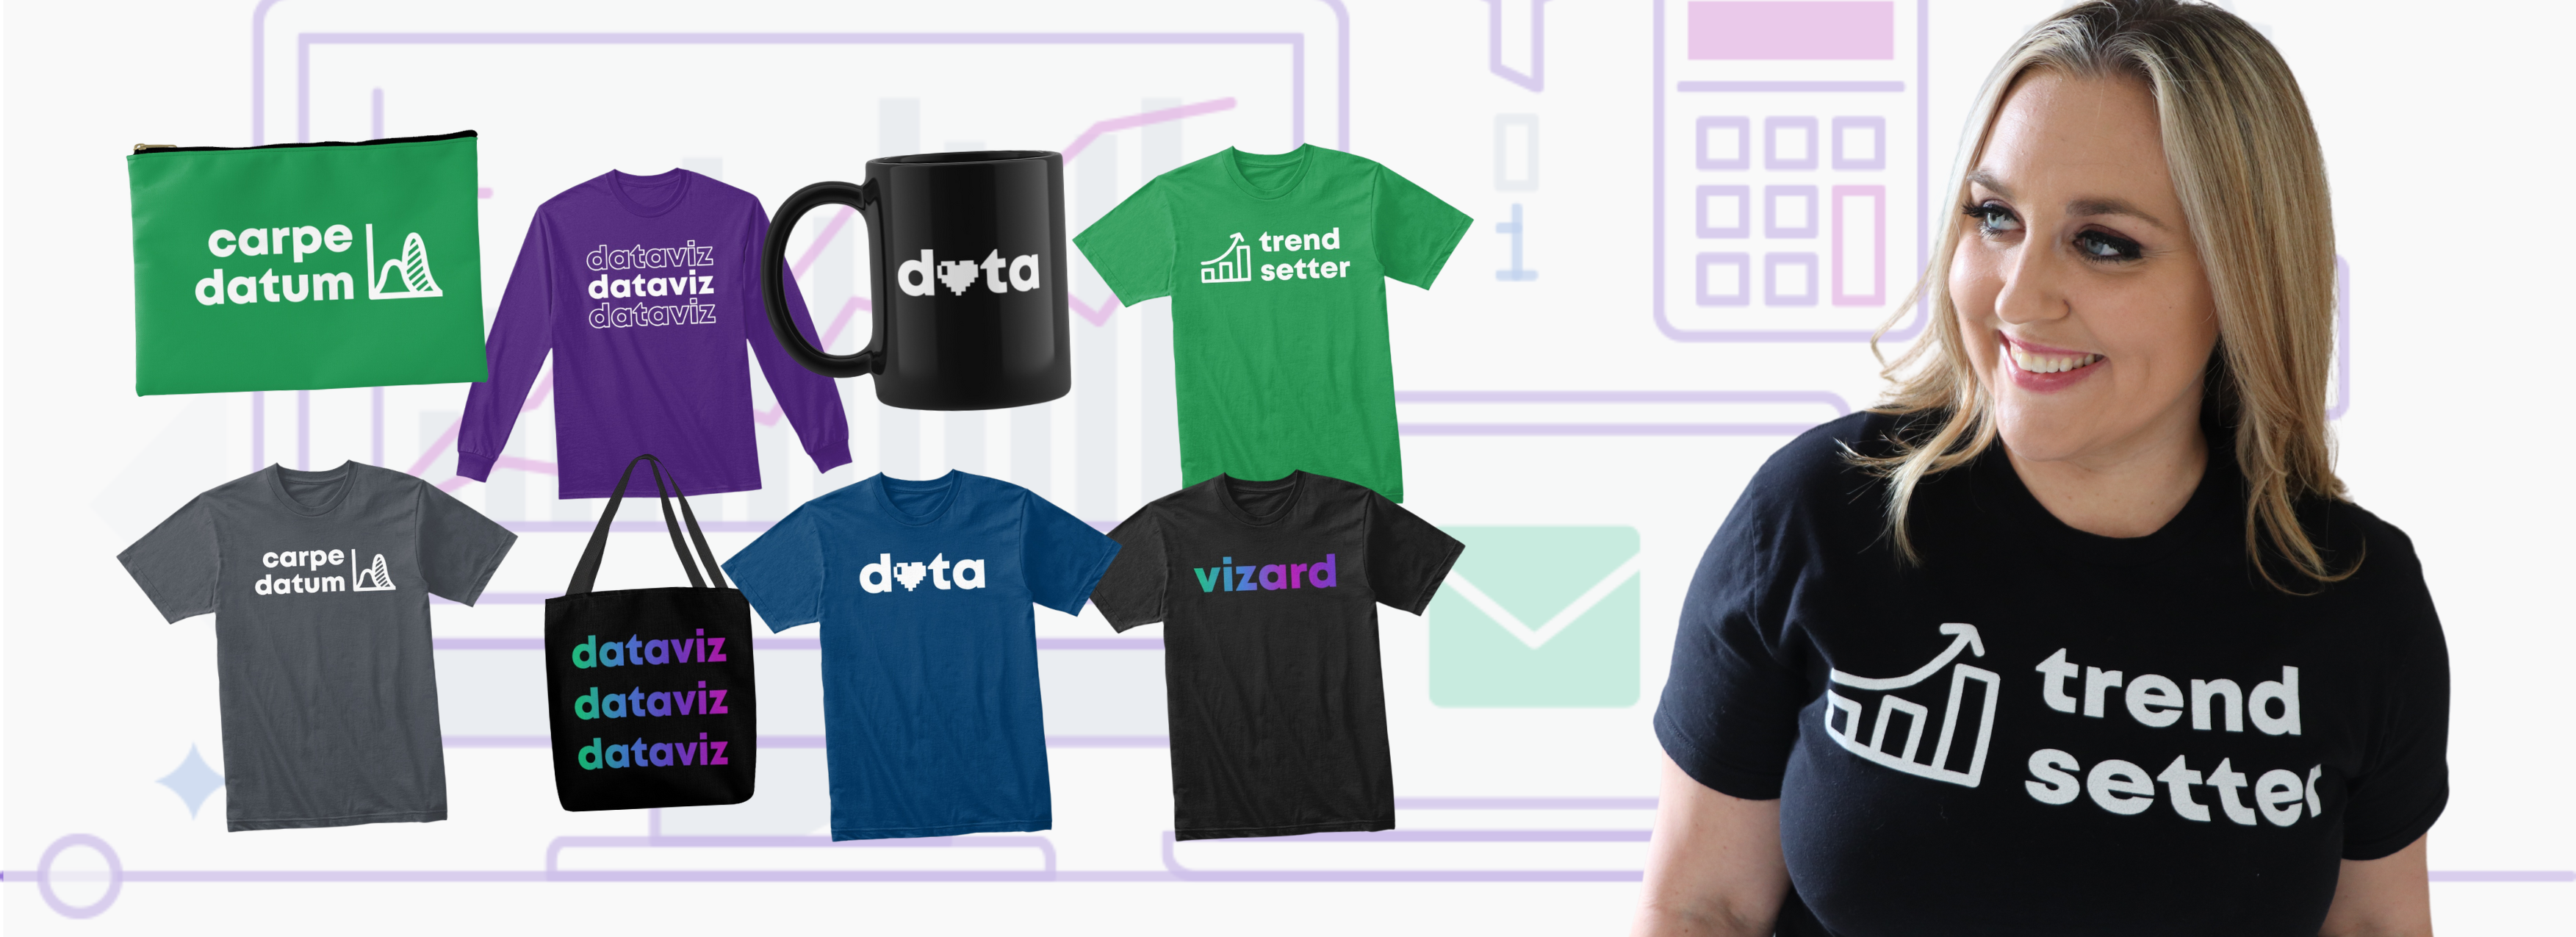
  • Swag shop. In 2020, I started providing swag (shirts, mugs, stickers, etc.) to participants in my online courses. In 2022, I opened the shop to anyone and shared it on my YouTube channel. In 2023, I’ll likely add some new designs to the shop. I’ll donate 100% of the proceeds for Giving Tuesday again, too.

Your Turn 

What are you focused on in 2023?  

Are you hoping to learn a new software program? Achieve a personal goal?  

Comment anytime and let me know! 

Written by cplysy · Categorized: depictdatastudio

Dec 19 2022

Top 22 Dataviz Resources of 2022

7,700 total participants in my dataviz courses so far.

29 new blog posts: 20 from me, and 9 from guest authors.

6 YouTube videos: 4 on my channel, and 2 made for colleagues’ channels.

Just 1 podcast interview this year.

3 months off.

What a year. 

Top 22 Dataviz Resources of 2022 

Want to do some year-end learning as 2022 winds down? 

Here are my favorite data visualization resources from the past year. 

  1. Are Viewers Expecting a Story? I’ve talked about data storytelling a bajillion times, and this video encapsulates some of those key points. This is a great resource to share with your colleagues who are just getting started with dataviz and data storytelling.
  2. What Makes a Useful Data Story? 5 Questions to Ask: If you’ve been analyzing data for decades, then you already know how to spot useful nuggets that deserve to get graphed. But if you’re newer to data analysis, then you’ll appreciate this beginner-level post.
  3. Dashboard Don’ts: My 10 Worst Mistakes from Past Projects: A great self-assessment to see whether your dashboards are as sophisticated as you think–or not.
  4. How to Plan for Your Next Dashboard [Lea Pica’s Present Beyond Measure Podcast]: I spoke on dozens of podcasts in previous years, but had to scale that back in 2022 to make space for a 3-month summer vacation. Lea Pica’s podcast made me rethink this approach though. What a skilled host!!! She made my job as the guest so easy.
  5. What Type of Dashboard Do We Need? 4 Types to Consider + Diagram to Download: A required prerequisite before your spend thousands of dollars developing a dashboard.
  6. Creating Reports for Grant Deliverables Using Excel Dashboards: Josephine Engels’ guest post, which showcases some of her organizations’ real dashboards. A great case study!
  7. How to Visualize Margin of Error Data in Excel with “Slider Plots”: Lauren Fox’s guest post on visualizing nuances in our datasets, like margins of error. Includes a spreadsheet you can download.
  8. How to Avoid Death by PowerPoint by Differentiating Between Slidedocs and Slidedecks: I have an entire course on this topic, but this is a great starting point for organizations with so-so presentation quality.
  9. How to Present Dense Data Visualizations (Without Losing Your Audience): This technique is obvious and straightforward–yet I rarely see it done well. Let’s change that!!!
  10. Using Dashboards to Make a Family Trivia Event Even Better: Emily Ross’ guest blog post on how she adapted her Dashboard Design skills in her personal life.
  11. Change Takes Time: How to Practice Patience in Report Redesign Processes: Abby Henderson’s candid reflections on the not-overnight culture change that’s necessary to apply what you learn from me.
  12. Humanity in Data Visualization: Designing a One-Pager for My Grandma’s Caregivers: A fan favorite! This blog post got the most replies and kudos of everything published all year. I got chills when I read Mieko Yeh’s draft.
  13. How to Hack Excel — and Add Totals to the Tops of Stacked Column Charts: Anat Zohar’s practical post on using invisible “helper data” inside our stacked charts.
  14. When a Course is More Than a Course: 3 Ways “Great Graphs in Excel” Was Beyond Graphs: Sue Griffey’s guest post about how she applied her course knowledge to her work life.
  15. How to Make a Not-So-Scary Starter Dashboard in Excel: One of my favorite beginner-level resources for getting started with Excel dashboards. Just 5 minutes, and includes a free download. I was pleasantly surprised when this video got 8,000 views within the first couple days.
  16. Do You Need a Single Map, or Several Maps? Every time I do a private client training, I try to find case studies that I can anonymize and turn into later blog posts. And every time, I run out of time. Until now!! I finally made time to turn this specific map lesson from a client training into a blog post to help more people.
  17. How to Write about Research Methods Like a Human (and Not a Textbook): Even though I focus on graphs… I have to edit paragraphs a lot. This post has plenty of before/after examples to get you started on editing your own writing.
  18. Stop Using Tiny, Grainy Photos in PowerPoint!!! Another anonymized example from a client training. This technique is obvious, but not widely used. Let’s change that, too!
  19. “Big A Accessibility” and “little a accessibility” Tips for Data Visualization: A mostly-complete checklist of everything we need to edit to ensure that our visualizations are accessible.
  20. How to Use Repeating Diagrams to Visualize Qualitative Concepts: My personal favorite from 2022.
  21. How to Use Gray Dashes Instead of Zeros in Tables: Includes an Excel tutorial and a spreadsheet to download.
  22. How I Took 3 Months Off Work: A behind-the-scenes look at my part-time schedule, which I’ve been building 1% at a time since 2014. I didn’t take off 3 months because I was burned out. I simply have a long list of life goals that I’m trying to accomplish alongside my work goals. I had to take time off work to make space for those life goals.

Your Turn

What types of tutorials should I create in 2023?

Comment below with your requests.

Written by cplysy · Categorized: depictdatastudio

Dec 12 2022

How I Took 3 Months Off Work

“Are you going to write a blog post about taking 3 months off??” a colleague asked me.

“I wasn’t planning on it. I wanted to take off the summer to be with my kids, so I did. I didn’t do anything profound.”

“But that’s exactly what’s profound about it – that you don’t even think it’s a big deal.”

—

Here’s how it worked.

When kindergarten ended and the kids went on summer break, so did I.

First, we enjoyed an Orlando staycation week.

We sang our favorite Encanto songs around Disney.

We slipped ‘n’ slid in the backyard.

Then, we packed our camping gear and headed west.

We spraypainted cars at Cadillac Ranch.

We rented bikes in New Mexico.

We jeeped through southwestern Utah’s trails on 100-degree days.

And then cooled off at the local rec centers.

We ate glamorous dinners while BLM-camping.

We collected treasures and mosquito bites along the Colorado River.

We cub-wrestled and cuddled in the tent every morning.

We ate peanut butter and jelly sandwiches along creeks.

We cartwheeled through the Salt Flats.

We tagged along to mommy’s work conference in Boise. The girls still talk about the closing party, which was luau-themed.

We earned Junior Ranger Badges from lava rocks.

We hiked around Jenny Lake with my 30-pound “backpack.”

We watched the geysers from Old Faithful Inn.

We cub-wrestled and cuddled some more.

We collected wood for campfires.

We held our noses around the stinky mud pots.

We had snowball fights in July.

We rodeo’d in Wyoming, and stayed afterwards to get the clowns’ autographs.

We meditated among fallen trees in Wyoming, my 6-year-old’s “happy place.” Mine too, girl. Mine too.

We walked along dinosaur tracks.

We earned more Junior Ranger Badges.

We motorcycled through Sturgis.

We panned for gold, explored mines, and rode horses through the Black Hills.

We kayaked in Custer State Park.

We napped whenever we wanted to.

We smiled nicely for the camera.

We drank 5-cent coffee among the jackalopes.

We met up with grandpa and made him buy us all the toys.

We splashed in fountains in Omaha.

We stopped at public parks to get the wiggles out.

We celebrated our wedding anniversary from a children’s museum.

We forgot to make reservations and couldn’t actually go to the top of the arch. ☹

We zoo’d and baseball’d in St. Louis.

We Varisty’d in Atlanta.

After 7 weeks, 20 states, and 7,412 miles, we were home.

We went back-to-school shopping and got our ears pierced.

Our 18-month-old FINALLY started walking. No more 30-pound “backpack” for mommy to carry!!! 😊

We staycationed in Orlando some more.

A couple weeks later, it was time for first grade for the big kid, “Daddy School” for the little kids, and work for mom.

From 5 Weeks Off in 2021…

Last year, in the summer of 2021, my husband and I loaded our 3 kids into our Jeep for a 5-week road trip throughout the southwestern U.S.

In our 1998 Jeep with 275,00 miles.

With our 4-month-old son.

That seemed… normal… for us.

After all, we’d spent 2019 and early 2020 traveling throughout South America, Africa, and Southeast Asia. Surely we could handle tent-camping for 5 weeks.

My only regret: that it wasn’t longer.

… to 3 Months Off in 2022

I started planning my 2022 summer vacation an entire year in advance:

  • scheduling all my client workshops and consulting projects for non-summer months;
  • spacing out my online courses to allow for a long summer break; and
  • politely declining all volunteer work (podcast interviews, guest lecturing, opportunities to review books and manuscripts, and serving on committees).

And then I took 3 months off.

And nobody minded.

I would say to prospective clients, “I’m not available over the summer, how about a fall training?” It was simple.

There were zero business repercussions.

Quite the opposite.

2022 has been the highest net revenue year yet for Depict Data Studio, despite working the least. Likely because I worked the least, and was the most focused.

It Took Years to Fine-Tune My Own Schedule

My 3-month vacation didn’t happen overnight.

It was 8 years in the making.

My first day of self-employment was September 8, 2014.

Ten days later, my husband turned 30, and he decided he was ready to have kids. This threw me off; we’d been married nearly a decade already (high-school sweethearts) and we’d firmly decided we were on the no-kids track.

After some convincing, I changed my mind, and our first daughter was born in 2015.

In 2015, practically overnight, I transformed from a typical DC-area workaholic into taking several months off for maternity leave. With lots of long-term contracts on my plate, this was no small feat. There was lots of planning. Subcontractors, adjusting timelines, submitting deliverables. During my very first year of self-employment, I was already working part-time. By necessity, not by choice.

In 2016 and 2017, I chose to take off Fridays to be with baby 1. We called them “Field Trip Fridays” and we visited every museum, zoo, and state park within a 2-hour drive of our apartment.

In 2018, baby 2 was born, and despite Field Trip Fridays with my two kiddos, my frequent work travel was taking a toll. I couldn’t stand to be away from my kids. There were lots of homesick flights to/from conferences and client workshops.

In 2019, we sold nearly everything to travel the world with our two kids. This felt logical at the time: Just bring the kids along as I taught dataviz in Guatemala, Zambia, Canada, Taiwan, Thailand, Vietnam, Japan, Korea… It was a grand adventure and my only regret is not taking the leap sooner.

In 2020, we hunkered down in Florida during the pandemic, fell in love with purple sunsets and palm trees, bought a house, and decided to try for baby 3. I knew I’d be working virtually for a while. It’s rough to be pregnant on planes, so I figured it’d be easier to be pregnant on my own couch during quarantine.

Despite years of Field Trip Fridays and frequent time off, 2021 demanded even more flexibility. Baby 3 arrived early. There were multiple hospital stays. I was grateful that I’d carefully crafted this part-time schedule, one percent at a time, over the past few years. It was another year of working part-time by necessity, not by choice, with the exception of a 5-week not-long-enough camping trip in the middle.

By 2022, it was time to go for it: The full 3-month vacation dream.

What’s In Store for 2023

I’ll continue working the K12 school calendar. When my kids are home from school, the Depict Data Studio office is closed.

I’ve already had to decline speaking at a few summer 2023 conferences. Most of these organizations also host virtual training throughout the year, so it’s simply a “let’s work together in the spring or fall” scenario.

I’ll try to find time for volunteer projects again.

It’s a tough balancing act: Spend a few extra hours on a blog post that a hundred thousand people will skim or speak in a graduate course to just 15 people, which is an intimate setting where we can really connect?

Both volunteering options help the next generation of datavizzers. I’ll probably focus on blogging as my primary volunteering outlet because it has the most efficient “one to many” structure.

Answering Your Questions

Want to work up to regular 3-month vacations and part-time work? What sorts of logistical questions do you have? Ask me anything.

Written by cplysy · Categorized: depictdatastudio

Dec 05 2022

How to Use Gray Dashes Instead of Zeros in Tables

Ready to fine-tune your tables?

Here’s one of my favorite table decluttering tips: Change the black zeros into gray dashes—with formulas and conditional formatting.

Before: Zeros in Black

Does your table have lots of zeros?

Sometimes my tables have huge values—numbers, percentages, or currency into the thousands, millions, or even billions.

Other times, my tables have small values—lots of single digit and double digit numbers, and even some zeros, like this one.

I recently worked on a dashboard project with a foundation where our n was just 11 grantees. It was the smallest n I’d worked with in a while!

This table is fictional, but you get the idea.

Here’s the old way to show zeros: In black text.

After: Manually Adding Dashes with the Single Quote “Finger Wag”

Let’s replace the 0s with dashes.

In Excel, here’s how:

  • If you type a dash, Excel will get confused. Excel thinks we’re creating a subtraction formula.
  • Instead, start with a single quote, a.k.a. the Finger Wag. We’re scolding Excel. The single quote means, “Don’t change my format! Leave whatever I type after the single quote alone! This isn’t supposed to be a subtraction formula! It’s just a dash!”
A GIF showing how to type a single quote and a dash into a cell.

The finished product would look like this (below).

Now, we can actually see the zeros better!

It’s easier to see that Grantee H had an entire row of zeros. Variables D and E also had more zeros than the other variables.

A screenshot from Excel showing all the zeros turned into dashes.

After: Manually Making the Dashes Light Gray

Let’s keep going.

I usually make the dashes gray (so they disappear even more).

You can simply change the font color.

A GIF showing how to change the font color from black to gray in Excel.

After: Automatically Adding Dashes with an IF Statement

But what if your tables values come from another source? (So there are formulas living behind the scenes?) In that case, we can’t simply type a dash by hand. It would remove the formula.

In this example, I’m pretending we’ve got a separate dataset on its own sheet.

The table is a sum of all those entries.

My tables often have sumifs, countifs, xlookups, and more living behind the scenes, like this:

A GIF showing that there are sumif formulas inside the Excel spreadsheet.

We can adjust our existing formulas just a tad.

I add IF statements so that if my formula results in a zero, then it shows a dash:

A GIF showing how to create an IF statement such that zeros are automatically shown as dashes.

After: Automatically Making Dashes Gray with Conditional Formatting

Finally, let’s add another time-saver.

Let’s use Conditional Formatting to automatically turn the dashes gray.

The fewer manual changes, the better!

Formulas and Conditional Formatting save our future selves a lot of time. If we add new entries to our dataset, then the formulas will automatically update.

Formulas and Conditional Formatting also reduce typos. We won’t accidentally forget about one of the zeros.

Here’s how:

  1. Highlight the table.
  2. Go to the Home tab.
  3. Click on the Conditional Formatting button.
  4. Choose Highlight Cells Rules.
  5. Choose Text That Contains.
  6. In the pop-up window, type a dash.
  7. Instead of “Light Red Fill with Dark Red Text,” go to the bottom of the drop-down list, and choose Custom Format.
  8. On the next pop-up window, change the font color to gray.

That sounds like a lot of steps, but it’s fast, I promise!

Once you get familiar with Conditional Formatting, it only takes this long:

A GIF showing how to apply Conditional Formatting in Excel.

Yes, You Can Transfer Formatted Tables from Excel into PowerPoint or Word

Here’s how you’ll transfer your table into Word:

  1. In Excel, finish formatting the table. I added gray lines between the rows and I “hid” the grid lines from the cells (View tab –> uncheck the Gridlines box. Sure, you can adjust the borders later in Word, but table formatting is generally a pain in Word. I try to do 99.9% of the formatting in Excel.
  2. In Excel, I highlighted and copied the table with good ol’ CTRL + C.
  3. In Word, I went to Paste –> the down-arrow–> Keep Source Formatting.
  4. Then, in Word, I re-sized the table to fit the page.

It looks like this:

A GIF showing how Paste Special the table from Excel into Word.

Here’s how you’ll transfer your table into PowerPoint:

  1. In Excel, finish formatting the table. I added gray lines between the rows; I “hid” the grid lines from the cells (View tab –> uncheck the Gridlines box); and I re-sized the columns (wider) and rows (taller). Sure, you can adjust these things in PowerPoint later… but it’s such a pain. I prefer formatting in Excel first, and then transferring to PowerPoint.
  2. In Excel, I highlighted and copied the table with good ol’ CTRL + C.
  3. In PowerPoint, I went to Paste –> the down-arrow –> Keep Source Formatting.
  4. Then, in PowerPoint, increase the font size. I recommend 18+ for presentations.

Please don’t take screenshots from Excel and paste them into other programs. Your table will get blurry.

Please don’t transfer tables and graphs as images. They’ll get blurry.

A GIF showing how Paste Special the table from Excel into PowerPoint.

Please don’t take screenshots from Excel and paste them into other programs. They’ll be blurry.

Please don’t transfer tables and graphs as images. They’ll be blurry.

Download the Spreadsheet

If you’re familiar with sumifs, if, and Conditional Formatting, then this will be fast and easy for you!

If you’re new to sumifs, if, and Conditional Formatting, then download my spreadsheet. You can click through the formulas yourself to see how everything is set up: https://depictdatastudio.gumroad.com/l/UseGrayDashesInsteadOfZeros

Written by cplysy · Categorized: depictdatastudio

Nov 29 2022

100% of Swag Proceeds Donated for Giving Tuesday

For Giving Tuesday, I’m donating 100% of swag proceeds to nonprofits.

  • Short-sleeve shirts
  • Long-sleeve shirts
  • Sweatshirts
  • Mugs
  • Totes
  • Pencil cases

Browse the shop: https://depictdatastudio.creator-spring.com/

Now through Tuesday, December 6, 2022.

– Ann K. Emery

Ann K. Emery of Depict Data Studio is wearing a shirt that says "Trend Setter" and is pictured alongside shirts, mugs, and pencil cases.

Written by cplysy · Categorized: depictdatastudio

  • « Go to Previous Page
  • Go to page 1
  • Interim pages omitted …
  • Go to page 17
  • Go to page 18
  • Go to page 19
  • Go to page 20
  • Go to page 21
  • Interim pages omitted …
  • Go to page 37
  • Go to Next Page »

Footer

Follow our Work

The easiest way to stay connected to our work is to join our newsletter. You’ll get updates on projects, learn about new events, and hear stories from those evaluators whom the field continues to actively exclude and erase.

Get Updates

Want to take further action or join a pod? Click here to learn more.

Copyright © 2026 · The May 13 Group · Log in

en English
af Afrikaanssq Shqipam አማርኛar العربيةhy Հայերենaz Azərbaycan dilieu Euskarabe Беларуская моваbn বাংলাbs Bosanskibg Българскиca Catalàceb Cebuanony Chichewazh-CN 简体中文zh-TW 繁體中文co Corsuhr Hrvatskics Čeština‎da Dansknl Nederlandsen Englisheo Esperantoet Eestitl Filipinofi Suomifr Françaisfy Fryskgl Galegoka ქართულიde Deutschel Ελληνικάgu ગુજરાતીht Kreyol ayisyenha Harshen Hausahaw Ōlelo Hawaiʻiiw עִבְרִיתhi हिन्दीhmn Hmonghu Magyaris Íslenskaig Igboid Bahasa Indonesiaga Gaeilgeit Italianoja 日本語jw Basa Jawakn ಕನ್ನಡkk Қазақ тіліkm ភាសាខ្មែរko 한국어ku كوردی‎ky Кыргызчаlo ພາສາລາວla Latinlv Latviešu valodalt Lietuvių kalbalb Lëtzebuergeschmk Македонски јазикmg Malagasyms Bahasa Melayuml മലയാളംmt Maltesemi Te Reo Māorimr मराठीmn Монголmy ဗမာစာne नेपालीno Norsk bokmålps پښتوfa فارسیpl Polskipt Portuguêspa ਪੰਜਾਬੀro Românăru Русскийsm Samoangd Gàidhligsr Српски језикst Sesothosn Shonasd سنڌيsi සිංහලsk Slovenčinasl Slovenščinaso Afsoomaalies Españolsu Basa Sundasw Kiswahilisv Svenskatg Тоҷикӣta தமிழ்te తెలుగుth ไทยtr Türkçeuk Українськаur اردوuz O‘zbekchavi Tiếng Việtcy Cymraegxh isiXhosayi יידישyo Yorùbázu Zulu