• Skip to main content
  • Skip to footer
  • Home

The May 13 Group

the next day for evaluation

  • Get Involved
  • Our Work
  • About Us
You are here: Home / Archives for allblogs / depictdatastudio

depictdatastudio

Apr 04 2022

How to Avoid Death by PowerPoint by Differentiating Between Slidedocs and Slidedecks

Do you use PowerPoint? Probably.

What do you use PowerPoint for?

You might use PowerPoint to:

  1. Create slides to accompany a presentation (i.e., you’re getting ready to speak at a conference, meeting, or other in-person or virtual event); and/or
  2. Create documents that someone can read on their own (i.e., when you’ll circulate the slides as an email attachment before or after a meeting).

I talked with Boris Hristov on the World of Presentations podcast about this distinction.

Ann K. Emery and Boris Hristov talking about how to avoid Death by PowerPoint.

Other times, we need to use PowerPoint for standalone docs like email attachments or printed handouts.

Without a clear distinction, we run into Death by PowerPoint — presentation slides that are as dense as reports. Or, reports that are as sparse as presentations.

Boris is the founder of presentation agency 356labs and a PowerPoint MVP. Boris has years of experience as a trainer, mentor, and consultant and has trained and coached not just students, but also people from the IT, sales, marketing and management fields in topics ranging from presentation skills and storytelling through the psychology behind slide design.

You can watch our conversation or read the highlights below.

Watch Our Conversation

Want to learn more about the distinction between slidedocs and slidedecks?

Here’s a recording of the podcast episode:

How to Differentiate Between Slidedocs and Slidedecks

In this episode, you’ll learn how to differentiate between slidedocs and slidedecks when using presentation software like PowerPoint or Google Slides.

Slidedecks are presentation slides that accompany the speaker, and they’ll generally have as little text as possible and plenty of high-quality images.

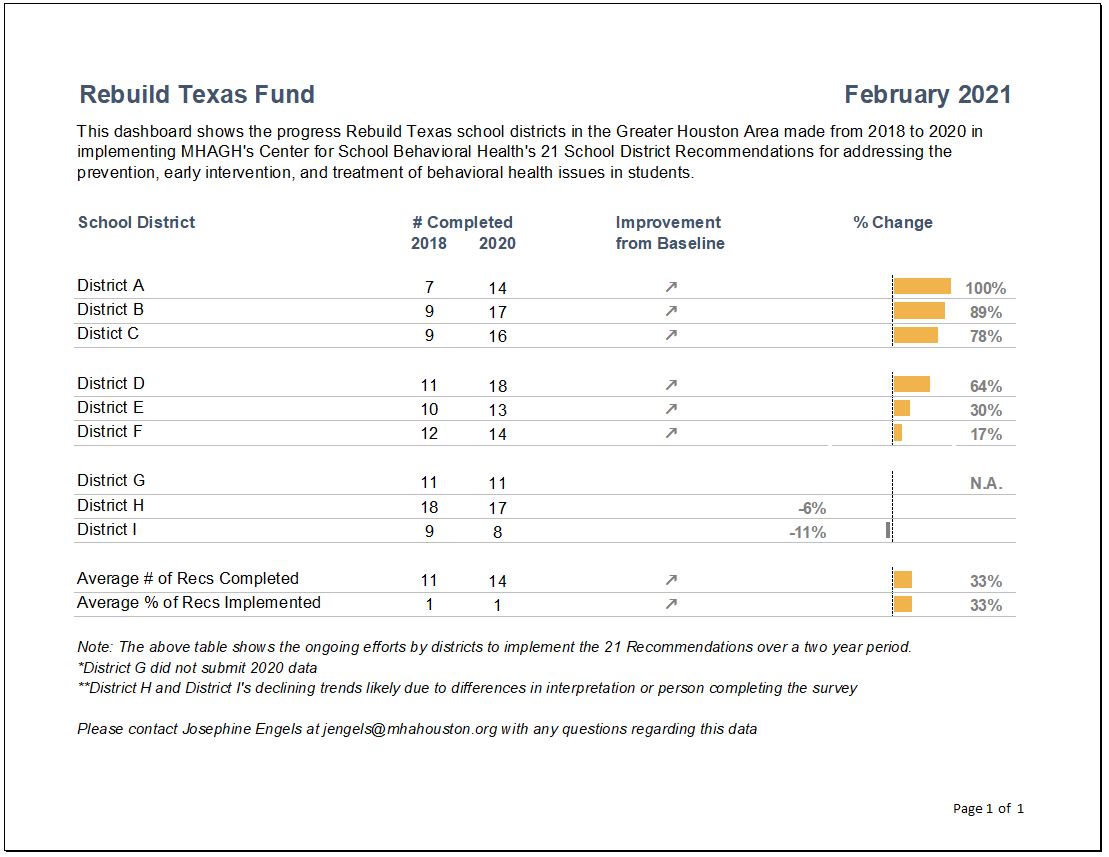
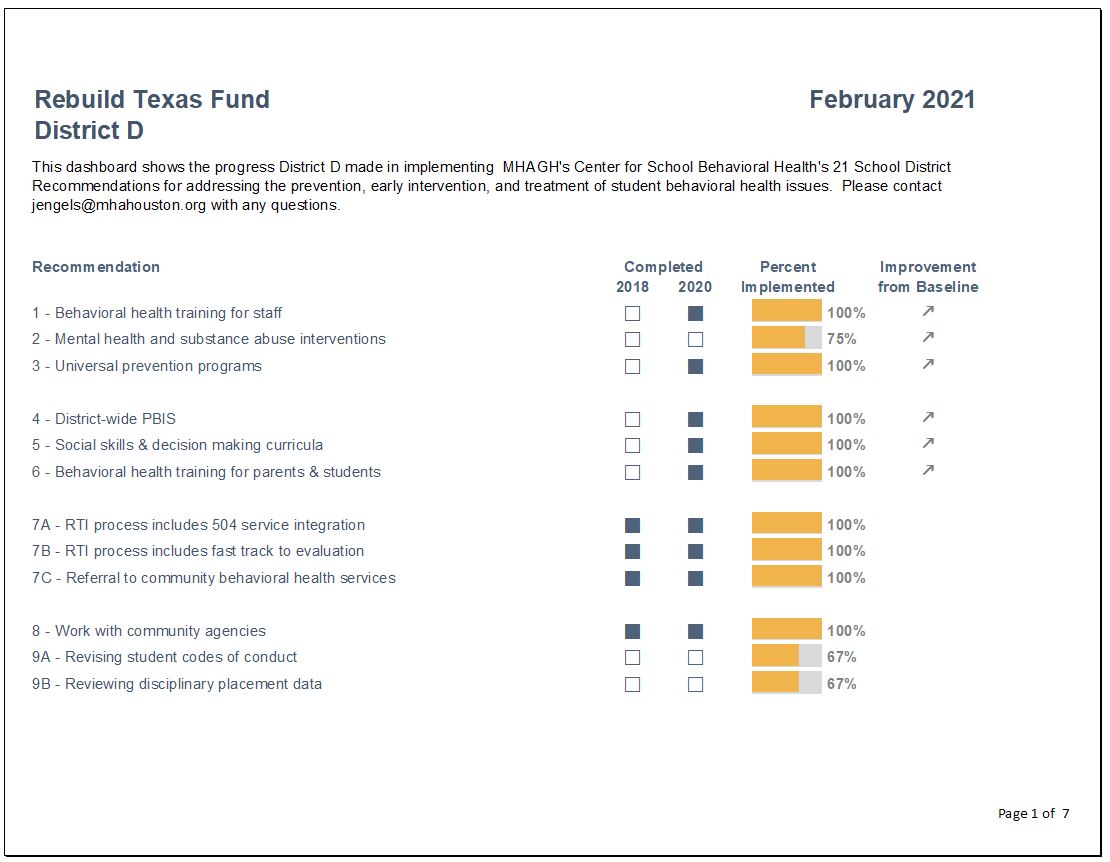
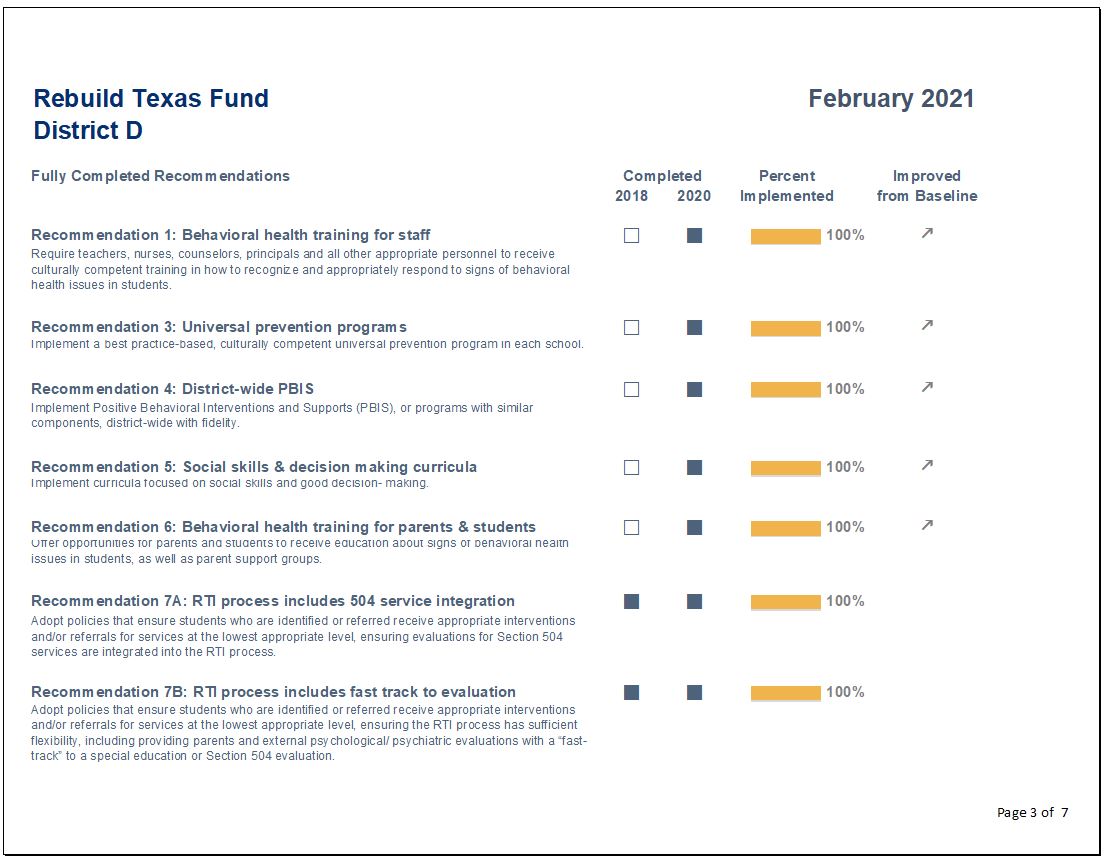
Slidedocs are standalone documents that just happen to be made in PowerPoint instead of Word. Since they’re meant to be reports, they’ll need more full sentences.

You’ll learn about five specific ways to design better slidedecks and slidedocs:

  1. Titles and Headings
  2. Amount of Text
  3. Font Size
  4. Visuals
  5. Length

Titles and Headings

The first difference we should see between slidedecks and slidedocs is the wording.

In slidedocs, I recommend takeaway titles, which have the “so what?” directly in the headings, subheadings, and graph titles.

In slidedecks, I used to say that topical titles were okay because the presenter would explain the “so what?” with their voice.  But, nowadays, I recommend using takeaway titles for both formats (for presentations and documents). Our audiences are busy, and I can’t risk confusing them.

Amount of Text

In slidedecks, we should aim for as little text as possible. No full paragraphs. No full sentences. Key phrases only. The speaker fills in the information with his or her voice.

In slidedocs, I recommend using full sentences and paragraphs. This is a report, after all. Our readers need to understand the content on their own; there won’t be a presenter explaining the information to them. Our report just happens to be made in PowerPoint.

Font Size

Slidedecks need large font (size 18+ for body text). For in-person presentations, the text needs to be big enough for people in the verrrry back of the room to see it. For virtual presentations, the text needs to be big enough for people to read it from their phone screens.

Slidedocs are essentially just reports, so they need report-size font (~size 11 for body text).

Visuals

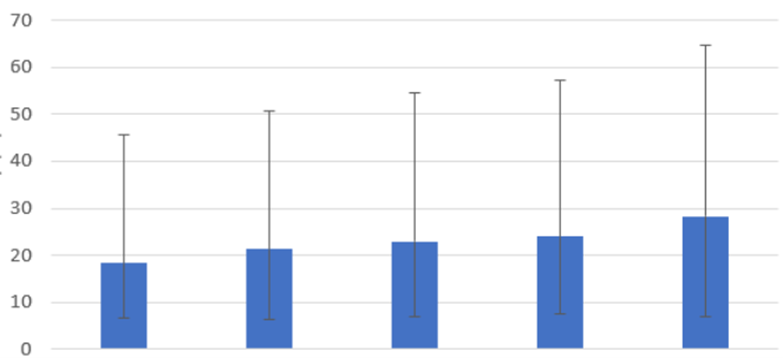
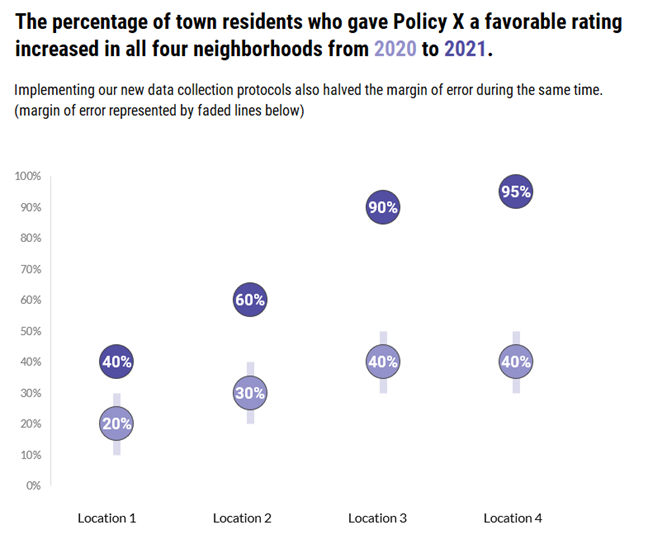
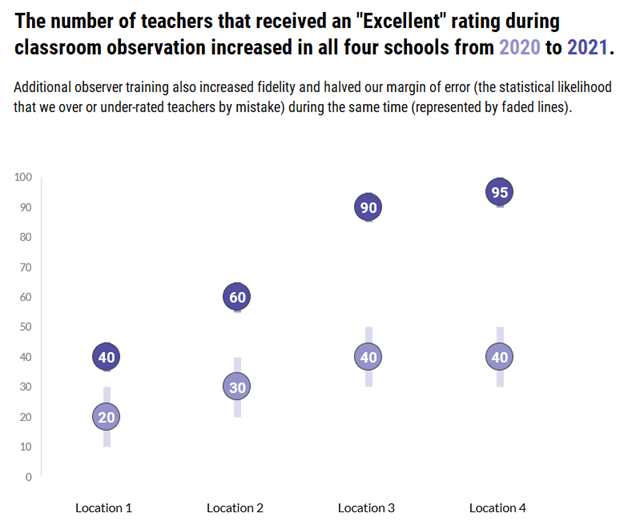
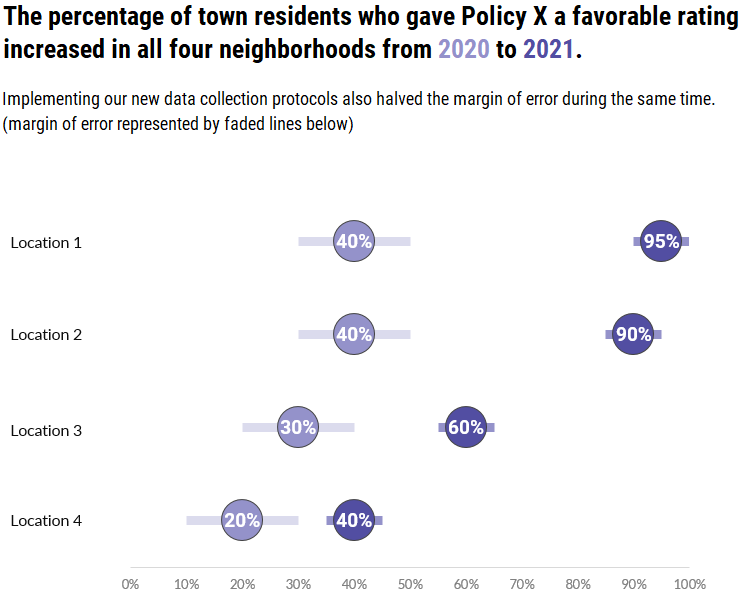
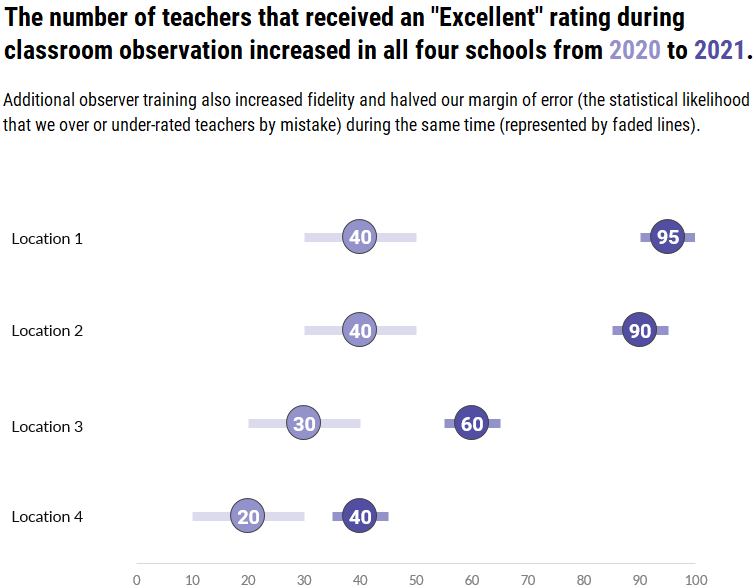
I recommend storytelling graphs for both slidedecks and slidedocs.

“The term data storytelling is used different ways,” you’ll hear me say in the podcast. Storytelling graphs have an intentional dark/light contrast, accompanied by takeaway graph titles.

Our brains can’t help but notice dark colors, so choose one key point that you want your audience to focus on, and make that darker.

For slidedecks, I recommend just one graph per slide to focus your audience. That way, the audience members are actually looking at the right graph as you talk about it. If we put too many graphs on the screen at once, we risk losing their attention.

Length

When we’re designing slidedocs, we typically need to stay within page limits. There might be written or unwritten rules about keeping the report to 3, 5, or 10 pages, for example.

When we’re designing slidedecks, we should ignore “rules” about slide limits. Use as many slides as you need! In the podcast, you’ll hear me explain that “You’re clicking through [the slides] at a faster pace, but you’re not slurring your speech or talking really, really fast to get through everything.” You’re showing less per slide, and keeping the pace nice and quick.

Quick Dataviz Wins for Presentations

Finally, in the podcast, Boris asked me for data visualization tips.

I shared several Quick Wins that benefit our busy audiences. “People are very hard working, they’re very highly educated, I think we just don’t have the time,” I explained. “These are some tips to help speed up [the audience’s] comprehension knowing they live in a busy world.”

Quick tips include:

  1. Round decimal places to the nearest whole number;
  2. Avoid ALL CAPS; and
  3. Left-align text instead of centering.

Dataviz Book Recommendations

Boris asked me for book recommendations. Here are the books I mentioned:

  • Storytelling with Data by Cole Nussbaumer
  • How Charts Lie by Alberto Cairo
  • Presentation Zen Design by Garr Reynolds

Connect with Boris Hristov

  • World of Presentations Podcast: https://356labs.com/podcast/
  • Twitter: @brshristov
  • LinkedIn: @brshristov
  • Present to Succeed Conference: https://www.presenttosucceed.com/

Your Turn

Do you use PowerPoint for slidedecks, slidedocs, or both?

Ann K. Emery and Boris Hristov talking about how to avoid Death by PowerPoint.

Written by cplysy · Categorized: depictdatastudio

Feb 28 2022

How to Visualize Margin of Error Data in Excel with “Slider Plots”

Andrew Forsman is a Depict Data Studio student and self-described “data viz nerd” who has over 10 years of experience helping organizations plan for, execute, and learn from research and evaluations.

Andrew’s sharing examples of slider plots and step-by-step instructions for making them in Excel. Thanks for sharing, Andrew! –Ann

—

Hey everyone!  Andrew Forsman here from the Research & Evaluation Division (RED) of The University of Arkansas for Medical Sciences. Our group focuses on translating research into practice in fields like early childhood education, child nutrition, abuse prevention, and HIV education.

Much of my job involves working with faculty members and project leads to develop evaluation questions that lead to actionable data.

One of the biggest puzzles we face is how to translate those results (visually and verbally) so that everyone from expert audiences to laypeople can understand our findings and benefit from them.

The data viz world is full of options for visualizing basic data such as change over time, pre/post differences, and percentages/frequencies for a single point in time.

Sometimes however, your data (or your audience) demands a little more.

Case-in-point: When displaying margin of error is important.

The Challenge: Displaying Margin of Error Data

Back before the pandemic, one of our faculty asked for some help in visualizing her data for a conference on childhood nutrition.

I dressed it up the best I could, but it still fell far short of the best practices for data visualization. I figured there had to be a better way to display data with margins of error (a.k.a., the “95% confidence interval”), and set out to find it.

Spoiler alert: I didn’t find anything. So, a little bit at a time, over the course of several months, I built it myself. I call them “slider plots.”

Full disclosure: I didn’t know until after I developed these, but Stephanie Evergreen posted a rough sketch version of this idea using auto-calculated standard error bars back in 2017. Her title used “confidence intervals,” instead of “margin of error” so I missed it in my initial search.

While that means the basic idea behind my “slider plots” isn’t completely new, I’m still excited to build on her work and share this as a small step forward in chart design!

The Old Way

The “old way” involves using column charts with error bars.

The “old way” involves using column charts with error bars.

The New Way: Slider Plots

Slider plots can be vertical or horizontal. Here’s an example of a vertical slider plot that shows policy ratings from four different neighborhoods.

Here’s an example of a vertical slider plot that shows policy ratings from four different neighborhoods.

Here’s a second example of a vertical slider plot that shows teacher ratings in four different schools.

Here’s a second example of a vertical slider plot that shows teacher ratings in four different schools.

Here’s what a horizontal slider plot of those policy ratings would look like.

Slider plots can be vertical or horizontal. Here’s what a horizontal slider plot of policy ratings would look like.

And finally, here’s the horizontal version of the teacher ratings.

And finally, here’s what a horizontal slider plot of teacher ratings would look like.

Download the Excel File with Step-by-Step Instructions

The process to create slider plots follows many of the same steps as creating dot plots and adds a few more to create and customize your margin of error bars.

Start to finish (from creating a data table, to building your dot plot, through creating and customizing your error bars), there are 15 steps, plus a few optional sub-steps.

I’d like to list them all here, but this post would definitely get a TLDR citation from the blog police (Too Long, Didn’t Read).

While many of the steps are similar, vertical slider plots are easier to build so I recommend you start with those first.

The horizontal version may be harder to build, but it has the same readability advantages of classic dot plot we all know and love.

As a bonus, you can download a free Excel file with step-by-step instructions and screenshots, as well as an end-product template you can use to make the process much faster.

Andrew-Forsman_Slider-Plot-Instructions-1Download

Winning Hearts & Minds with Slider Plots

While slider plots do take some time to set up, the payoff for your effort is helping to expand the reach of data viz.

Many in the evaluation community have begun to adopt better data visualization practices to help communicate their work over the last few years, but there are still many spaces (workplaces, conferences, etc.) where we find resistance.

Some of that is fear of judgement; that we won’t be taken seriously as scientists by our colleagues if we present data in non-traditional ways.

If there’s one thing I’ve learned from being an evaluator in the early education space, it’s that if you want to change people’s minds (and then their behavior), you have to meet them where they are.

I’m under no illusions this chart type will suddenly convert all the data viz detractors or revolutionize the field.

However, the changes are small enough and familiar enough that they might be a bridge to expert audiences; a way they can slowly grow more comfortable with the idea that presenting data differently doesn’t make you less scientific.

Know Your Audience

As cool as it is to do something new, it’s important that I leave you with this reminder:

Most of the time, margins of error will not be important enough to visualize unless you’re dealing with an expert audience.

It will most likely confuse or distract less-advanced audiences from the point you’re trying to make.

However, you can try adding a little more explanation in the graph subtitle to bridge the gap (see my slider plots above for examples) if it’s critical for your lay audience to see the margins of error as well.

Connect with Andrew

LinkedIn: @aforsman3

Written by cplysy · Categorized: depictdatastudio

Feb 14 2022

Creating Reports for Grant Deliverables Using Excel Dashboards

Josephine Engels is an Evaluation Specialist at Mental Health America of Greater Houston.  She enrolled in our Dashboard Design course and is sharing how she uses her new skills in real life. Thanks for sharing, Josephine! –Ann

—

Are you tired of text heavy reports to summarize grant findings?

Do you want to update the look and feel of your reporting templates?

Save time and energy by using static Excel dashboards to design your grant deliverables. 

Your program data will come to life before your eyes and your readers will thank you. 

Read on to learn more about my journey implementing static dashboards in a non-profit context.

Dashboard Design Course Comes to the Rescue

New to dashboard design, I enrolled in Ann K. Emery’s Dashboard Design course to help tackle an upcoming grant report with many moving parts. 

Mental Health America of Greater Houston’s (MHAGH) Center for School Behavioral Health (CSBH) received a two-year grant from the Rebuild Texas Fund in 2018 to help 9 school districts in the Greater Houston Area address emerging behavioral health needs from Hurricane Harvey and improve their ability to respond to future disasters. 

My Challenge: 9 School Districts x 21 Recommendations

To assess school district capacity for addressing student behavioral health needs, CSBH uses a rubric with 21 recommendations for addressing the prevention, early intervention, and treatment of behavioral health issues in students. 

My challenge was to show the progress each of the 9 Rebuild Texas school districts made implementing the 21 recommendations from start to finish of the grant.  

Using Static Dashboards to Track Progress Over Time

Cue the entrance of a tool that saved me time and created a great looking end-product: static Excel dashboards.

Here’s how I created two different styles of dashboards: A project overview, and individual report cards for each district.

Dashboard Showing the General Overview

To create a general overview tracking school district progress, I did the following:

  • Clustered school districts in groups of 3 and added grey lines for easier reading.
  • Used the start and end years to list how many recommendations were completed.
  • Inserted trend arrows to show which districts had improved.  I decided to remove the arrows for neutral or declining trends to simplify takeaways and make the report less “busy” for the reader.
  • Inserted deviation bars to show percentage of change from start to end.
  • Ordered results from largest to smallest amount of change.

Individual District Report Cards

I then created individual district report cards by:

  • Inserting checkboxes to indicate recommendation completion.
  • Replacing deviation bars with progress bars to show the depth of implementation of each recommendation.
  • Including grey shading in the background of the progress bars to indicate progress remaining.
  • Inserting trend arrows to further indicate improvement since there might have been progress in implementation even though the recommendation was incomplete.

Recommendation-by-Recommendation Summary

I also included a recommendation-by-recommendation summary, which was categorized by fully and partially completed recommendations.

Conclusions Section

Finally, I created a section for conclusions to inform the reader of the progress made as well as areas for future improvement. 

Lessons Learned

Here are three lessons learned.

Excel is so Versatile

Excel is much more versatile than I thought.

There are so many functions in Excel that I was underutilizing, so many hidden treasures. 

The amount of visualization that can be done with the conditional formatting command alone was eye opening. 

Why pay more for expensive software when Excel can do the work?

Save Time Using Only One Software

Transferring work from Excel into other products can be overkill when you can just do it all in Excel. 

Save time by designing single or multi-page reports in Excel. A cinch after taking the Dashboard Design course.

Formatting Matters

This course helped me break bad habits and reconsider my assumptions. 

Here are some formatting takeaways:

  • There is such a thing as using too much bold text.
  • Consider using landscape view when designing reports. It’s easier on your reader not to have so many items crammed into a narrow portrait view.
  • Use more white space, less is more.
  • Webdings and Wingdings font, who knew?

Colleague Reception

While I enrolled in the Dashboard Design course to help me with a very specific project in mind, I have since designed static dashboards for all of my organization’s program areas and am only getting started! 

My colleagues have given very positive feedback, as the dashboards have made it easier to analyze their program data more comprehensively. 

They especially appreciate one-pagers that can be shared with different stakeholders, including board members and program collaborators. 

Upcoming Goals

Next on my list is using automation to create a series of matching goal tracking dashboards that let programs see their progress toward grant metrics by funder.  I am embracing automation in 2022! 

I’ll also be visualizing accounting data to help programs get a better understanding of their funding use. The areas for application within our organization are endless.

I hope other non-profit professionals working with data will be able to take advantage of this wonderful opportunity. 

Connect with Josephine Engels

LinkedIn: https://www.linkedin.com/in/josephine-engels-mhagh/

Written by cplysy · Categorized: depictdatastudio

Feb 07 2022

What Type of Dashboard Do We Need? 4 Types to Consider + Diagram to Download

What type of dashboard do we need for our project?

I want to talk about something that’s a little controversial in the dashboard space: There are 4 types of dashboards, all of which are correct.

You might need one type.

Or, you might need all four.

Every audience and every project is a little bit different.

Our goal is to deliver the right data, to the right audience, at the right time.

Watch the Video

Here’s a 12-minute video to help you narrow down which type(s) of dashboard you need for your next project.

First, you’ll think about your audience. Are they technical or non-technical? Leaders or doers?

Then, you’ll choose a software program. Sometimes you’ll need spreadsheets (like Excel), and other times you’ll need dashboard programs (like Tableau or PowerBI).

Here’s a summary of what’s inside the video.

Dashboard Mismatches to Avoid

What if the audience has one idea in their mind… and we design something completely different??

Sometimes we get lucky, and we make exactly what they want.

Other times, I see mismatches.

Common Dashboard Mismatch: Static vs. Interactive

Sometimes the audience really wants an interactive dashboard, but we make a static dashboard.

In real projects, that almost never happens. I typically see the opposite issue: We design an interactive dashboard, but they really needed a static dashboard.

Common Dashboard Mismatch: Single or Series

Here’s another dashboard mismatch I see a lot:

Sometimes the audience really wants a single dashboard, but we design a series of matching dashboards.

Or, I see the opposite:

The audience really wants a series of matching dashboards (e.g., one for Project A, one for Project B, and one for Project C), but we give them a single overview showing all three projects combined.

The Four Types of Dashboards

Let’s be proactive and avoid these dashboard mismatches altogether.

Here are some factors to consider at the very beginning of your next dashboard project.

Technical or Non-Technical?

Is your audience technical or non-technical?

Technical audiences love data, details, and decimal places.

Non-technical audiences would rather be doing something else, like leading the project, developing new policies, or managing the team.

Time is another factor: Are they busy? Or, do they have time to explore a dashboard on their own?

Non-technical or busy audiences tend to prefer static dashboards. These short PDFs can be shared as email attachments or as printed meeting handouts.

Technical audiences (or those with plenty of time available) tend to prefer interactive dashboards. They love exploring these clickable, dynamic dashboards and coming up with their own insights.

Leaders or Doers?

Next, figure out whether your audience is mostly leaders or doers.

The leaders need an aggregated overview of the work, e.g., one dashboard for the state as a whole.

The doers need individualized, disaggregated data, e.g., one dashboard for their charter school x dozens of charter schools in the project.

If we give the leaders the disaggregated dashboards, we risk that they’ll get lost in the weeds.

And if we give the doers the aggregated dashboards, we risk that it’s not actionable enough for them to do anything about the data.

Audience First, Software Second

AFTER we narrow down our audience, then we can choose a software program.

Single static dashboards can be made in spreadsheet programs, like Excel, Sheets, or Numbers. We can sorta make them in infographics programs like Canva or Piktochart; those templates are meh but they’re getting better all the time.

Need a series of matching dashboards? Spreadsheet programs can handle those, too. I make one template in Excel and then automatically populate it with all the dozens of dashboards’ data. You can write VBA code, connect everything with drop-downs and lookup formulas, or use Slicers.

Have a technical audience? Interactive dashboards are possible in Excel (via Excel Tables, pivot tables, pivot charts, and slicers). Or, you can make them in dashboard programs like Tableau or PowerBI. Or, you can learn coding (e.g., R).

In the video, you’ll see real-life examples of these dashboards, too.

Download the Diagram

Want to download this diagram? Share it with your team, and discuss it together at the beginning of your next dashboard project. Let’s avoid those mismatches altogether.

Download the Diagram

Your Turn

Do you currently have any dashboards?

Who are they for? Non-technical or technical audiences? Busy people, or those with time available? Leaders or doers?

Written by cplysy · Categorized: depictdatastudio

Jan 31 2022

How to Plan for Your Next Dashboard [Lea Pica’s Present Beyond Measure Podcast]

You’ve been asked to make a dashboard—now what?!

Dashboard is a tricky term; it means different things to different people.

In this article, you’ll learn how to:

  • choose between various dashboard types (static or interactive, single or series); and
  • deal with common dashboard challenges.

Lea Pica’s Present Beyond Measure Podcast

I recently had the chance to be on the Present Beyond Measure podcast, hosted by Lea Pica.

Lea is a seasoned digital analytics practitioner, social media marketer and blogger with over 11 years of experience building search marketing and digital analytics practices for companies.

You can listen to all of Lea’s podcast episodes here.

What’s Inside

Here are some of the topics we talked about:

  • All about my journey into data viz and how I leveraged my skills.
  • The poll that I use to start the conversation around data dashboards!
  • Different perceptions of dashboards and the first steps for client conversations.
  • The four types of dashboards and the steps in the planning process.
  • The necessary software for dashboard creation and thoughts on the nuances between different programs.
  • Tips and tricks for streamlining your data extraction process.
  • Challenges that I have seen most often in the dashboard creation process.
  • Unpacking the discussion around layout and chart types and my personal approach.
  • My recommendation of an impactful book dealing with the power of text placement.
  • Why I’m so excited about progress in the field of dashboard creation.

Defining the Term “Dashboard”

I asked Lea to give her definition of a dashboard (hint: there’s a million correct answers!).

Lea said,

“My definition of a dashboard is a single view suite of data chart modules, or data form modules, that are designed to alert a lay audience to the most critical business key performance indicators, business metrics, in a way that they can either make very basic decisions on their own or alert them to ask the proper teams to investigate those chains further.”

Whoa! That’s one of the most sophisticated answers I’ve ever heard.

Different Perceptions of Dashboards

Dashboard software programs are relatively new.

If you’ve entered the field recently, you might associate “dashboards” with specific software programs, like Tableau or PowerBI.

In the past, “dashboards” meant static one-pagers, like a printout or a PDF. For example, you might prepare a one-page handout of key metrics that would be printed and discussed at a board meeting.

How to Plan Your Next Dashboard Project

On the podcast, Lea and I talked about how to plan for your next dashboard project.

Step 1: Define the Term “Dashboard”

First, recognize that each team member has a different idea of the term “dashboard.”

Some people might want to dive in and build a dynamic dashboard.

Others might be envisioning a one-page PDF, or even some slides to discuss at a meeting.

Step 2: Static or Interactive?

Second, talk about whether you need a static or interactive dashboard.

Static means you need a meeting handout or a one-pager of key facts and figures. You could share the one-pager as an email attachment or post it on a website.

Busy leaders don’t have the privilege of time, so providing a one-pager is a gift. It’s like saying, “I’ve already dug through all the messy data, here’s what I think are the key findings for you in this neat, tiny, little package.”

Interactive dashboards (or dynamic dashboards) have drop-down menus, checkboxes, and buttons.  

We’ve all seen and used these dashboards, either on our computers or in our phone apps.

But, sometimes people don’t need or want that much information.

Technical audiences will probably appreciate an interactive dashboard, but non-technical audiences might appreciate a one-pager.

In the podcast, you’ll hear Lea and I discuss the mismatches we see.

Technical people like using interactive dashboards, so we make interactive dashboards. We have to pause and remember that our audiences might be non-technical, and they might prefer a static one-pager.

Step 3: Single or Series?

Third, figure out whether you a single dashboard or lots and lots of matching dashboards.

For example, leaders at a state education agency might need an overview of all the schools, aggregated together.

Principals would benefit from seeing their own school’s data.

Within a single project, you might need a single dashboard (the overview for the state education agency) and a series of matching dashboards (one per school for each of the principals).

Step 4: Choose Your Software Program

Finally, choose your software program.

Audience decisions should come before software decisions.

I’m a big fan of everyday software, so I tend to make most of my dashboards in Microsoft Excel.

Excel, PowerPoint, and Word are the common language among all the groups I work with, and I think people are pleasantly surprised to see how much Excel can do.

Common Dashboard Challenges

In the podcast, Lea and I discussed common dashboard challenges.

Designing Your First Dashboard

Getting your first dashboard set up is the hardest part.

If you’ve got a dashboard, I’d love to give you five gold stars, seriously.

You might have needed to hire new staff, attend training, or spend hours fiddling with that first dashboard. Celebrate your wins, vizard.

Making Sure Your Dashboard Isn’t Too Dense

Then, we talked about some specific design challenges.

The biggest challenge I see is volume, or how much we try to include in a dashboard.

I see a lot of dashboards that look very full. They’ve got so many charts. They’re bursting at the seams.

If that happens in your project, take a time-out. Try to remember which one audience this dashboard is for.

It can’t be for your boss, board members, the public, fellow staff, and your peers.

Each of those groups is going to need different charts, so if you try to fit everyone’s information requests inside a single dashboard, it starts to overflow.

Pick your one audience, and then prioritize the data points that your one audience needs.

Use Familiar Bar Charts, or Variety?

Another common dashboard challenge is choosing the right chart type.

I come from a research background, so my go-to chart type is bar charts.

I have way too many bar charts. My drafts are bar, bar, bar, bar. As I edit, I add more variety.

There’s a delicate trade-off between adding variety and sticking with everyday charts, though.

In the podcast, you’ll hear Lea say that she sees a benefit in using everyday charts.

“People immediately understand what they’re supposed to understand from seeing those [familiar] charts. There’s no learning curve, there’s no training gap,” Lea explained.

In the podcast, you’ll also hear me talk about a recent client. Their dataset has three nested levels (i.e.., categories, subcategories, and sub-subcategories).

We brainstormed several options for their dashboard: a tree diagram, sunburst diagram, and Sankey diagram. Together, we weighed the pros and cons of each approach: What does it highlight? How easy is it for someone else to understand? Is this the pattern we really want to emphasize—or not?

But another consideration is time and software options. Is it worth the staff time to develop those charts for the dashboard? Or do we stick with the usual bar charts?

Book Recommendation: I Am a Book

In the podcast, you’ll hear Lea ask me whether I’ve read any good data or design books recently.

I mentioned I Am a Book. I Am a Portal to the Universe by Stefanie Posavec and Miriam Quick.

This book has my favorite text placement of all time. The Nobel Prize for text placement! It gave me permission to use huge fonts, diagonal fonts, and even circular fonts. What a masterpiece.

The Future of Data Storytelling

Finally, Lea and I talked about the future of data storytelling.

“I can’t wait until I can stop talking about some of the topics I’m talking about,” I said.

“Let’s re-record this in 10 years and our dashboard conversation, I cannot wait for that to be a different conversation.”

I can’t wait to stop saying that some interactive dashboards should actually be static.

I can’t wait to stop saying that non-technical and technical audiences have different dashboard preferences.

I can’t wait to stop saying that the leaders and the doers have different information needs.

Your Turn

What does the term “dashboard” mean to you? Every workplace has a slightly different definition.

What type of dashboard do you need for your project? Static or interactive? Single or series?

What are some of the most common dashboard challenges you’ve seen?

Connect with Lea Pica

Website: leapica.com

The Present Beyond Measure Podcast: leapica.com/podcast

LinkedIn: linkedin.com/in/leapica

Written by cplysy · Categorized: depictdatastudio

  • « Go to Previous Page
  • Go to page 1
  • Interim pages omitted …
  • Go to page 21
  • Go to page 22
  • Go to page 23
  • Go to page 24
  • Go to page 25
  • Interim pages omitted …
  • Go to page 37
  • Go to Next Page »

Footer

Follow our Work

The easiest way to stay connected to our work is to join our newsletter. You’ll get updates on projects, learn about new events, and hear stories from those evaluators whom the field continues to actively exclude and erase.

Get Updates

Want to take further action or join a pod? Click here to learn more.

Copyright © 2026 · The May 13 Group · Log in

en English
af Afrikaanssq Shqipam አማርኛar العربيةhy Հայերենaz Azərbaycan dilieu Euskarabe Беларуская моваbn বাংলাbs Bosanskibg Българскиca Catalàceb Cebuanony Chichewazh-CN 简体中文zh-TW 繁體中文co Corsuhr Hrvatskics Čeština‎da Dansknl Nederlandsen Englisheo Esperantoet Eestitl Filipinofi Suomifr Françaisfy Fryskgl Galegoka ქართულიde Deutschel Ελληνικάgu ગુજરાતીht Kreyol ayisyenha Harshen Hausahaw Ōlelo Hawaiʻiiw עִבְרִיתhi हिन्दीhmn Hmonghu Magyaris Íslenskaig Igboid Bahasa Indonesiaga Gaeilgeit Italianoja 日本語jw Basa Jawakn ಕನ್ನಡkk Қазақ тіліkm ភាសាខ្មែរko 한국어ku كوردی‎ky Кыргызчаlo ພາສາລາວla Latinlv Latviešu valodalt Lietuvių kalbalb Lëtzebuergeschmk Македонски јазикmg Malagasyms Bahasa Melayuml മലയാളംmt Maltesemi Te Reo Māorimr मराठीmn Монголmy ဗမာစာne नेपालीno Norsk bokmålps پښتوfa فارسیpl Polskipt Portuguêspa ਪੰਜਾਬੀro Românăru Русскийsm Samoangd Gàidhligsr Српски језикst Sesothosn Shonasd سنڌيsi සිංහලsk Slovenčinasl Slovenščinaso Afsoomaalies Españolsu Basa Sundasw Kiswahilisv Svenskatg Тоҷикӣta தமிழ்te తెలుగుth ไทยtr Türkçeuk Українськаur اردوuz O‘zbekchavi Tiếng Việtcy Cymraegxh isiXhosayi יידישyo Yorùbázu Zulu