• Skip to main content
  • Skip to footer
  • Home

The May 13 Group

the next day for evaluation

  • Get Involved
  • Our Work
  • About Us
You are here: Home / Archives for allblogs / depictdatastudio

depictdatastudio

Sep 22 2020

Ending Dusty Shelf Reports: Interview on James Pann’s YouTube Show

I recently had the opportunity to be a guest on James Pann’s YouTube show to talk about reports. James is an Associate Professor, program evaluator, and psychologist who specializes in evaluating health, human service, and educational programs. 

Watch Our Conversation 

Here’s a recap of our conversation:

My Introduction to Dusty Shelf Reports

I recently had my 7th year anniversary of working for myself. I started out as an evaluator and I always loved the data viz side of my job. Some people love doing logic models or lit reviews, me I love poring through spreadsheets trying to figure out the pattern.  

Early on in my career, I was throwing all my effort into a report, staying late, working on the weekends, doing whatever it took to do my best work. My boss sat me down and kindly said, “Ann, you’re a great team member and I’m so glad to have you. I’ve noticed you’re working really late on this evaluation report. It matters, sure, but I don’t want you to sacrifice your personal life for a dusty shelf report.”  

I’d never heard that term before and I instantly felt crushed, but also thinking, “there’s got to a better way- this can’t be the standard”.  

Reasons Evaluators Should Be Learning About Data Visualization and Reporting 

If you’re working in academia or are a student in grad school students, then you absolutely need to write academic reports. But if you go outside of academia, there are many other workplace settings that have their own standards. The bar is being raised so much (in a good way) in thinking beyond the report. Can we also have interactive dashboards? Infographics? Amazing things are being done.  

The tricky part is that none of us were trained for how you go from really technical reports in academic settings to non-technical reports, non-technical audiences and really quick turnaround times.  

Resources Someone Just Starting Out in Evaluation (and Others) Can Use to Get Proficient in Data Visualization 

For a student just getting started or if you’re new to the evaluation field, you can take one of my courses (hint, hint, nudge, nudge).  

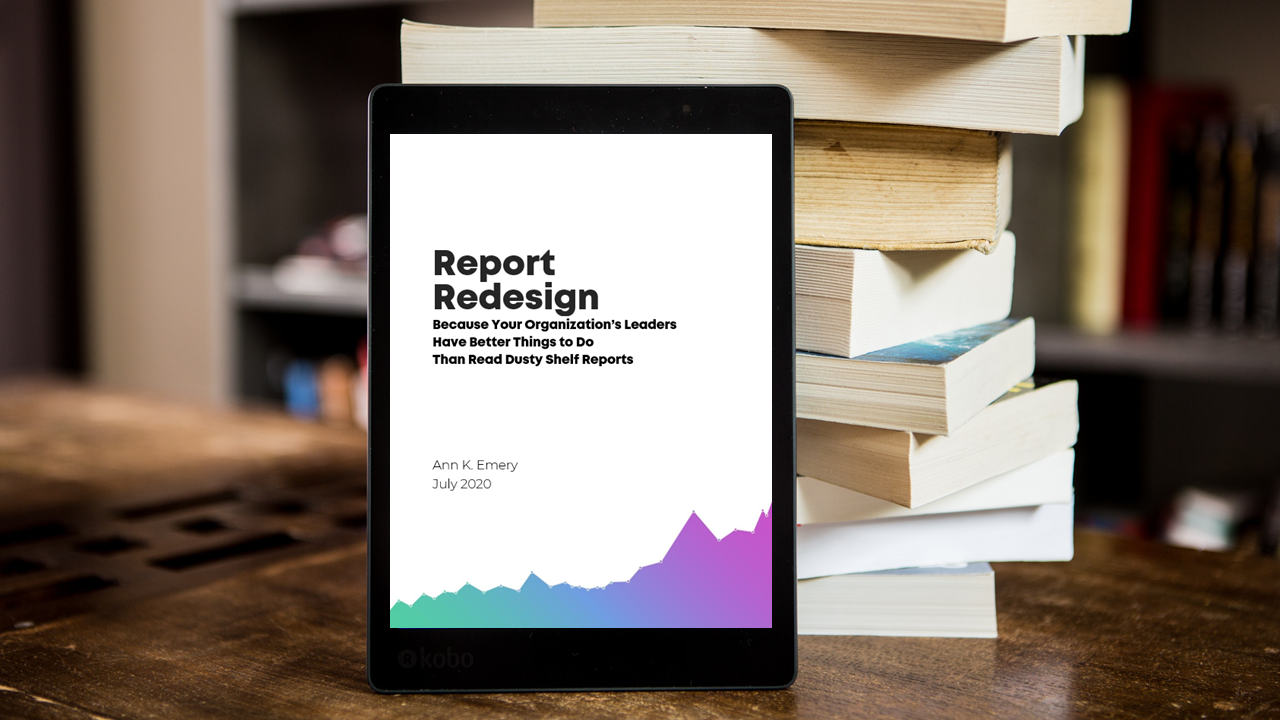
Soar Beyond the Dusty Shelf Report is our free mini-course where you’ll gain practical techniques that you can apply immediately to improve your visuals.

For reporting the best place to start would be to do a self-assessment. Ask yourself: what is the impact of your reports (if any).

There are four red flags to really look for with reports (or slideshows or dashboards, etc.). Look out for these: 

  1. No Response
    • No response at all after you send it out.
  2. Promise to Follow-Up Later
    • You get a response that says, “Thanks, I’ll let you know if I have any questions.”
  3. “Compliments”
    • You get a response that says, “Thanks, we can tell that a really technical team worked on this report. It’s very detailed and thorough.”
  4. Won’t Read It
    • They ask for another format entirely like a slideshow, one-pager, etc.

Creating a Dataviz Wall of Fame

One thing I did for myself early one that was so helpful was to create a data viz wall of fame. I used to look for examples of great graphs, dashboards, infographics, etc. and would print them out and plaster them on the wall above my desk.

Nowadays, you could have a Pinterest board, folder on your computer or favorite them on Twitter. Start by actively collecting examples that you love but then push yourself to the next level by thinking, “What’s the rubric for this? Why is it good- is it the writing, the type, etc.”. Once you can identify why it’s great, you can start to replicate it.  

There’s a lot of great podcasts out there too. The ones that come to mind are: 

  • Data Viz Today with Alli Torban 
  • Data Stories with Enrico Bertini and Moritz Stefaner 
  • Data + Love with Zack Bowders 
  • PolicyViz with Jon Schwabish 

Techniques for Engaging Project Stakeholders in the Reporting Process 

I co-authored an article on using Data Placemats, which is a technique you can use to engage project stakeholders in the reporting process.  

I want you to step away from the idea of waiting until the end of the project to give the completed report/slideshow and hope that it gets used. Instead there’s a three-step process you should follow: 

  1. Develop data placemats with preliminary findings- traditional format. 
    • Make a data placemat. Use Word or PowerPoint and lay out one graph per finding.  
  2. Meet with stakeholders and have them explain their findings in their own words; you’re a facilitator, not a lecturer. 
    • Hold a meeting with the stakeholders where you pose discussion questions and then sit back and listen. Walk them through how to walk through the data and have some of the ‘lightbulb’ moments themselves. 
  3. Write the final report- storytelling graphs- using their interpretations.  
    • Take all that data you collected from them and their insights and put that into the report.  

Easy Fixes for Reports

Here are the most common mistakes–and easy fixes–that I see.

Going Beyond the Report 

You only have a report. A report can’t meet every audiences’ need. You need one product per audience.  

Structure Your Report 

Not starting with the “So What?” The most important information is buried in the report. Put the “So What’ on the first page and get your audience in the game right away. Don’t risk losing your audience. 

Not following brand guidelines. Use your fonts and colors, especially think about using your recipients brand guidelines. It’ll take you about 10 minutes but shows that you’re willing to go the extra mile and it looks more professional.  

Design Each Page 

Not aiming for 1+ visual per page. I define visuals very broadly. You might use the logos of organizations, or include a timeline to show the numerous steps taken.  

Forgetting to lower the reading level. The average American reading level is 6th through 8th grade. Plug your text into a readability level checker and make sure your reading level matches your audience. Aim to be about two levels below your audience’s educational level. For example, if most of your audience members have completed Master’s degrees, then aim for two levels below that (high school).

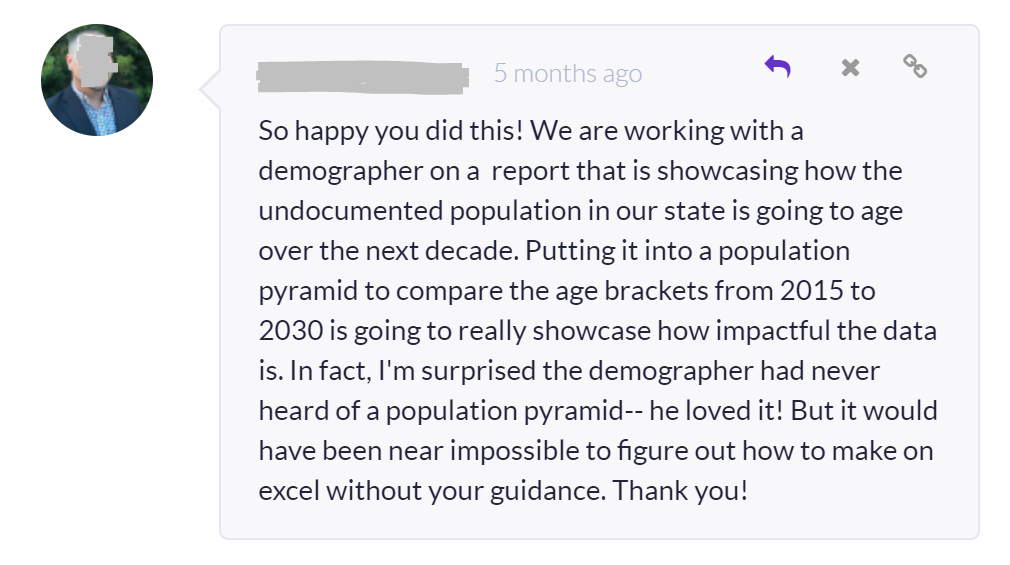
How to Obtain Feedback on Your Work 

When you blog and YouTube like I do where your work is front facing, people will tell you! I remember posting my first YouTube video and the first comment was from an anonymous person who wrote in all caps, saying they couldn’t hear anything over the clicking of my keyboard and said it was such terrible quality. I didn’t even know people used a microphone! I watched YouTube videos on mic and lighting comparisons to get to my setup now.  

I did a webinar a week or two ago and my phone number is on my website (I forward my business phone number to my cell phone). This guy called and said, “I paid for your webinar you did yesterday and I have one problem with it”. I instantly went into flight or fight mode wondering what he was going to say.  He went on to say how most presenters just read off a script but you didn’t, it was one of the best he’d seen. People will just call and will tell you very openly how they feel about your work so you have to have a poker face.  

Masterminds

I’m also in a few masterminds with some other business owners where we act as each other’s sounding boards and brain trusts. I’ll throw out ideas to them and they’ll flat out tell me that it’s not a great idea. It’s really helpful to have a peer group that you trust.  

Collect Feedback After Trainings and Courses

When I do trainings, I collect feedback forms or do an internet survey. In my larger projects, I build it in to have a debrief. They turn into problem solving for when hiccups may happen in the future. In shorter projects, I look for repeat clients or referrals. If I never hear from them again, that would worry me.  

At the end of my courses, student receive a course survey. I also have behind the scene data for course students that let me know how much of a course they’ve completed, how often they’re logging in, if they’re watching all of a video or not and more. I can see which videos people are re-watching or even which sections they’re re-watching which tells me where they’re getting stuck.  

Inspiration for Developing Blog Posts  

I usually write blog posts on questions that workshop or course participants are asking. If everybody is struggling on how do I make sure my colors are accessible, that’s a great blog post. I also do a lot of before/after makeovers which help people see all the little steps that can make a big difference. I try to show the behind the scenes thought process so that people can then replicate it in their work. 

More recently I’ve been doing interviews to try and get to know the people in data viz better and then I turn that interview into a blog post. 

Finding a topic that you personally care about is key. I don’t think blogging is supposed to feel like work. You could monetize your blog but it would take a lot to make a full time living from a blog, but it’s mostly a hobby and supposed to be fun. I love the idea of thinking about what’s interesting to you and what do you want to explore more. 

Book Recommendations

I have gifted all of my siblings-in-laws, Your Money or Your Life by Vicki Robin. She published it back in the 90s for the first time and just did a re-do a couple of years ago. It’s a financial book kind of, but it’s more about thinking about your life energy. You’re only alive for so long and you have a limited number of days, how can you make the best use of your time? It’s about trying to avoid just consuming things that give you temporary happiness, but thinking about how do you create for long-term, life satisfaction?  

My husband I listened to the audio version during a long car drive and kept pausing it to talk about the insights we were having. She says to not throw away your life in a job that’s only decent, you need to aim for a great job and set up. Or maybe you should stay home and be a parent. This is what inspired us to have my husband quit his job ad have our family join me on the road while I traveled teaching. This book clearly changed our life trajectory.  

Atomic Habits: An Easy & Proven Way to Build Good Habits & Break Bad Ones by James Clear is so actionable for everybody in every industry. I think everyone can learn something from it.  

James: Steve Kotler’s stuff on flow like the Rise of Superman: Decoding the Science of Ultimate Human Performance. Also, Bernardo Castro has a philosophy book on idealism vs materialism. It’s not some academic nonsense, but it’s very practical. I think he’s one of the most important writers right now.   

How to Structure Your Day/Week to Enhance Productivity 

That’s a tricky one because I think there’s perception that Ann Emery must wake up at 5 am, run 10 miles, then make a green smoothie and work, work, work until midnight. She never sleeps and must be miserable, clearly. In reality, I get a lot done but I also rest and have fun. I don’t see those as opposing dichotomous topics at all. 

I think you can have this wonderfully fulfilling personal life and achieve a lot professionally at the same time. I’m into minimalism in terms of thinking about what really matters in your work and personal life (which ideally are the same thing!). But really thinking about what matters and let go of everything else.  

My Husband is a Stay-At-Home Dad

My husband let go of his very good salaried job with a pension and top-secret security clearance. We let that go so we no longer have to do things like both waking up with alarm clocks, rushing the kids off to daycare, both working and then figuring out who makes dinner, etc. We now don’t set alarm clocks and get enough rest each day.  

We Bought a House with a Quiet Office

Now if I have to set an alarm, I think to myself, “My life is out of control! Why did I schedule something before 10 am?” We purposefully stopped fulltime travel due to COVID and so when house hunting in Florida, we were looking for a very specific home. We wanted a one level house with a bonus space I could use as an office. It’s my little retreat- I go to my office, get all my work done and then I go downstairs and go ‘home’.  

Be Smart About Scheduling

I used Calendly for scheduling meetings and I’m only available from Mondays at noon until Thursday. I don’t book anything on Monday morning, that’s a terrible way to start the week! And I don’t boo anything on Fridays, because if my brain is tired, I’m not going to be any good on a Zoom call. Fridays are usually a day for myself to write a blog post or record videos for online courses. It feels really good to end the week like that, doing something creative for yourself.  

Creator vs. Manager/Delegator

Identifying whether you’re a creator or more of a manager/delegator and making sure you’re not trying to go back and forth. Instead of trying to spend one hour writing a blog post (creating), then a 30-minute meeting about a project and then spend one more hour writing that blog post. I try to really separate it and have a half day of uninterrupted to do the actual, creative work. Then I try to book all my meetings, back to back at another time.  

Morning, Afternoon or Late-Night Person

I’ve listened to whole podcast episodes about being careful to know if you’re a morning, afternoon or late-night person. I used to be a late-night person and would do my best work at 9 pm-midnight. But now I’m a morning person so making sure that my mornings are my uninterrupted time. I rarely look at emails and instead am building courses and writing. In the afternoon, I take calls. You really need 100% of your brain energy for the creative work.  

James: I think it’s great to get good sleep, that’s probably the first and most important thing. Getting that honed in has been huge.  

And then being okay with taking breaks during the course of the day and actually building it in.  Making sure that you’re going through a cycle and not just powering through.  

Learn More 

Subscribe to James Pann’s YouTube show. 

Your Turn 

Comment below: Which reporting tips were new to you? Which tips are you going to put into practice? Have reporting tips of your own to share? 

Written by cplysy · Categorized: depictdatastudio

Sep 15 2020

Solopreneurship on the EvaluLand Podcast

In 2016, I met evaluator extraordinaire Dana Wanzer at a national conference. We’d originally connected on Twitter and this was our first-time meeting in person.

Side note: If you’re on the fence about joining social media… Social media can be the first step towards forging long-lasting friendships with colleagues. Go for it!

In addition to her career as an evaluator, and her busy teaching schedule as a professor, Dana recently launched the EvaluLand podcast.

On her podcast, we talked about my unexpected shift from being an evaluator to a data visualization designer, along with my tips getting started working for yourself or teaching online.

Watch Our Conversation

Listen to the Episode

Or, listen to the episode here: https://evaluland.fireside.fm/8

Ann’s Trajectory into Evaluation

Here’s a recap of what we discussed.

Dana: I’m curious how you transitioned from evaluation and research work into what you do now?

Ten years ago, it was a really big deal to do anything besides a technical report.

That was the norm (and in some work places, still is).

At a conferene, we stood up and said, “What if we have a technical report but we also have a one-pager for each of the 30 schools in this project? That way, each school can view their own data? And what if, instead of tediously copying and pasting from Excel to Word, we just write some VBA code to automate the process and save days of time?”

These concepts were groundbreaking at the time.

Fast forward a few more jobs, to when I worked with foundations. I would help train their nonprofits on evaluation, data collection, data analysis, and data visualization.

I remember thinking, “This is my favorite thing in the world! I like teaching more than I like writing the actual reports myself.”

I got to work on technical assistance projects about one day a week and realized I wanted to do that five days a week.

At the time, I was working and earning my master’s degree at night. Friends, family, and colleagues kept asking me, “What’s next for you, once your graduate?” I had no idea. I hadn’t intended on switching jobs. But people kept asking, so I kept thinking about it.

I remember telling my husband, “Someday, when we’re 65 and I retire, I’m going to do data viz training full-time!”

And he said to me, “But that’s decades away! You’re 28. That’s a long time to wait. You’re really going to put off your dreams for decades?”

And I thought, “I guess I should do this now. Why would I put my life on hold?”

I lready had a good job. It was risky to leave something good in hopes that it would lead to something great. I pulled the trigger, and seven years later, the rest is history.

Ann’s Career Shift: From Evaluator to Entrepreneur

Dana: I want to talk a little bit about how your career has shifted. What’s been the difference for you between entrepreneurship and independent consulting? How has that transition been for you?

My identity has certainly shifted over the years.

Way back, I started as a researcher who was going to do a Ph.D. program.

Then, I was an evaluator in salaried positions for a while.

Then, in my one of my first projects as an independent consultant, I was a one-woman evaluation team. At the time, it was perfectly feasible to work on the project all by myself.

My specialty, though, is data visualization. And there’s a huge demand for that. It got to a point where it didn’t make sense to turn down the data viz jobs that I’m passionate about. There was a natural transition where I began training evaluators on how to do data viz.

Then, a few years later, I shifted to, “I’m a data visualization designer.”

It was truly only a year ago that I shifted my thinking to, “I’m actually this ‘entrepreneur’ people talk about.”

I was in a book club of fellow data analysts who are self-employed. We’d read a book together every quarter. One time, we read Company of One by Paul Jarvis together. Paul talks about the value of staying small and nimble.

The measure of success used to be how many employees your business has. Paul presented new metrics of success:

  • How much time do you have with your family?
  • How profitable are you?
  • How many hours a day do you have to work?
  • Are you able to scale?
  • Are you just being paid by the hour? So if you take an hour off, you don’t get paid? Or do you have passive income coming in?

I was so persuaded by the idea that small is great.

My setup now is very lean. It’s me plus a 5 hour/week assistant. I did at one point have up to 10 subcontractors, where one person designed the icons, one person created the report cover, etc. I was trying to coordinate all of it while I was traveling around the world teaching workshops. I’d be waiting in line to board a day-long flight to another continent, trying to clumsily thumb-type instructions to contractors to keep the projects moving. It was just too many details and wasn’t any fun. I focus on trainings now not only because I love it, but also to save my sanity.

I don’t consider myself moonlighting. I’m not a consultant or a freelancer. Depict Data Studio is definitely a company with a clear structure, processes, automations, and regular passive income. I have a workflow where I do this, and then my assistant does this. And we try to avoid as much manual work as possible, letting the tech do the tedious tasks for us.

How to Start Online Courses

Dana: I’d like to talk about your online courses and how you got into them. What’s your number one tip for somebody interested in doing this? I’m personally struggling with this because I teach and my university brings in income through the students who I bring into the program. So, I’m not sure how I should/could do this personally.

A decade ago, I started teaching about data very informally at brown bags for fellow staff members in my company.

Word spread that Ann knows this Excel shortcut, and Ann can take a spreadsheet and turn it into a dashboard fairly seamlessly.

It came pretty naturally to me and I just assumed it did for everyone else too. How lucky am I that it doesn’t, because I’ll be employed for a while that way! 🙂

People started asking me for help. I started blogging around the same time, and making very informal YouTube videos as well. I simply started YouTubing to answer the questions I was getting. I kept getting the same questions over and over, and realized there were thing everyone was struggling with. I didn’t have time to answer everyone individually as I was taking graduate classes myself and had a very demanding job.

I would go home at the end of a long day and I would record a little 2- to 5- minute answer to their question, and then post the video on YouTube. I loved doing that and found it so gratifying to teach. It feels really good as a service to the community to help other people.

A few years later, Chris Lysy from Fresh Spectrum said to me, “Wow, you actually enjoy being on camera. Most people hate it. Why don’t you make an online course?” I pushed back that I already had blog posts and YouTube videos. The software didn’t quite exist yet that would allow me to turn disparate YouTube tutorials into a planned course, and I’d never seen this done before. Chris planted the idea, and I thought about it on and off for the next few years.

I went for it in Spring of 2018. I made a complimentary mini course using my favorite pre-existing YouTube videos I already had.

Then, I started making full-length paid courses. I was translating what I’ve already been doing with clients in-person to a virtual setting Not everybody is going to fly me out to teach all 30 of their staff. Some people are self-employed, some people are based in other countries, some companies have staff located in multiple offices, etc. There are so many benefits to offering courses online. Participants can learn whenever it’s convenient for their own schedule.

From there, it just grew and grew, and I now have six full-length courses (which are each the equivalent of a two-day workshop). I offer Office Hours where students can ask me questions. We hold live sessions with guest speakers. We’ve built ebooks, handouts, and checklists. There are opportunities to submit work and get feedback. And, the early birds even get Swag Bags with t-shirts and stickers as a treat for signing up early. It’s grown very slowly, intentionally but slowly.

That being said, although I have six full courses now, that’s not a realistic starting point for anybody. I recommend people start exactly how I did: Make a very short courses that’s 30 to 60 minutes long on a topic you’ve already presented about (e.g., at a conference or staff meeting). Start with the audience’s favorite presentation that people love every time. Or, start with your favorite presentation that you’re really excited about.

Take that 30- to 60-minute talk and record it. Not all in one video, of course! Maybe there are four lessons inside your talk. Turn that into four shorter videos. You could give it away for free if you’re trying to build your email list. Or, sell it.

Recycling Content

Dana: I know you always talk about recycling your content and I’m realizing I don’t do that very well. I’ve got this perfect demonstration I did at a conference in 2018 on how to survey children. There’s really not much out there and it was based on my thesis. People ate it up! That would be a perfect one to maybe build up more but it could be pretty ready to go. That actually really excites me, so thank you!

I bet your slides are 90% done and you remember 90% of your speaking points.

I bet you have clear breaks in your presentation by topics where you can record this 10 minutes, this 10 minutes and so on.

You can make it interactive just like you do a regular presentation. Not just “Does anyone have any questions?” at the end, but you can say “Comment below the video” or “Try it out and come back and reflect on this here.”

I bet you could transform that talk into a recorded course in half a day. You’ve already recorded yourself online (through your professor position in virtual school this semester), and you already know how to do podcasts. It’s going to be really easy for you to do this.

Chris Lysy taught me about recycling content. At a past conference presentation, he was saying, what a shame that we all fly to conferences. We spend all this time prepping our presentation. We have amazing learning for a couple of days. We then go home. Learning doesn’t have to stop! What if we also wrote a blog post with key takeaways from our presentation? At a bare minimum, write a blog post. But you could make a video course based on that conference presentation.

Sharing Resources and Expertise

Dana: I wish more people would blog, create podcasts, and share their resources. The reason I blog is to share all of this. It makes me sad when people feel like they need to hoard their information and never share out of fear. I want to learn something and share it. Why should everybody do the same work over and over again? Instead, you can take what I’ve done and make something more of it.

There’s definitely a misconception in the consulting space where, if you share your perfect expertise and knowledge in a blog post, other consultants will steal it. Or, nobody will hire you.

I’ve had the complete opposite experience.

The more tips I share online, the more business I get.

One person from a group’s team will be on my newsletter list, have followed my blog, or maybe seen me speak. They want everyone else on their team to benefit and learn from me. So, when it’s time to bring in a speaker, they naturally reach out to me. Then everybody on their team gets to benefit, and I get to keep a roof over my head. I have never lost business over anything I’ve shared online.

I also think that sharing knowledge leads to so much life satisfaction.

One of my favorite books of all time is Your Money or Your Life by Vicki Robin.

It’s a financial book, kind of. But it’s really about life purpose and making sure that the limited days you’re alive are spent really well, and that you’re making the world a better place. That you’re not just consuming and giving yourself temporary happiness by buying a new purse or going on vacation. But, instead, you’re giving yourself lasting satisfaction by creating rather than consuming. Vicki Robin talks about how the tippy-top of ultimate happiness is achieved by giving to others and being of service to others.

And that’s why I love teaching, too. Because you clearly see the impact that you have on helping other people out. And, you get to stay in business while you do it. It’s such a natural path for me. I highly recommend teaching online. But just start small.

Shifting from a Scarcity Mindset to an Abundance Mindset

I used to have the scarcity mindset where, if I don’t accept this project, even though it’s not a good fit, maybe the client will never want to work with me again.

But then I transformed very slowly into an abundance mindset. My thinking is, “There’s plenty of work to go around, and plenty of people to help. It’s not like if you help somebody else, your career goes down the toilet. It’s not that. It’s just that you have this amazing network of really talented, hardworking people around you that you get to collaborate with.”

Merging Personal and Professional Ann

I used to have Professional Ann and Personal Ann.

Professional Ann wore suits and heels to work, and worked by the White House. Sure, I talked to my co-workers, but I wasn’t sharing my life with them.

Here’s Professional Ann:

Meanwhile, here’s Personal Ann, a Wild Child riding her Harley in the Salt Flats during her fourth cross-country trip:

It was a weird tension. I realized that at some point in my life I’d have to merge them and be myself all the time.

I finally got the courage to do that and share many things about my life. I share 90% of how I’m feeling on my InstaStories and don’t filter myself. Deven Wisner asked me, “How do you decide to share online? What’s your strategy?” My answer was, “I don’t think about it.”

The tipping point for me was that I started getting emails from other women in data. These emails basically said, “I was on the fence about starting blogging/speaking/etc, but I saw you doing it and thought, ‘I can do it too!’”

For about a year, I honestly hated those messages. I never wanted to be known. I just wanted to share data. It wasn’t a goal to grow an audience.

I felt really reluctantly placed on a pedestal.

I didn’t want to be this role model for women in data. I didn’t ask for that. But here I am. So, I thought, “Well, okay, I owe it to them to be a leader and be a role model. And to not just show the great parts of working for yourself, but also the not-so-great parts.”

Dana: I wonder if the sharing more of the personal side helps to humanize you more so that people don’t put you on a pedestal. I certainly don’t want to be on a pedestal. And every person I’ve put on a pedestal has toppled.

If you need somebody good to follow on Instagram who’s at the top of her career game but also is so real, I’d suggest Farnoosh Torabi. She’s a finance expert with a NY Times Bestselling book. On her InstaStories, she’ll share what her life is like as she’s getting ready to be interviewed on national television. Her makeup turned out weird, or her kids are throwing a fit and crying on the floor. Farnoosh is this amazing, professional woman who has so much expertise, but she’s also a real person. It just makes me love her more. I’m learning not just about finance, but what it’s like behind the scenes. The more she shares, the more I admire her for being herself online.

Teaching in the Virtual World

Dana: What kind of tips do you have for those of us teaching in this virtual world now?

I think there’s this misconception that every video has to be perfect if it’s recorded.

And that to be professional means you have perfect posture. Or you sit very stiffly and not move at all.

Early on, my speaking points were perfect. I wouldn’t use any casual language like um, so, or hmmm. I sounded like a robot! Nobody wants to listen to a boring robot. We want to connect with real human beings.

How to Be Natural On Camera

I’m a fan on planning in bullet point form, but I don’t recommend reading off a script.

I have tried multiple approaches including:

  • “The show must go on.” You have one take! Keep recording even if you make a mistake. That’s what you’d sound like in-person, after all.
  • Starting and stopping and starting and stopping, and then editing the recording afterwards to make it “perfect.” This takes five times longer!

I highly recommend recording everything in a single take. It’s more like teaching live. And, you’ll sound more like a real person. Embrace the hiccups and just deal with whatever happens.

Teaching Data Viz Around the World

Dana: I would love to talk a little bit about travel because I know you did travel a lot before COVID-19 hit. How did you get into it? How you did you do it? How did this process work for you? How can others with this dream of traveling either for or outside of work do this as well?

This could be a whole other podcast! Here’s the 30-second answer. I’m starting year seven of my business, but in year one we decided to have kids. (I started working for myself, and a week later my husband turned 30, and said, “I’m ready to be a dad now!” And I said, “No!” We were high school sweethearts, so we’ve been together forever, and kids were never in the plan. I came around, and we’ve never regretted it.)

I had all these great data viz trainings that I was traveling for, but I also just wanted to be home for bath time.

I felt like I had to pick, am I going to quit my job or be a stay-at-home mom?

We thought, what if my husband quits his job, and we sold our house and our belongings? It felt very logical to us. The family came along and we traveled for this perfect year until COVID flipped everything upside down.

What is Something in Evaluation that is Giving You Life Right Now?

Dana: What is something in evaluation that is giving you life right now?

I’ve got two.

The first one is evaluators who were never into cultural competence or racial equity are getting into it now and really taking the topic seriously due to the Black Lives Matter movement. That’s so exciting for me to see all of those ‘Aha!’ moments going on for people to recognize that white people have been really privileged for a long time and it’s our responsibility to do something about it.

And the second one is that, ten years ago, when I gave a dashboard presentation at a national conference, I had suggested also creating a one-pager to accompany a technical report. It was groundbreaking at the time. Luckily, that’s not the case anymore. I see evaluators making slideshows, one-pagers, infographics, and dashboards, and thinking so carefully about what stakeholders can actually use to inform decisions and make better programs. It makes me really hopeful to think of what’s next in evaluation.

Resources

Dana: Do you have any resources that you’d like to share?

My resource recommendation is my mini course, Soar Beyond the Dusty Shelf Report. It’s really a mindset course to get you thinking about what impact, if any, are your reports having now. And it’s not just reports, but infographics, dashboards, slideshows, etc. In the course, I give examples of what’s possible with reports, and share some tried-and-true tips like the 30-3-1 approach.

Your Turn

Comment below: What surprised you about our conversation? Do you have additional questions about careers in evaluation or data visualization?

Written by cplysy · Categorized: depictdatastudio

Sep 08 2020

Public Speaking Tips for Researchers and Evaluators from Isaac Castillo

Remember that Excel Test? Where I walked into a job interview, was asked about my prior experience with data, and then—surprise!!—the Director gave me a timed test to assess my true skill level??? And I panicked. Heart pounding. Face flushed. Hands shaking as I rushed to finish the test as quickly as possible??

That was Isaac Castillo…

…a.k.a. an Outstanding Boss, Evaluator, and Public Speaking Extraordinaire.

I’m so happy he hired me a decade ago, and I’m even happier that we’ve stayed in touch over the years.

Haven’t met Isaac yet? Isaac Castillo is the Director of Outcomes, Assessment and Learning at Venture Philanthropy Partners.  He has 20+ years of experience with research, evaluation and measurement. 

Today, the tables have turned. I got to interview Isaac!

Watch Our Conversation

During this 5-minute interview, we talked about Isaac’s career trajectory and his best public speaking advice for researchers, evaluators, and data analysts.

Prepare Half as Much Content as You Think You Need

Although Isaac has spent two decades working in research and evaluation, he started his career as a competitive debater and public speaking coach.

I asked Isaac for his #1 piece of public speaking advice.

Isaac advised us to prepare half as much content as we think we need.

For example, if you’ve been asked to speak for a half hour, prepare for 15 minutes worth of speaking.

We Always Need More Time Than We Think

Why does this work?

First, we often don’t have a good sense of how long it takes to deliver our content, or how long our speaking styles result in the content being delivered. We always take more time to present our information than we think we do.

When Isaac was speaking in high school and college, he struggled giving timed speeches. It’s taken more than a thousand presentations for Isaac to get a good sense of pacing and how fast he can go. Most of us haven’t given a thousand presentations, so we haven’t had enough practice fine-tuning our timing yet. Isaac says we’re always going to take more time than we think.

We Don’t Want to Seem Rushed

Often times, we accidentally put our most important content at the very end.

Then, when we get to the meaty content, we’ll look at the clock, realize we have 3 minutes left, and then try and wrap it up and rush through it.

If we prepare half as much content as you need, we can take your time. We can go off on some tangents as they feel appropriate. We can answer questions throughout our presentation. We won’t feel rushed.

We Can Focus Better on the Most Important Content

Preparing half as much content as we think we need forces us to really focus on the most important content. Which points do we want to drive home?

It also forces you to get rid of content that isn’t central to the points we’re trying to deliver.

It used to be hard for me to cut content from my presentation. Deleting slides forever felt too permanent. What if I wanted to share those topics in a future presentation? Mentally, I remind myself that those points aren’t gone forever. I’m just saving them for a future presentation.

Leave Our Audience Wanting More

Isaac’s friend is a Beatles fan, and she gave him great advice.

The Beatles intentionally wrote short songs to leave us wanting more, so Isaac has internalized that as well.

Give Enough to Pique Interest

Finally, Isaac said that if we give enough information to pique interest, then our audience will ask questions and want to follow-up with us.

Connect with Isaac Castillo

Connect with Isaac:

  • Twitter: @Isaac_Outcomes
  • LinkedIn: Linkedin/in/IsaacDCastillo

Written by cplysy · Categorized: depictdatastudio

Sep 01 2020

How to Avoid Annoying PowerPoint Habits: Interview with Dave Paradi, Microsoft MVP

Dave Paradi is one of my favorite people in the presentation design world. He is a Microsoft MVP, has been a professional speaker since 1999, and has authored 9 books and over 100 articles on PowerPoint. His focus is on helping business professionals create clear visuals of financial data. ​

I interviewed Dave about his current work, what it’s like to be a Microsoft MVP, and his presentation tips.

What’s Inside: Dave’s Career Trajectory

  • Dave says, “I deliver customized training sessions both in person and virtual and in those sessions I focus on 1) creating effective Excel charts and 2) effective PowerPoint presentations. It’s very corporate, business focused.”
  • How long Dave has been training others.
  • How he uses his own mistakes to train others. Dave told me, “I’ve been doing this for 21 years so I have made most of the mistakes in both a workshop as well as in running a business. That’s what I hope to share with my audiences, because when they say ‘What do you do when this happens?’ chances are I’ve made that mistake before.”
  • How Dave got his start in mutual funds and ended up giving a presentation series that changed his career trajectory.
  • How Dave and Ann connected. Dave said, “I’d noticed you first on Twitter and seen some of the stuff you were doing earlier on. And when you decided to go out on your own, I’d reached out and said ‘Hey Ann, would you like to have a conversation? I can share some of the stuff I messed up on and hopefully you won’t have to.’ One of the things I really appreciated when I got started was to learn from those who’d gone before. To learn the real-world information about what you should or should not do and should consider and I try to pay it forward.”
  • How Dave pays it forward to those younger or starting out. Dave said, “What mistakes have you made in an area of your life that you could pass on to somebody who is younger or starting out in the area? Help them, because it helps all of us.”

Dave’s Experience as a Microsoft MVP

I also asked Dave about his experience as a Microsoft MVP.

“We get to interface with the development team,” Dave explained.

“We just had a summit where we get to hear about what they’re working on, they get our advice, our input, things that they like and things they should change. I can’t tell you what they’re working on, but I can tell you that they’re constantly working on great, new features in Excel and PowerPoint.”

Dave Paradi is a Microsoft MVP.

You can learn more about Microsoft’s MVP program here: https://mvp.microsoft.com/en-us/

Dave’s Presentation Advice

“The advice I want to give is not actually from me. I survey audiences about what they think the presentation should be so I want to share what they’ve told me,” Dave said.

You can read the results of the 2019 Annoying PowerPoint Survey here: https://www.thinkoutsidetheslide.com/free-resources/latest-annoying-powerpoint-survey-results/

According to a 2019 Annoying PowerPoint Survey, 78% of people see 2 or more PowerPoint presentations each week.

“[The] survey says that people are creating and watching more presentations than before. In fact, 72 percent of the people said that they see two or more presentations every single week.”

“It’s not about you, it’s not about your data, it’s not about how much work you did. It’s about what does this audience need to know for them to make the decisions they need to make?”

Dave’s Top PowerPoint Mistakes to Avoid

“I asked the audience members, ‘Tell me what you want us as presenters to do differently.’ The one thing they want us to know more than anything else is they’re asking us, ‘Please, make it about us, the audience.”

Here are some of the key findings from Dave’s 2019 Annoying PowerPoint survey:

According to a 2019 Annoying PowerPoint Survey, 64% of attendees do not like it when the speaker reads their slides to the audience.

They want the presentation to be focused on them, this audience.

They don’t want information overload.

They want our visuals to be clear. A headline that summarizes the message, a visual that illustrates that message and don’t put your speaker notes on your slide. Use the Speaker Notes area in PowerPoint.

Audiences do not like it when presenters stumble through the presentation. They want us to rehearse and not read the slides.

Connect with Dave Paradi

Connect with Dave:

  • Dave’s website: http://www.thinkoutsidetheslide.com
  • Dave’s presentation survey: https://www.thinkoutsidetheslide.com/free-resources/
  • YouTube: youtube.com/user/thinkoutsidetheslide
  • LinkedIn: linkedin.com/in/DaveParadi

Written by cplysy · Categorized: depictdatastudio

Aug 18 2020

How to Design Reports that Actually Inform Decisions

I used to write hundred-page reports… I was trained to write lengthy reports filled with statistical jargon. Important information sat around and gathered dust.

Now, I design reports that people actually want to read. Fewer paragraphs. More graphs. My audience can understand the information, so the data actually gets used.

Ann K. Emery will teach you how to write engaging reports.

Reports aren’t supposed to feel daunting.

We’ll walk through my Report Redesign Pyramid, a step-by-step process that you can apply to your own projects.

You’ll learn how to:

  • match your dissemination format’s complexity to your audience;
  • follow the 30-3-1 approach;
  • design a one-pager with my seven ingredients;
  • set up your Theme Colors and Fonts inside Word;
  • use landscape for on-screen reading;
  • add a 20-minute cover;
  • visually chunk content with dividers;
  • apply a text hierarchy;
  • start with the “so what?;”
  • aim for 1+ visual per page;
  • add 15+ styles of visuals using my checklist;
  • go beyond the bar chart;
  • lower the reading grade level of your writing; and
  • tell a story through dark-light contrast and takeaway text.

What’s included in this training program?

I’m going to transform you into the report-redesigning hero that your organization needs. Here’s what’s included to make that happen.

  • 30+ video lessons that you can watch anytime (the equivalent of my two-day Report Redesign workshop)
  • Step-by-step process to transform Dusty Shelf Reports into reports that actually inform decisions
  • 2 Office Hours sessions every month to talk about your projects and hear from guest speakers
  • 6 additional Live Trainings just for participants in this program
  • 60-page Report Redesign ebook with our checklists and case studies
  • Discussion boards to ask questions and post your own work
  • Private Facebook community of fellow participants
  • Weekly emails to cheer you on
  • Lifetime access so you don’t feel rushed
  • Examples from a variety of industries (public health, juvenile justice, museums, and more)
  • Behind-the-scenes Word and PowerPoint magic tricks guaranteed to make your jaw drop

Who This Training is For

This training IS for those of us who work on reports and one-pagers ourselves. This course is NOT for supervisors who delegate all their report production to someone else. (Supervisors, enroll your staff. Ask me about group rates.)

This training IS for people using everyday software like Excel, Word, and PowerPoint. This course is NOT for graphic designers who exclusively use Adobe Illustrator or Acrobat.

30+ Video Lessons

You’ll get instant access to 30+ lessons–the equivalent of a two-day training. You can watch these lessons anytime around your own schedule.

Office Hours Twice a Month

We’ll even provide feedback on your projects. You’ll get instant access to recorded lessons that you can watch anytime and two live Office Hours sessions every month to get targeted feedback on your reports.

Guest Speakers in Office Hours

Sometimes we invite guest experts to speak with us during Office Hours. You’ll be able to access recordings from our sessions with Elizabeth Grim (about Connecticut’s COVID-19 response), Ione Farrar (about Tennessee’s COVID-19 response), Brenna Butler (about user experience), Chris Lysy (about using data for social action), and Sara Vaca (about visualization qualitative data).

By Popular Demand! 6 Live Sessions

Office Hours are open to everyone who’s taking online courses with me. By popular demand, we’ll also hold six additional Live Trainings just for the participants in this course.

  1. Tuesday, August 25, 2020 from 4 – 5 pm EST: Orientation Session & Self-Assessment
  2. Tuesday, September 29, 2020 from 4 – 5 pm EST: Emily Mills, author of The Art of Visual Notetaking
  3. Tuesday, October 27, 2020 from 4 – 5 pm EST: Kathleen Oh, breathwork session
  4. Tuesday, November 24, 2020 from 4 – 5 pm EST: Redesigning your reports together (first 5 participants to register will be eligible to have their reports used as case studies)
  5. Tuesday, December 29, 2020 from 4 – 5 pm EST: Redesigning your reports together (first 5 participants to register will be eligible to have their reports used as case studies)
  6. Tuesday, January 26, 2020 from 4 – 5 pm EST: Graduation Party

The sessions will be recorded in case you can’t make it live.

60-Page Report Redesign Ebook

You’ll get a license to download our 60-page ebook, which contains our 7 Ingredients for Designing One-Pagers, Checklist of 15+ Ideas for Visuals, and additional reporting case studies. This ebook is only available for participants in the Report Redesign full course and is not available anywhere else.

Discussion Boards to Ask Questions

Every module includes discussion boards where you can ask questions, comment on the lessons, and share your own tips with the community.

Private Facebook Community of Fellow Participants

You’ll be invited to join our private Facebook community, where I offer additional Facebook Lives. You can also post your own questions and get feedback from me and from your colleagues.

Weekly Emails to Cheer You On

I know you’re going to skip straight to the juicy reporting magic tricks, but I’m going to email you on Mondays around 11 am EST and pretend like we’re working through the course one module at a time.

Once-a-Year Registration

Mark your calendars! This course only opens once a year for registration. The 2020 enrollment window is Monday, August 17th through Friday, August 21st. When it’s open, it’s open. When it’s closed, it’s closed.

We’ve also got special Early Bird Bonuses for the earliest registrants.

First 25 People

The first 25 people to register will receive a Swag Bag with a dataviz shirt, stickers, buttons, and magnets.

First 10 People

The first 10 people to register will ALSO receive verbal feedback on their graph, report, dashboard, or infographic. I’ll spend 15-20 minutes talking through everything you’re already doing well, and then give you a couple priority areas to focus on the next time you design a report like this. The feedback will be recorded and posted as a case study inside the course.

First 5 People

The first 5 people to register will ALSO receive a report makeover. You’ll send me your report. Then, I’ll work on it directly for ~30 minutes during one of the Live Trainings with the 2020 cohort. This is a great opportunity to have me consult on your project.

3,620+ participants from around the globe

have already taken the leap into better reports, slideshows, dashboards, and infographics by participating in our online courses.

Your Instructor

Ann K. EmeryAnn K. Emery

Each year, I lead dozens of in-person workshops for thousands of people. My online courses bring those skills to you, too.

Depict Data Studio also consults to the United Nations, State Department, and Centers for Disease Control, plus dozens more foundations, nonprofits, film companies, banks, hospitals, and universities worldwide.

Your data deserves to be out in the world–actionable, talked about, used–not gathering dust in spreadsheets.

What does an online course look like inside?

I talk with you like a real person, not a monotone robot reading off a boring script.

What Participants Are Saying

“Before this course, I was visualizing data in all the wrong ways. We had such compelling data, but it wasn’t telling a story– it wasn’t coming alive. Ann’s course really helped me transform my data and reports. I utilize the skills from this course every day— when developing reports and papers, doing dashboards for my team, and presentations. I have begun to develop a reputation within my department, as well as from other departments, for making compelling reports and having a knack for data visualization. In turn, I always recommend this course. This course has even helped me become better at data analytics and even data collection and survey writing, because you can better visualize the data that you want to see. The course has been an amazing resource, and the fact that you have access to it indefinitely is astounding. If you’re on the fence, take the leap! It’s worth it!”

– Padraic Stanley, Program Coordinator, Rush University Medical Center

Frequently Asked Questions

How long do I have access to the course?

Indefinitely. I used to limit access to just 12 months. I wanted to encourage you to get in here and learn with me, but instead it just stressed you out, so I’m not cutting off your access anymore.

Can’t I just find this information on the internet or in books?!

No. I’ve given workshops and webinars on Report Redesign, but you won’t find these techniques in books, blogs, or on YouTube anywhere.

I know you’re a perfectionist and always update your courses.

Yes, and you’ll receive all future updates to this course.

What if I am unhappy with the course?

Contact us in the first 30 days and we will give you a no-questions-asked full refund.

Register by Friday, August 21, 2020

  • $747 USD one-time purchase
  • 3 payments of $249
  • 6 payments of $125

See you in the course!

— Ann K. Emery

Written by cplysy · Categorized: depictdatastudio

  • « Go to Previous Page
  • Go to page 1
  • Interim pages omitted …
  • Go to page 31
  • Go to page 32
  • Go to page 33
  • Go to page 34
  • Go to page 35
  • Interim pages omitted …
  • Go to page 37
  • Go to Next Page »

Footer

Follow our Work

The easiest way to stay connected to our work is to join our newsletter. You’ll get updates on projects, learn about new events, and hear stories from those evaluators whom the field continues to actively exclude and erase.

Get Updates

Want to take further action or join a pod? Click here to learn more.

Copyright © 2026 · The May 13 Group · Log in

en English
af Afrikaanssq Shqipam አማርኛar العربيةhy Հայերենaz Azərbaycan dilieu Euskarabe Беларуская моваbn বাংলাbs Bosanskibg Българскиca Catalàceb Cebuanony Chichewazh-CN 简体中文zh-TW 繁體中文co Corsuhr Hrvatskics Čeština‎da Dansknl Nederlandsen Englisheo Esperantoet Eestitl Filipinofi Suomifr Françaisfy Fryskgl Galegoka ქართულიde Deutschel Ελληνικάgu ગુજરાતીht Kreyol ayisyenha Harshen Hausahaw Ōlelo Hawaiʻiiw עִבְרִיתhi हिन्दीhmn Hmonghu Magyaris Íslenskaig Igboid Bahasa Indonesiaga Gaeilgeit Italianoja 日本語jw Basa Jawakn ಕನ್ನಡkk Қазақ тіліkm ភាសាខ្មែរko 한국어ku كوردی‎ky Кыргызчаlo ພາສາລາວla Latinlv Latviešu valodalt Lietuvių kalbalb Lëtzebuergeschmk Македонски јазикmg Malagasyms Bahasa Melayuml മലയാളംmt Maltesemi Te Reo Māorimr मराठीmn Монголmy ဗမာစာne नेपालीno Norsk bokmålps پښتوfa فارسیpl Polskipt Portuguêspa ਪੰਜਾਬੀro Românăru Русскийsm Samoangd Gàidhligsr Српски језикst Sesothosn Shonasd سنڌيsi සිංහලsk Slovenčinasl Slovenščinaso Afsoomaalies Españolsu Basa Sundasw Kiswahilisv Svenskatg Тоҷикӣta தமிழ்te తెలుగుth ไทยtr Türkçeuk Українськаur اردوuz O‘zbekchavi Tiếng Việtcy Cymraegxh isiXhosayi יידישyo Yorùbázu Zulu