• Skip to main content
  • Skip to footer
  • Home

The May 13 Group

the next day for evaluation

  • Get Involved
  • Our Work
  • About Us
You are here: Home / Archives for allblogs / depictdatastudio

depictdatastudio

Nov 10 2020

Designing Visual Appendices for Your Next Report—In Under an Hour

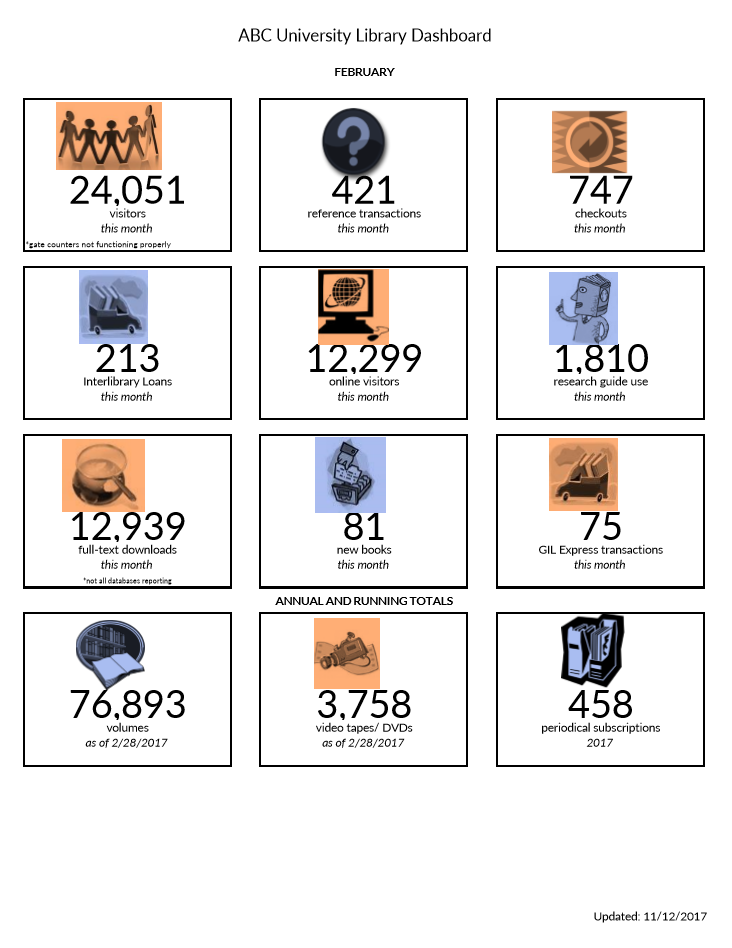
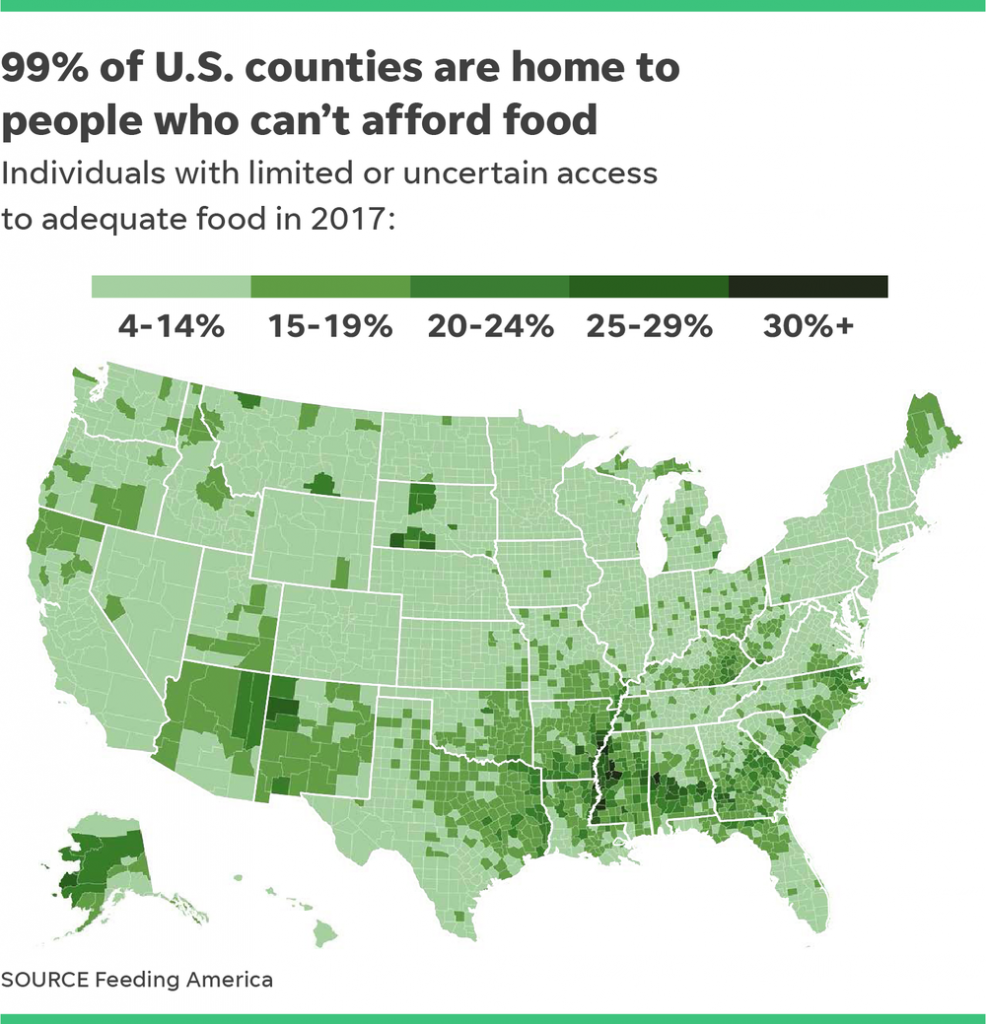
A couple years ago, I worked on this report:

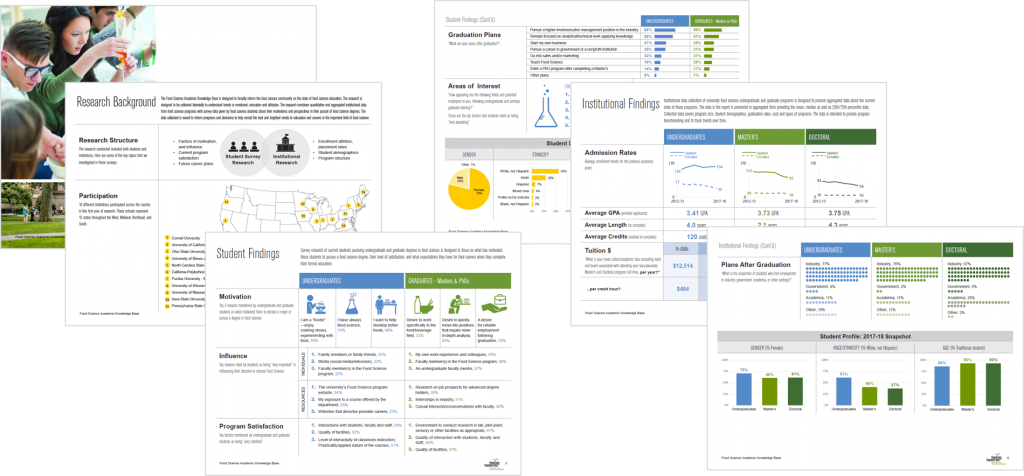
This report summarized survey responses from both universities and their students. Even with hundreds of survey responses and dozens of survey questions, we kept the report’s body to just six pages!

How’d we choose which findings to include in the report’s main body?!

That can be a daunting task. But it doesn’t have to be.

It’s much easier to pare down our report’s content when we’ve got appendices to back us up.

We don’t have to worry about forgetting any important details, since readers can simply flip to the back to learn more.

We get to be transparent by showing all the data (in the appendices) without overwhelming our busy readers (by trying to shove everything into the body of the report).

This particular report was six pages long plus 33 pages of appendices!

What Can—and Should—Be Included in Appendices

Here’s everything that can be removed from the report’s main body and pushed to the appendix:

  • Question-by-question survey responses (i.e., tables and tables of closed-ended and open-ended survey data)
  • Data collection instruments (e.g., an empty copy of the questions from the survey)
  • Transcripts from qualitative data collection (like focus groups or interviews)
  • Meeting minutes or other official documents we might’ve referenced quickly within the body of the report
  • Anything that would put our non-technical audiences to sleep
  • Anything that’s not central to the key takeaway message from the report
  • Anything we feel like we should include just in case
  • Anything that one person who asks lots of questions might need to know about
  • Patterns over time (e.g., our report’s main body could focus on this year’s data, but we might include tables that compare this year’s data to last year’s data in the appendix)

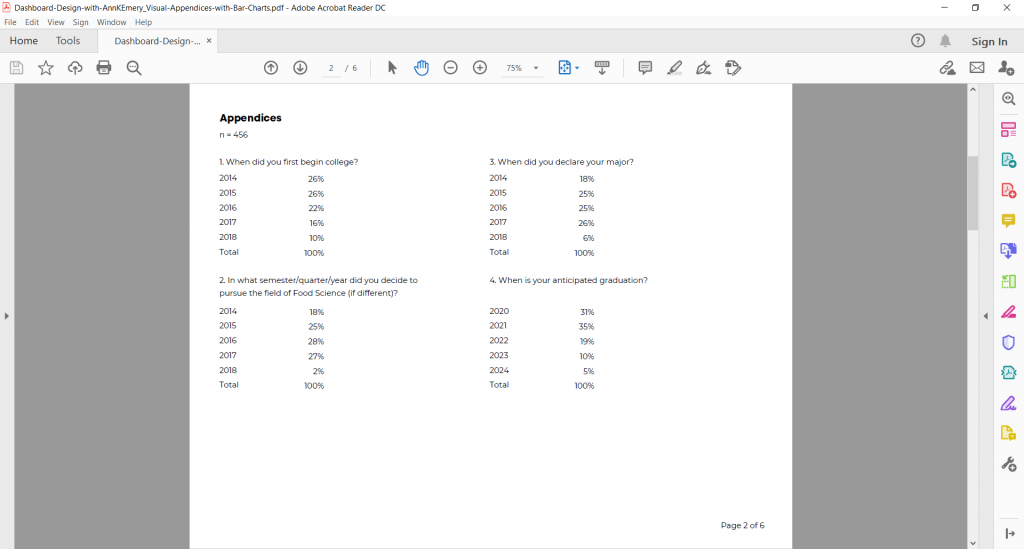
What Appendices Typically Look Like

Here’s what tables in the back of reports typically look like: Tiny font sizes, cluttered tables, and no visuals to help readers spot the key patterns.

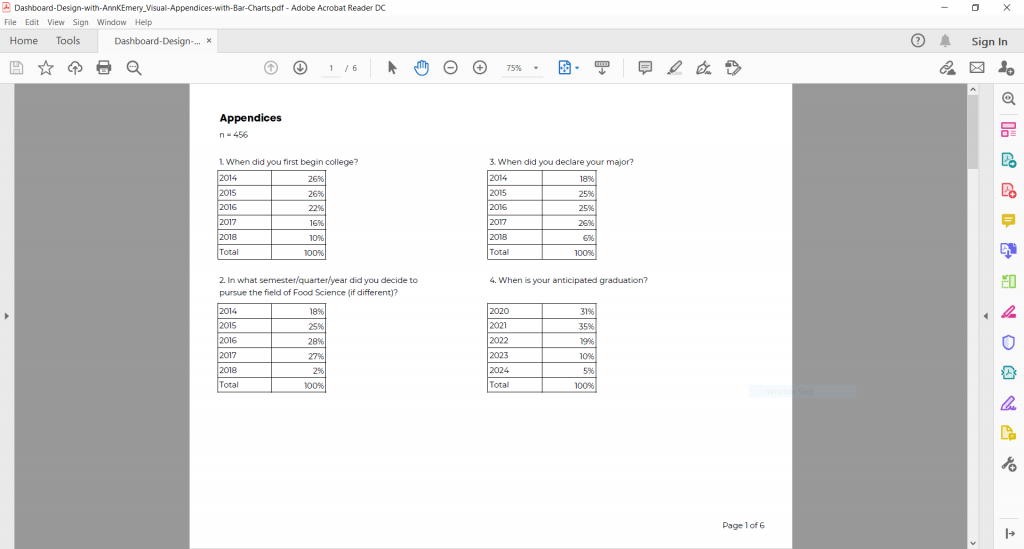
But what if I told you our appendices could get even better than that—in under an hour??

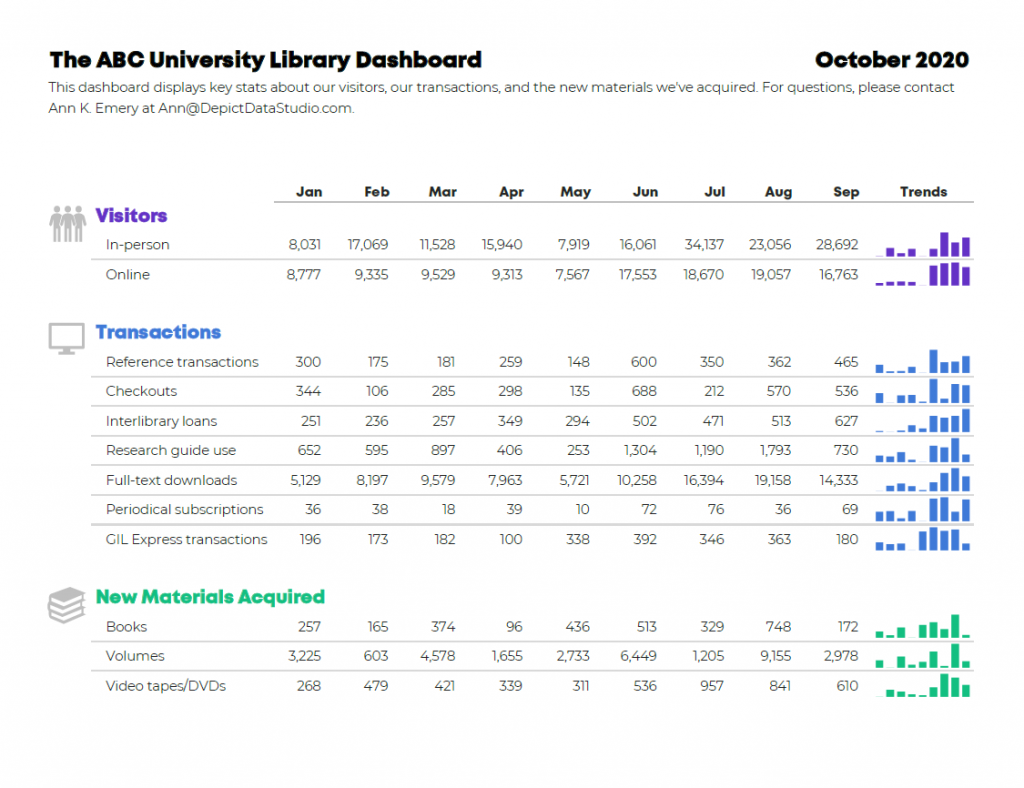
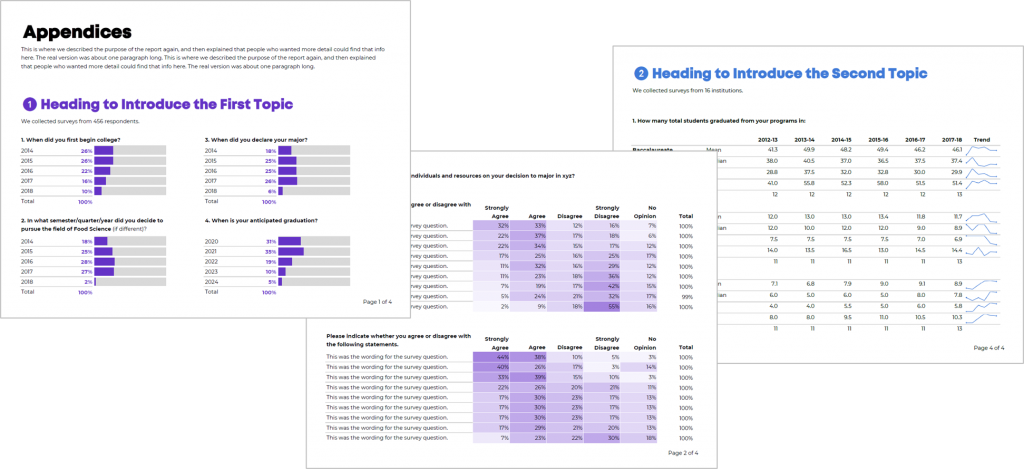
Introducing… Visual Appendices!

Here’s my wish for your next report: Visual appendices!

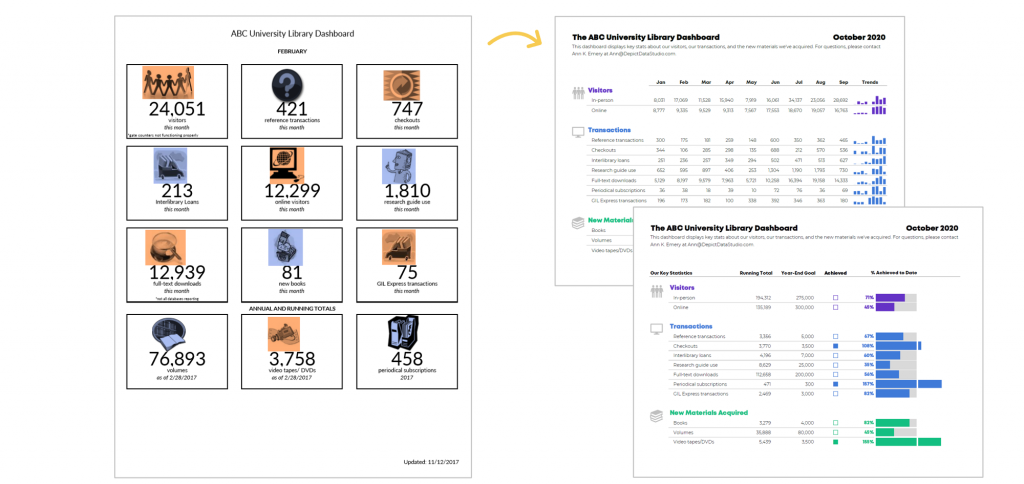
5 Easy Edits to Appendices

Let’s start with those original appendices that I showed you a moment ago…

First, declutter the existing tables. Remove all the unnecessary borders and lines.

Oops! Too bare. Don’t worry, we’ll continue editing in the next step.

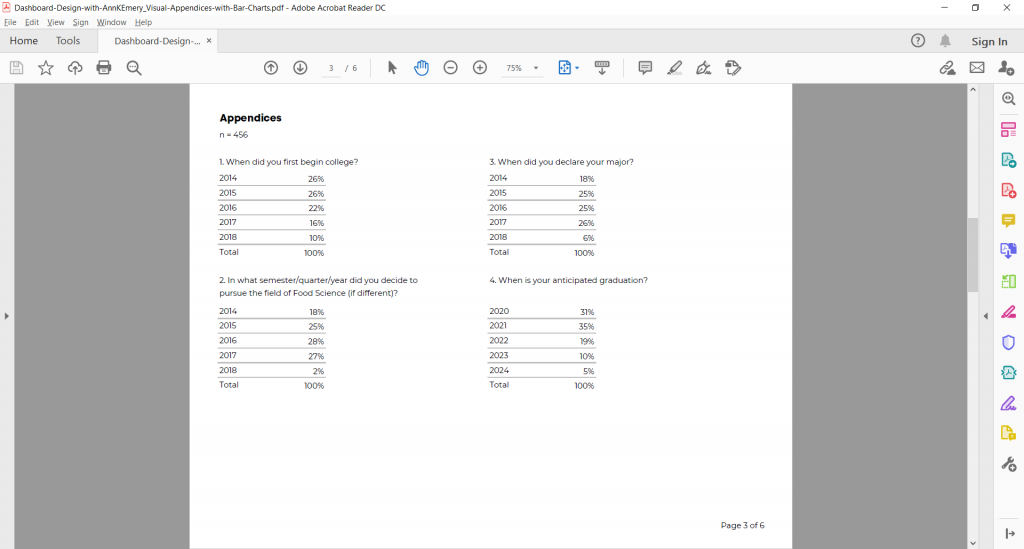
Second, I re-add the horizontal lines in gray rather than in black. Light gray horizontal lines ensure that our viewers can still read across the rows without distracting from the data by adding lots of dark ink.

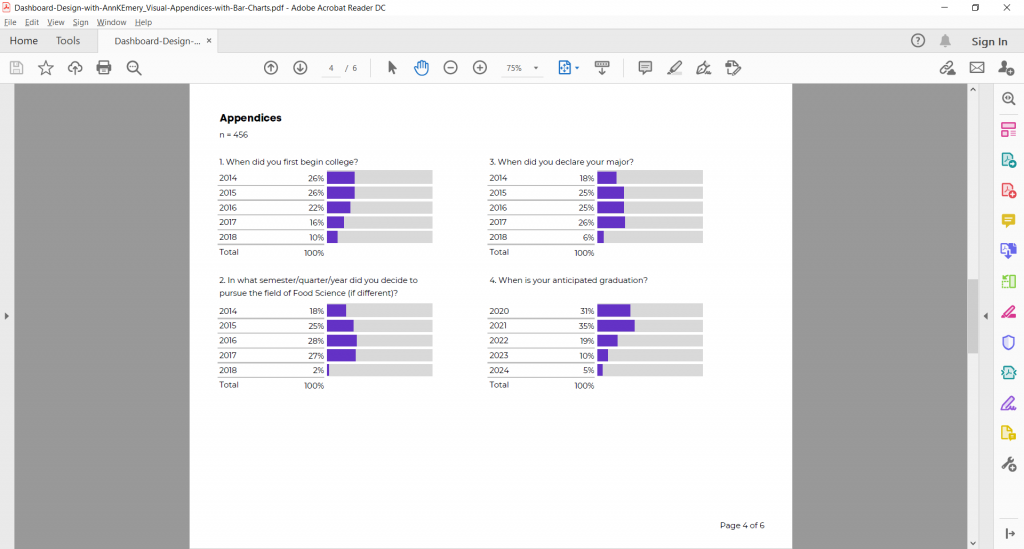
Third, add visuals! This is the most fun part.

Fourth, apply a text hierarchy. A text hierarchy means our title is going to be the largest, boldest, darkest text on the page (followed by Heading 1s, 2s, and 3s).  

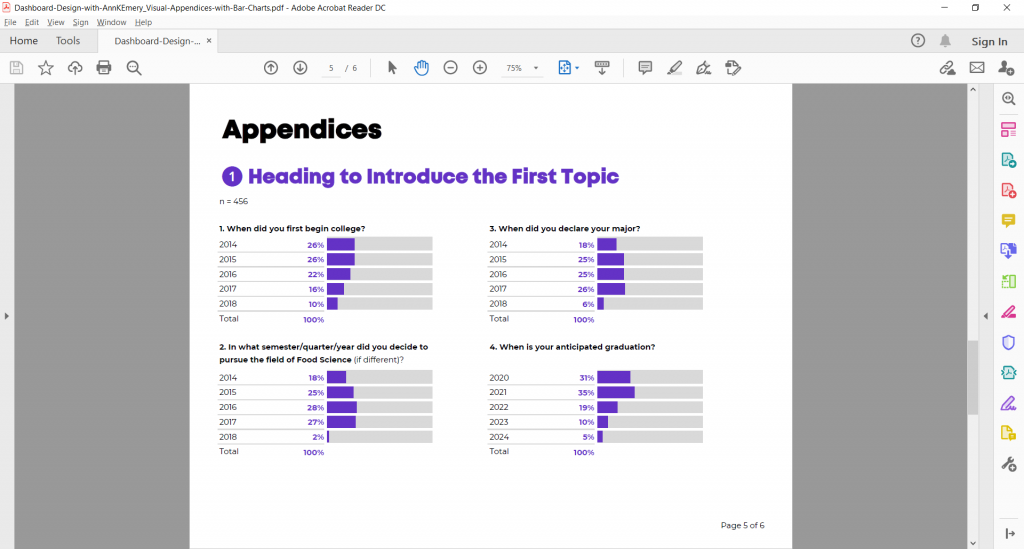
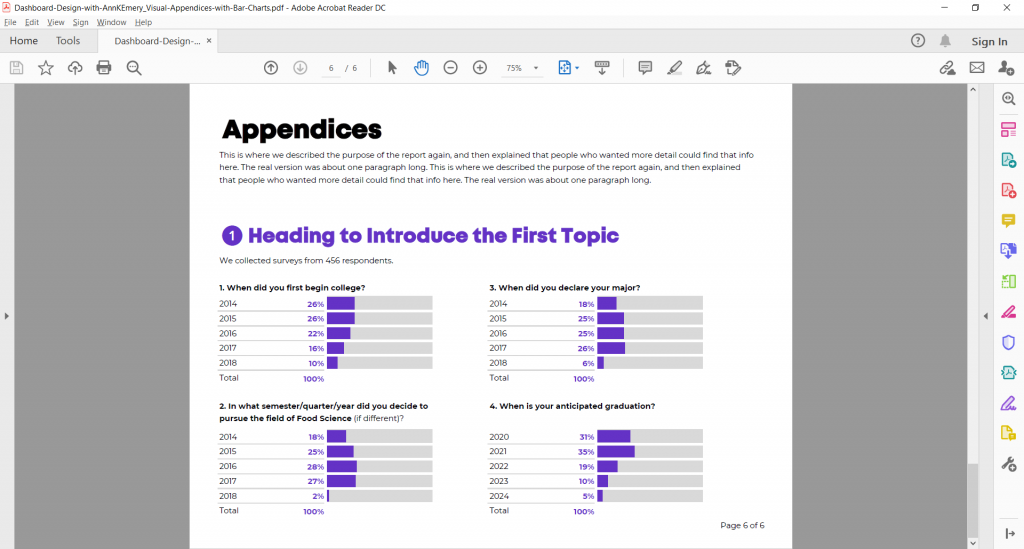
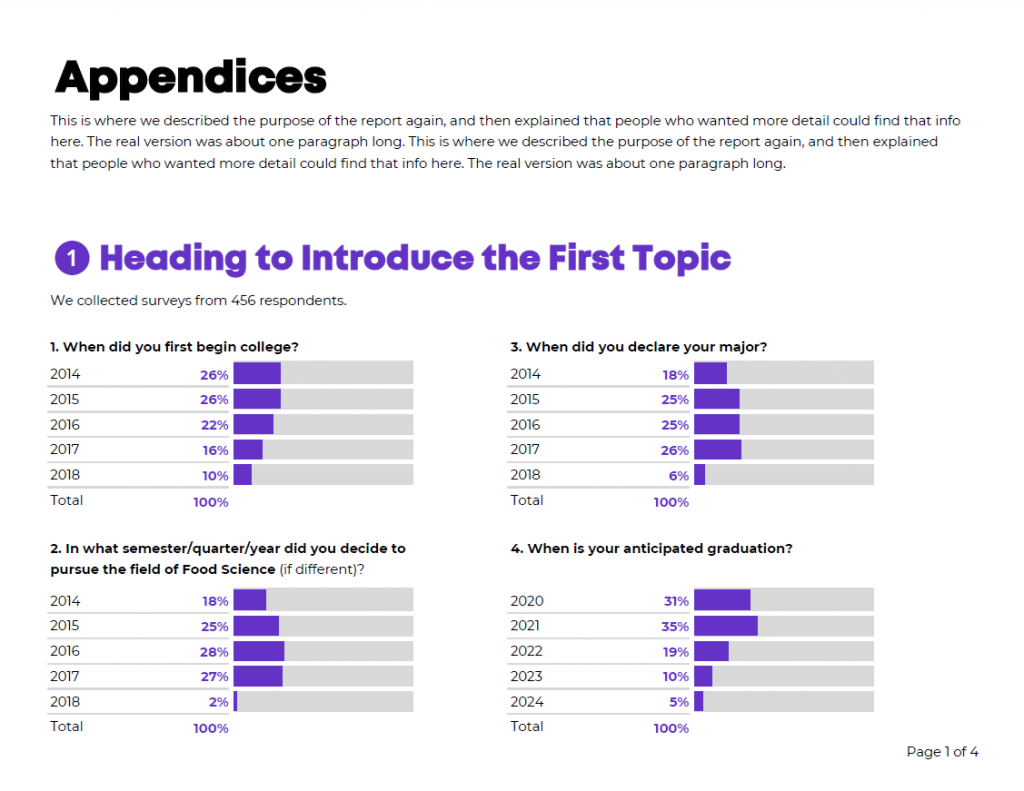
Fifth, add some plain-language text. In this fictional example, I’ve added a short introductory section. I’ve also changed the n=456 jargon into a friendly sentence: “We collected data from 456 respondents.”

3 Quick Visuals to Include in Appendices

There are plenty of quick visuals that we can include in our appendices. Here are a few of my favorite styles.

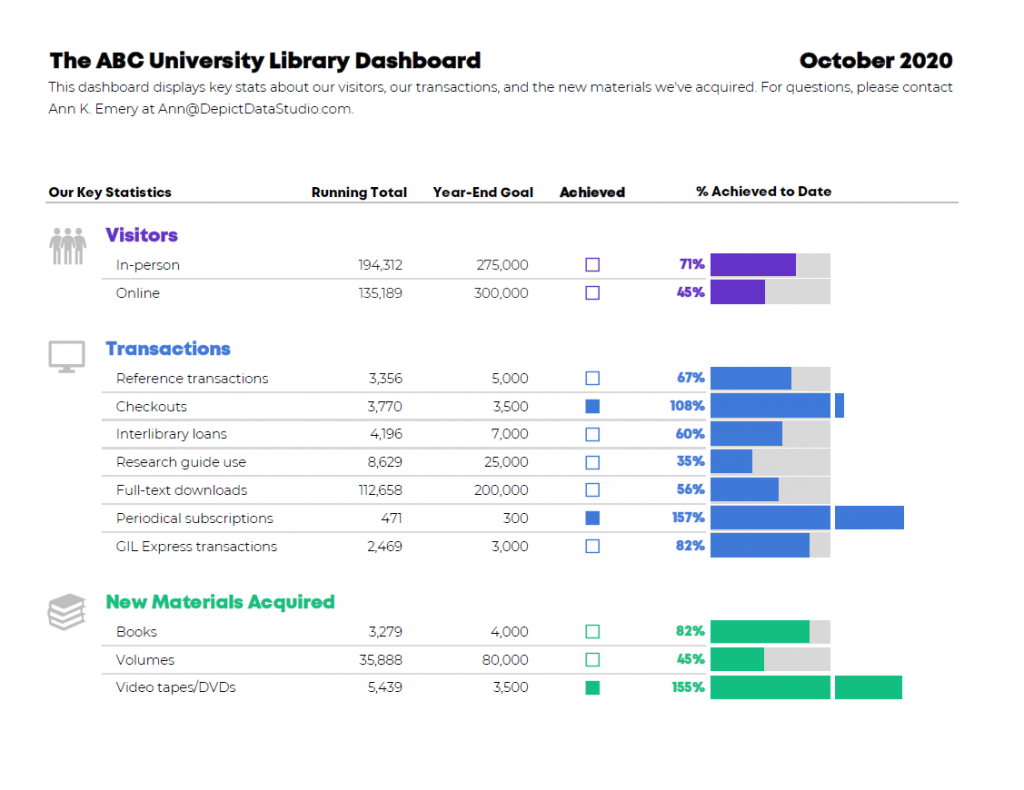
Bar Charts (or Stacked Bar Charts)

I showed you this approach already. We can build bar charts or stacked bars to visualize how many (“frequencies”).

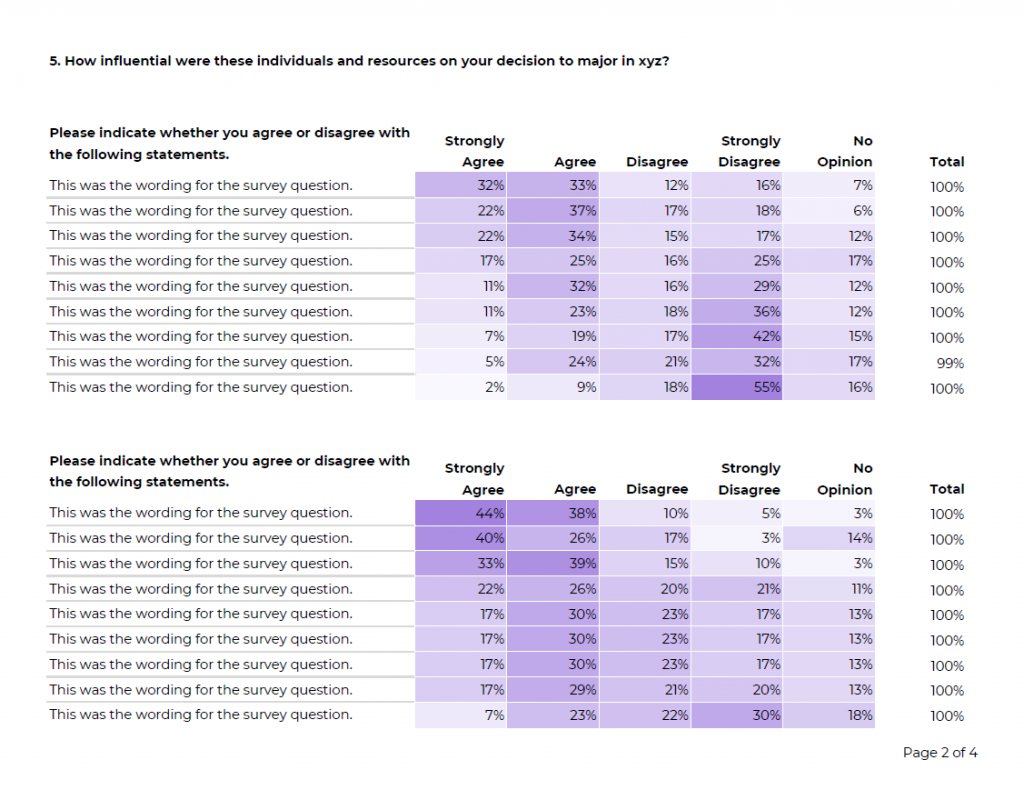
Heat Tables (or Any Type of Color-Coded Cells)

I love creating heat tables to help readers spot the highs and lows in the dataset. Heat tables are more helpful than bar charts when our tables have several rows and columns (like these fictional tables below, which have seven columns each).

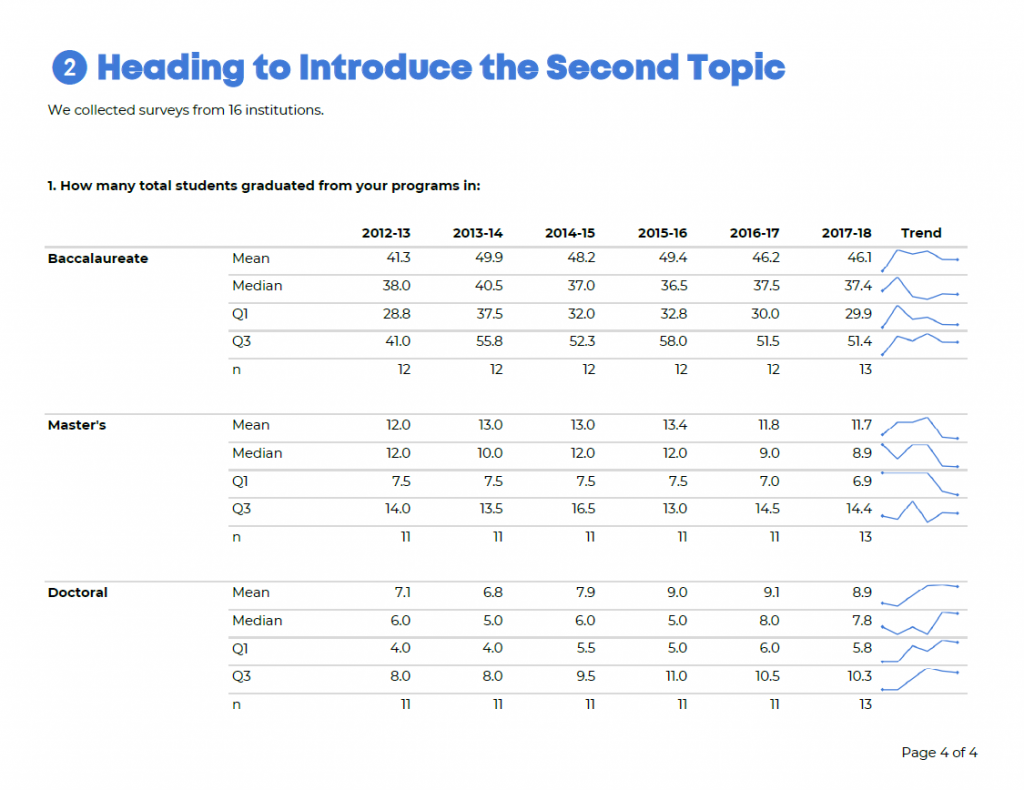
Trend Lines (or Vertical Columns)

Finally, I love creating trend lines (or, vertical columns) to show patterns over time. In this fictional example, we’re comparing how the patterns shifted between the 2012-13 academic year and the 2017-18 academic year.

The next time you’re adding appendices to your report, add visual appendices!

Bonus: Learn How to Make Visual Appendices

I’m leading a live 60-minute training on visual appendices as part of the Dashboard Design Full Course, which opens for once-a-year enrollment the week of November 16-20, 2020. Learn more.

Written by cplysy · Categorized: depictdatastudio

Oct 27 2020

Listening to What Data Users *Say* They Need… but Giving Them What They *Actually* Need

I recently had the chance to talk with Zach Bowders on his podcast, Data + Love. Zach is a data analyst, a Tableau Public Ambassador, and passionate about data visualization and data storytelling.

We sat down at night after our kids were in bed (8 pm for Zach and 9 pm for Ann!) and talked about how to distinguish between IT and data professionals, how to narrow what users *actually* need, understanding your audience and how to speak up when data isn’t useful.

Watch Our Conversation

Listen to the Podcast

Prefer to listen? Download the episode here. 

Distinguishing between IT Professionals and Data Professionals

We discussed an idea Zach brought up in a previous podcast: The difference between a traditional IT role and a data professional.

Those working in the traditional IT role typically receive instructions or a request. Let’s pretend they’re being asked to make a dashboard. Sometimes it’s a specific request with lots of planning, and you can tell the person making the request really thought things through. They might’ve even requested a specific chart type, like “Make a bar chart about xyz topic.”

Those working as a data professional also might receive those requests. The value-add of the data professional is that you’re supposed to push back a little bit. Professionally and respectfully, of course. You read between the lines of what’s requested and then give them what they actually want and need. The value you can add is to ask more questions and dig deeper. You might ask what the data’s going to be used for and what types of actions will be taken based on that data.

Zach added, “A data professional is not more skilled than the IT worker. It’s not to say one is better than the other, just that they’re different roles.”

“You could easily put together something that is technically correct and absolutely worthless,” he explained.

Designing Three Dataviz Ideas to Narrow Down What Users Actually Need

Here’s what I recommend:

  • You listen to the request for data. You’re listening, you’re nodding, not interrupting, asking clarifying questions.
  • You come up with three ideas. I call these “ideas,” not “makeovers.”
  • Idea #1: The original.
  • Idea #2: Slightly different.
  • Idea #3: Very different. (This is usually the winner, and what people actually need).  

For example, I recently worked I worked with a transportation agency. Their original graph was a pie chart with seven or eight slices representing their revenue sources. It was 3D, had a separate legend, and used tiny font… All of the usual challenges.

Here are the ideas I presented to them:

  • Idea #1: An easier-to-read pie chart. We developed a pie chart with one dark slice and the rest grayed out. We also used direct labels in lieu of the separate legend.
  • Idea #2: A bar chart to make it easier to compare each revenue source.
  • Idea #3: An icon array focusing on how one-third of their revenue comes from ticket sales.

Understanding Who Your Audience Is

Zach and I both agreed that understanding your audience is paramount.

“One of the things I find most important in terms constructing a data viz is your understanding of who the audience is – who is this for?” Zach said. “Because if you don’t know who it’s for, it has to be for everyone. And if it’s for everyone, it’s really for no one. It’s impossible to satisfy all audiences, to bridge all gaps.”

Zach said that people been pictorially expressing ideas for a very long time and that a big part of the process of taking something visual and explaining it to someone is the idea of closure. He explained that, “In the sense that in everything you create, there’s a silent partner that you have (a second creator) which is the audience. So, when you’re constructing your visualization, you and the audience are both pouring meaning into it. You’re not always going to be able to stand next to it, hold their hand and explain exactly what it means.”

He went on to share an example about a grocery store aisle with two-liter bottles. You can see part of the image on each one but you can’t quite see what they are. But it’s enough from your life experience to put together, “Oh! It’s a row of Pepsi logos.” You don’t see a single complete logo, but you can take the incomplete thoughts and knowledge of grocery stores to figure out what it is.

Zach said that this is true of when you’re working on a data visualization project. The people at the organization you’re working with have an understanding of their organization and their data, but also in terms of visual language in general. 

He said that the better you can understand their level of literacy, confidence, and competence with the data, the better you can leverage their own creative ability that they’re bringing to it to figure out what you don’t need to say.

“Part of it is, what you need to bring to it. And the other part is, what can you leave out?” said Zach. “If you’re working on some geographic data and people are wanting to know what sales look like for the United States, what’s the real question they’re asking? Do they really want to see all 50 states? They may, and that may be valid, but if they’re really wanting to see the winners to losers, you may be able to get away with two bar charts showing the top five and bottom five states. That might be exactly what they need. The temptation would be to show all 50 states. They don’t need that. They know there’s 50 states. You don’t have to remind them of that. For the most part, you can leverage many of those ideas as use them as a silent partner to help you get your ideas across better.”

Technical vs. Non-Technical Audiences

One of the most important things to understand about your audience, is not just their titles or roles but whether your audience is technical or non-technical.

A technical audience is people who love data and want to dig deeper into it (both inside and outside of work). They love decimal points and tables. Data isn’t a chore for them. In my experience, this is about 1% of the population.

About 99% of the world is likely non-technical. They don’t like data, find it to be a chore, and would rather do something else. They’re very smart, highly educated, and hard-working, but they have a skill other than data.

If you can identify which you are and which your audience is, you can then recognize when there might be a difference. This helps you determine the right chart type and the right dissemination format. Whether your audience is technical or non-technical informs all design decisions.

Connect with Zach Bowders

Data + Love Podcast: https://www.buzzsprout.com/739517

Twitter: @ZachBowders

Written by cplysy · Categorized: depictdatastudio

Oct 20 2020

Re-envisioning a University’s Monthly Report: Two Reports with Two Different Purposes

A million years ago, I was invited to be the keynote speaker for the Southeastern Library Assessment Conference in Atlanta, Georgia. As part of that process, we redesigned several of their existing reports and dashboards.

Before

When asked to submit their existing visualizations to be redesigned, one of the conference attendees sent me this dashboard (shown below).

Image of a University Library Dashboard sheet that shows facts about the library.

The attendee was responsible for monitoring key statistics
about the university’s library.

The dashboard included information about the number of
visitors, transactions, checkouts, and interlibrary loans.

These twelve metrics and their associated icons were intended to provide an at-a-glance overview about the library during a given month.

What’s Working Well: Length, Icons, and Text Size Hierarchy

A few things were already working well for this dashboard:

  • The most notable accomplishment was that it already fit on one page! I typically see “dashboards” that drone on for way too many pages. I’m not an old school dashboard designer. I don’t believe that dashboards have to fit on a single page or screen. But sometimes the multi-page dashboards also contain so much narrative text that they’re more of a report than a dashboard.
  • The icons were also working well. Michelle Borkin and her team found that icons make graphs more memorable, so I add or keep icons whenever I can.
  • Finally, the dashboard already incorporated a text size hierarchy of sorts. A hierarchy means that the most important information should be large, dark, and bold so that it grabs our attention. The twelve big numbers are already stood out, which was a plus.

What Needs Editing: Clutter, Alignment, and Context

There are a couple easy edits:

  • We’re going to do the usual decluttering for
    this dashboard. That’s a given, right? We’ll simply remove the borders that
    outline each of the twelve data points.
  • We also need to adjust the alignment. The numbers and words are centered within their boxes. Yet
    the icons aren’t quite centered over them. Intentional alignment makes our visualizations
    look polished.
  • The biggest edit needed is context. The dashboard
    currently shows February’s numbers. For example, 24,051 people visited the
    university’s library during February alone. I have no idea if that’s a huge
    number or a tiny number. A single number on its own doesn’t tell us much. We
    need more context. We need to be able to compare that number to something. There are a few comparisons
    we could make. For example, we could compare that number to the prior month
    (January vs. February). Or, we could compare that number to our goal
    (February’s actual number compared to February’s goal).  

After: Monitor Patterns Over Time

Here’s the first idea for this university’s monthly
dashboard.

These are made-up numbers, but hopefully you still
understand the gist of the makeover.

I:

  • gave viewers the opportunity to monitor patterns over time. Each month has its own column. Now, we can compare the current month to past months, which adds much-needed context.
  • added graphs, which I created with Microsoft Excel’s spark columns.
  • decluttered the dashboard by removing unnecessary outlines. I chose to keep the single horizontal line beneath the months, but that line is gray, not black.
  • color-coded by category. I grouped the twelve data points into categories: Visitors (blue), Transactions (purple), and New Materials Acquired (turquoise).
  • applied a text hierarchy. The title is large, dark, and bold. The headings (Visitors, Transactions, and New Materials Acquired) are a medium size because they’re of medium importance.
  • adjusted the alignment. The words are left-aligned and the numbers are right-aligned. The icons are center-aligned with one another, and they’re top-aligned beside each of their categories.

After: Track Progress Towards Goals  

Here’s the second idea.

It’s also clutter-free; includes graphs and a text
hierarchy; and groups the twelve data points into categories (which are
color-coded, of course).

The difference is the dashboard’s purpose. The before version only looked at one month
at a time. To provide more contextual details, the first makeover allowed
viewers to compare patterns over time.
This second makeover allows viewers to track
progress towards goals
.

I included columns for Running Totals and Year-End Goals. Then, I indicated whether the goal was achieved with filled-in squares and empty squares. I taught you how to create these square icons in an earlier post. They’re just lowercase g’s and c’s in the Webdings font!

Finally, I visualized the percentage of the goal that had been achieved so far. I call these progress bars. In some areas, the library has already exceeded their goal, so the bars spill past the 100% mark—a cause for celebration!

The Winning Idea

Which dashboard is correct?! Both of them!

Two dashboards, two different purposes.

I recommend designing several options for your viewers. Ask which one they prefer. Gathering feedback is one of the most important steps of the design process.

Bonus! Download the Spreadsheets

These are Microsoft Excel files, which are then distributed
to viewers as static PDFs.

(I rarely make interactive dashboards with drop-down menus
or checkboxes anymore. Leaders are busy and simply don’t have the time to
explore interactive dashboards. I’ve found that the busier the audience, the
more they prefer receiving a PDF’d one-pager.)

You can download my file and adapt the templates however you’d like for your own metrics and numbers.

Download the Excel File

Bonus! Learn the How-To Steps

Looking for detailed how-to instructions? Dashboard Design: The Full Course opens for once-a-year registration in November 2020.

Written by cplysy · Categorized: depictdatastudio

Oct 13 2020

Customizing Reports for the Audience with Deven Wisner

When should we follow APA format? When should we not? Earlier this year I sat down with my good friend Deven Wisner about customizing reports for the audience.

Watch Our Conversation 

During this six-minute conversation, we talked about Deven’s current work (he’s a managing partner, professor and student himself!) as well as the advice he gives to his own students.  

His Current Data Work 

Deven is a managing partner at Viable Insights in Tucson, Arizona. “I primarily work with organizations to increase their capacity for using data, but really, more importantly,  get them excited about using data,” he says.  

Teaching & Completing a Doctoral Program  

I asked Deven what his advice would be for students who have to do different styles of writing in reports.  

He said that a lot of what he shares is understanding the context of what they’re writing and what is most appropriate for their audience.  

Tailoring Your Writing Style to Your Audience

Deven said that when you think about APA or academic journal writing, you need to understand that it has a distinct value. Understanding why you need to use AP style, for example, helps you to understand when that isn’t the right format.  

He said that by building that understanding, it allows you to toggle in and out of that more strict, less conversational way of talking about data and findings.  

Connect with Deven Wisner 

Connect with Deven Wisner:

  • Website: ViableInsights.com 
  • Twitter: @DevenWisner or @ViableInsights 
  • Instagram: @DevenWisner 

Written by cplysy · Categorized: depictdatastudio

Oct 06 2020

What’s Missing from Your Organization’s Social Media Posts?

Today’s article comes from Amelia Kohm, the founder of Data Viz for Nonprofits. Thanks for these practical dataviz tips, Amelia! — Ann

What’s missing? Charts, maps, graphs and other data visualizations. When I peruse posts from organizations and businesses, I mostly see:

  • Grainy, low-resolution photos, 
  • Oddly-cropped photos that accidentally cut off important parts of the images once they’re transferred to social media posts,
  • Headshots,
  • Stock images (only some of which clearly relate to the text), or
  • No image at all.

Twitter, Facebook, and LinkedIn are like crowded highways packed with billboards. If we add charts, maps, and graphs to our billboards, we can both grab attention and say something meaningful. But the image and message should be simple and clear to travelers zooming by. 

What types of vizes work best? Here are four to consider.

1. Maps

Map of the United States used in a social media post. Source: tennessean.com, image: feedingamerica.org.
Source: tennessean.com, Image: feedingamerica.org.

If the map shows a geography we know like our own city or country, we have a lot of prior knowledge that we can apply. This knowledge makes maps easy to digest on the fly. 

We look for our own location. We compare east to west or cities to rural areas. 

Consider showing the distribution of the need you are addressing, the location of your clientele, or where you are providing services using a map. 

The objective is to communicate one primary message but allow for one or two secondary messages. 

For example, the primary message of the map above is that almost every county in the U.S. has residents who can’t afford food. Both the map itself and the title convey this message. 

However, the map allows for a secondary message. The problem is particularly severe in the south. It also allows you to compare your area of the country to that of others.

When using maps in social media posts, make sure they are readable! Shrinking down a map to fit a post often means that the labels are too small for most of us to read. Consider increasing the font size, reducing the number of labels, and/or zooming in on a particular portion of the map.

More great examples of maps in social media posts:

  • A prison data map to shape reform by CommonHealth ACTION
  • Heat map of human trafficking cases by AWS Nonprofits
  • Two active storms threaten the Gulf Coast early this week by Bloomberg Graphics on Twitter
  • The six political states of Florida by the Washington Post on Twitter
  • In 21 U.S. states, minimum wage workers earn the federal rate by Pew Research Center on Twitter

2. BANs (Big A** Numbers)

The BANs shown here are from Women Will, a Google initiative focused on economic empowerment for women. Source: shortyawards.com.
Source: shortyawards.com.

Just one large number can capture attention. 

The BANs shown here are from Women Will, a Google initiative focused on economic empowerment for women. They won a Shorty Award, which honors the best content creators on social media. 

Think about what single number you might share that could spark interest in your work. Numbers that are larger or smaller than most would expect work well. 

If the number you want to share is a percentage, consider converting it to a “natural frequency.” Say, for example, 1 in 10 people rather than 10% of people. We humans often struggle with percentages. Natural frequencies are more intuitive. We can imagine ten people we know. One hundred is more difficult, and percentages are based on 100. 

Add a link from your BAN post to a chart that provides more context and detail for that number.

More great examples of big numbers in social media posts:

  • 62% of Americans can identify the name of Islam’s holiest city. Can you? by Pew Research Center on Twitter
  • Our Census response rate is at 50% by the Maryland Census on Twitter

3. Line Graphs Showing Clear Trends

Line graphs are familiar. Many show change over time. So if we make it clear what is changing (here it's the number of deaths) and over what period of time, we can tell a quick and powerful story without much more than an angled line.
Source: informationisbeautiful.net.

Line graphs are familiar. Many show change over time.

So if we make it clear what is changing (here it’s the number of deaths) and over what period of time, we can tell a quick and powerful story without much more than an angled line. 

But keep it simple with only one line. 

Or, if you want to compare multiple trends using multiple lines, then highlight only one in color. 

For example, rather than show the overall world trend in tuberculosis deaths, you might want to have several lines each showing the trend within one country. Color one trend in a bright color and gray out the others. This will allow viewers to compare the selected country to the others. 

Consider using line graphs to show how the need for your services or your impact has changed over time.

Another great example of a line graph in social media posts:

  • Historic, current, and future population by continents by Visme on Twitter 

4. Bar Charts Showing Clear Comparisons

This bar chart by Agata Ketterick works well for a social media post. It’s simple use of color and limited number of bars make it pretty digestible. And the caption directs your attention to the key takeaway: that over half of the tech companies are located in just two of the twelve regions.

Bar charts also are trusted friends. We get them. 

When deploying bar charts, use color strategically to encourage particular comparisons. 

This bar chart by Agata Ketterick works well for a social media post. It’s simple use of color and limited number of bars make it pretty digestible. And the caption directs your attention to the key takeaway: that over half of the tech companies are located in just two of the twelve regions.

More great examples of bar charts in social media posts:

  • Coronavirus’ toll has hit minority communities the hardest by Bloomberg Graphics on Twitter
  • California’s five largest wildfires by the Washington Post on Twitter

A Parting Warning…

When using charts in your social media posts, strip them down to the essentials. 

Use only one chart and eliminate any visual elements that detract from the main message. 

This post, for example, is too much to process for a busy, distracted social media reader.

When using charts in your social media posts, strip them down to the essentials. Use only one chart and eliminate any visual elements that detract from the main message. This post, for example, is too much to process for a busy, distracted social media reader.

Connect with Amelia Kohm of Data Viz for Nonprofits

Amelia Kohm, PhD, is the founder of Data Viz for Nonprofits (DVN). DVN delivers high-quality visualizations that help organizations to quickly grasp their data, improve their work, and show their impact. Sign up for DVN’s weekly 60-Second Data Tips.

Written by cplysy · Categorized: depictdatastudio

  • « Go to Previous Page
  • Go to page 1
  • Interim pages omitted …
  • Go to page 30
  • Go to page 31
  • Go to page 32
  • Go to page 33
  • Go to page 34
  • Interim pages omitted …
  • Go to page 37
  • Go to Next Page »

Footer

Follow our Work

The easiest way to stay connected to our work is to join our newsletter. You’ll get updates on projects, learn about new events, and hear stories from those evaluators whom the field continues to actively exclude and erase.

Get Updates

Want to take further action or join a pod? Click here to learn more.

Copyright © 2026 · The May 13 Group · Log in

en English
af Afrikaanssq Shqipam አማርኛar العربيةhy Հայերենaz Azərbaycan dilieu Euskarabe Беларуская моваbn বাংলাbs Bosanskibg Българскиca Catalàceb Cebuanony Chichewazh-CN 简体中文zh-TW 繁體中文co Corsuhr Hrvatskics Čeština‎da Dansknl Nederlandsen Englisheo Esperantoet Eestitl Filipinofi Suomifr Françaisfy Fryskgl Galegoka ქართულიde Deutschel Ελληνικάgu ગુજરાતીht Kreyol ayisyenha Harshen Hausahaw Ōlelo Hawaiʻiiw עִבְרִיתhi हिन्दीhmn Hmonghu Magyaris Íslenskaig Igboid Bahasa Indonesiaga Gaeilgeit Italianoja 日本語jw Basa Jawakn ಕನ್ನಡkk Қазақ тіліkm ភាសាខ្មែរko 한국어ku كوردی‎ky Кыргызчаlo ພາສາລາວla Latinlv Latviešu valodalt Lietuvių kalbalb Lëtzebuergeschmk Македонски јазикmg Malagasyms Bahasa Melayuml മലയാളംmt Maltesemi Te Reo Māorimr मराठीmn Монголmy ဗမာစာne नेपालीno Norsk bokmålps پښتوfa فارسیpl Polskipt Portuguêspa ਪੰਜਾਬੀro Românăru Русскийsm Samoangd Gàidhligsr Српски језикst Sesothosn Shonasd سنڌيsi සිංහලsk Slovenčinasl Slovenščinaso Afsoomaalies Españolsu Basa Sundasw Kiswahilisv Svenskatg Тоҷикӣta தமிழ்te తెలుగుth ไทยtr Türkçeuk Українськаur اردوuz O‘zbekchavi Tiếng Việtcy Cymraegxh isiXhosayi יידישyo Yorùbázu Zulu