• Skip to main content
  • Skip to footer
  • Home

The May 13 Group

the next day for evaluation

  • Get Involved
  • Our Work
  • About Us
You are here: Home / Archives for allblogs / freshspectrum

freshspectrum

Oct 22 2021

How to report on the web. My Splash Model strategy.

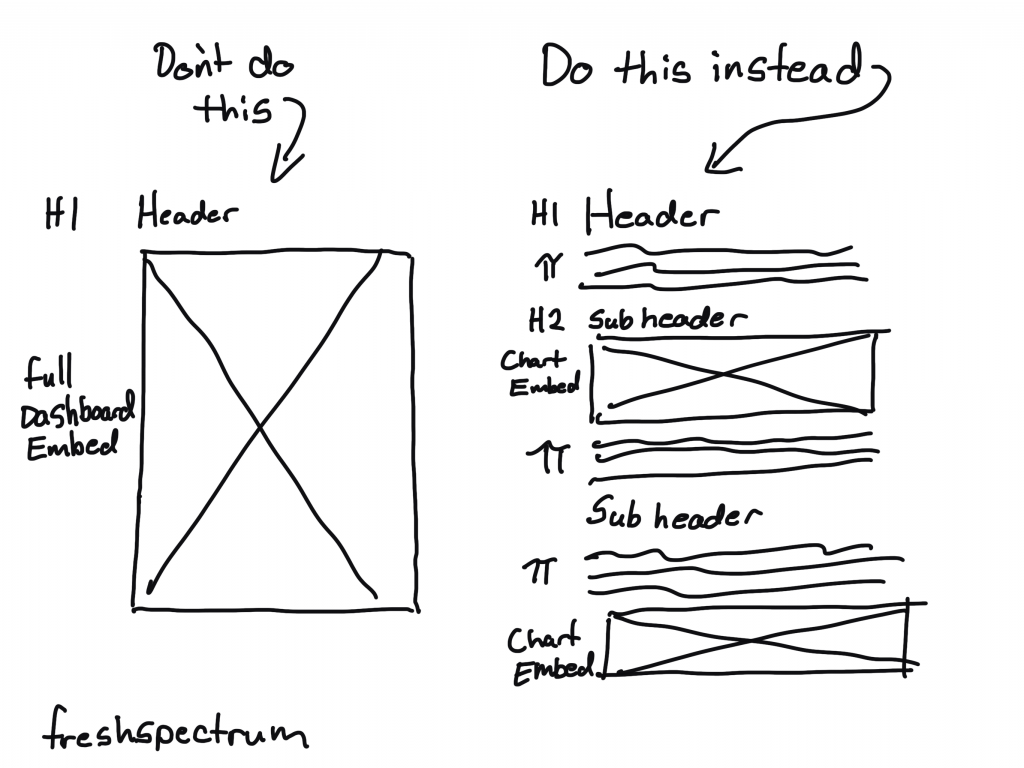
Today’s post outlines a modern reporting strategy that I call the splash model.

In today’s post:

  • A recap, why it’s time for a strategy change.
  • Avoiding the Social Media time suck.
  • Your big three audiences.
  • Big splash content.
  • Byproducts and adaptations.
  • Serve the 1st tier first.
  • Then serve the 2nd tier.
  • 3rd tier by extension.
  • When you know your whole audience.
  • When you want to grow your audience.
  • For more information.

A recap, why it’s time for a strategy change.

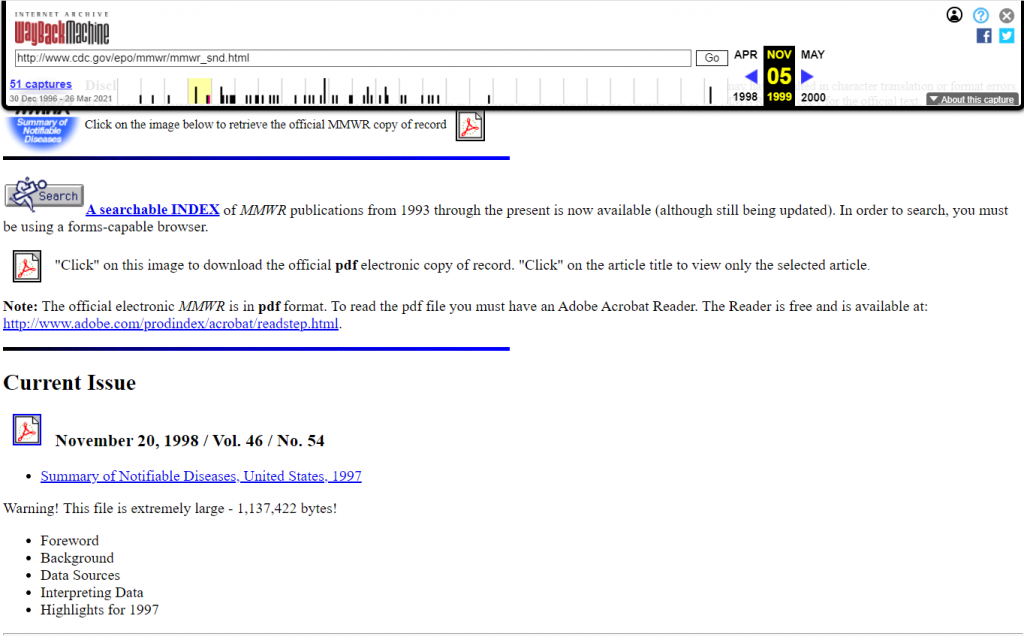
So I wrote a whole post on why I think we need a change in the way we report. You can read the whole thing here, Stop Reporting Like it’s 1999.

But here is the TL/DR version.

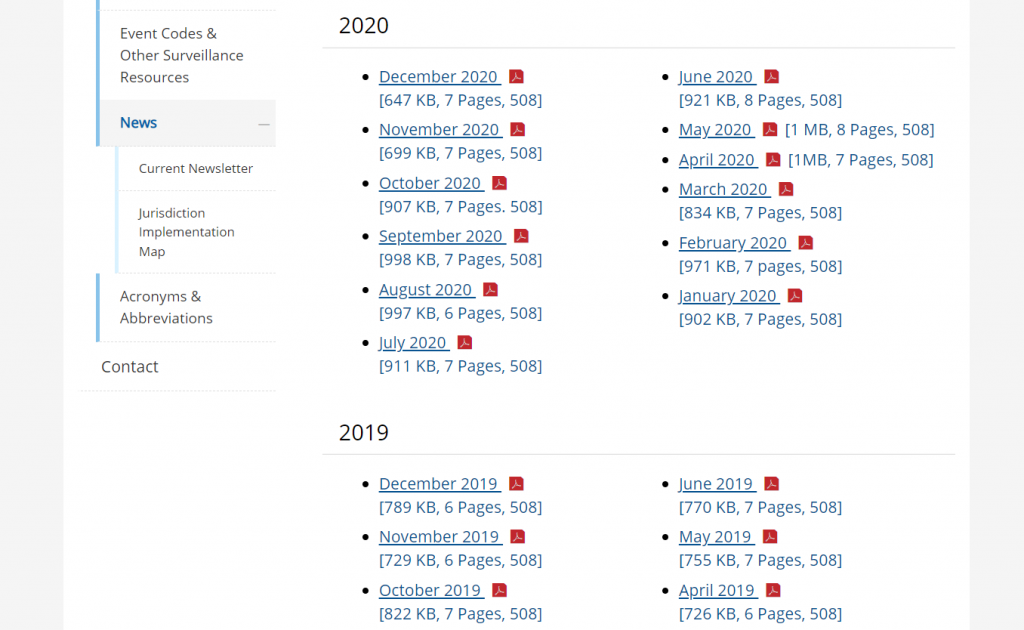
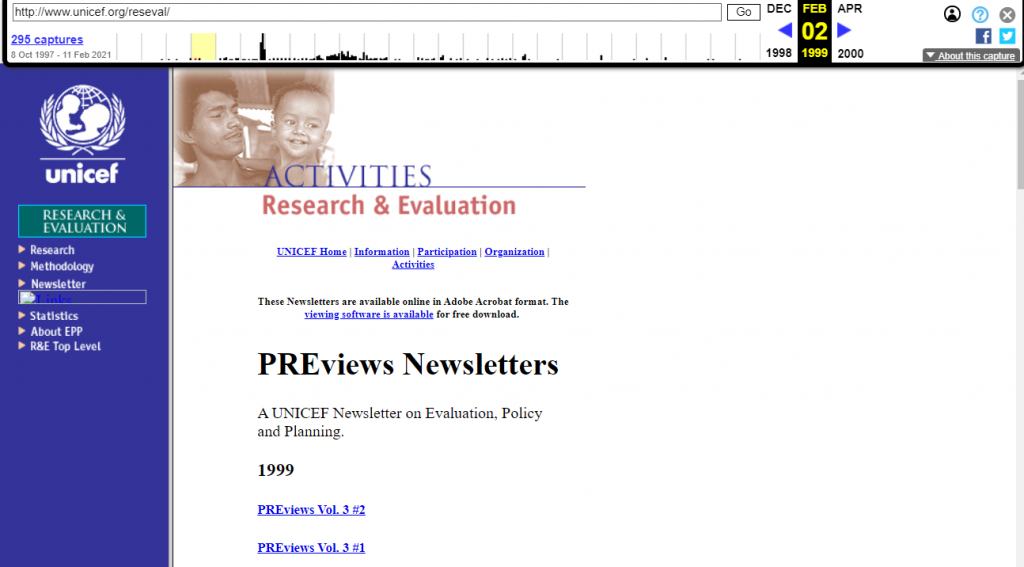
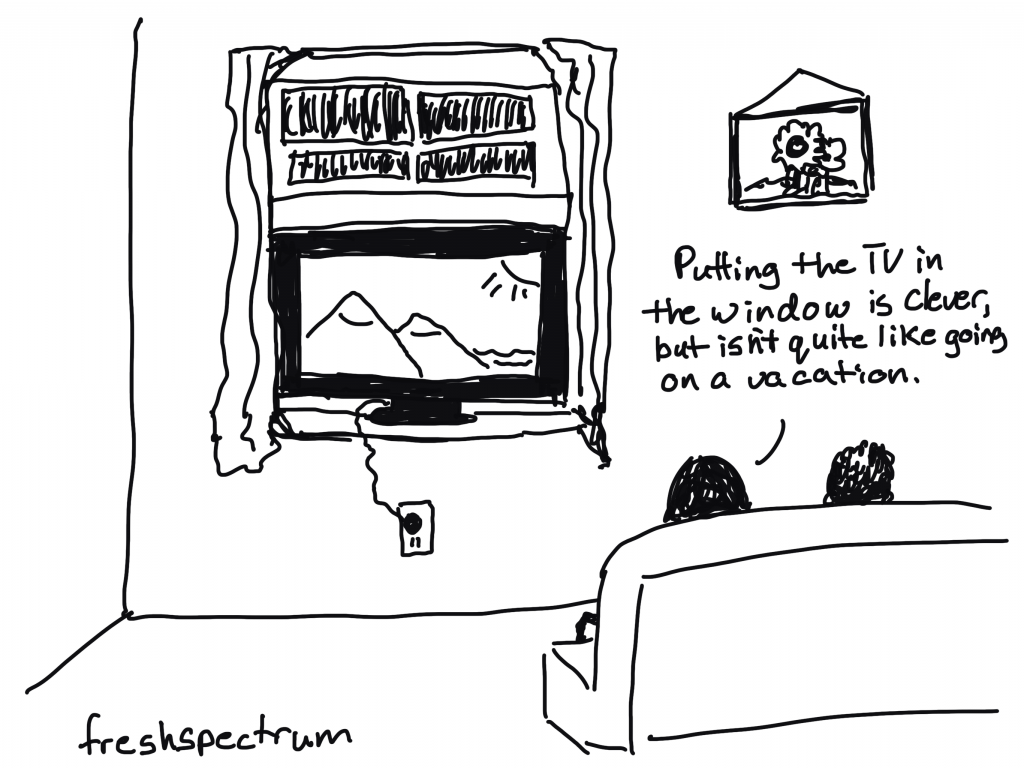
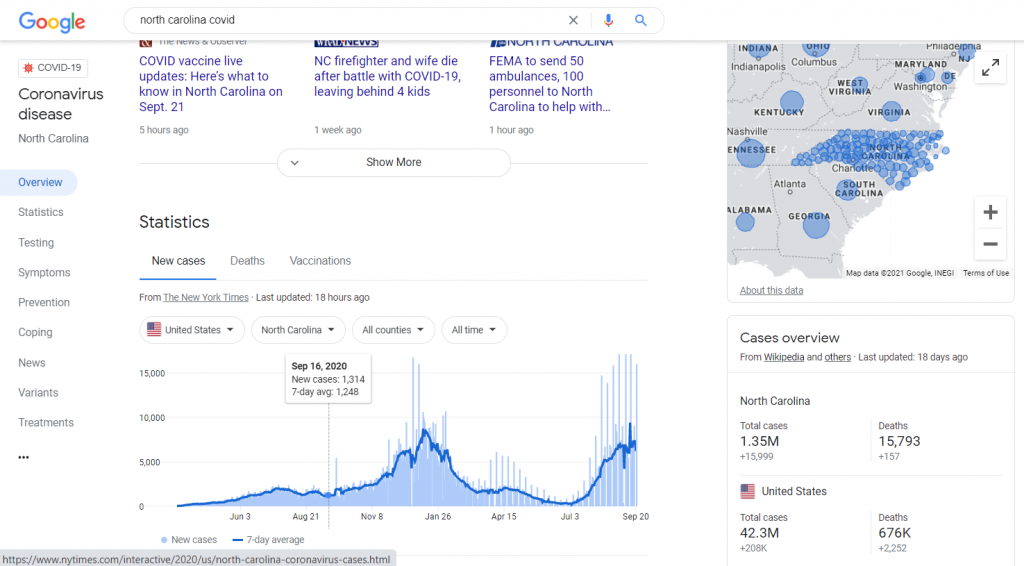
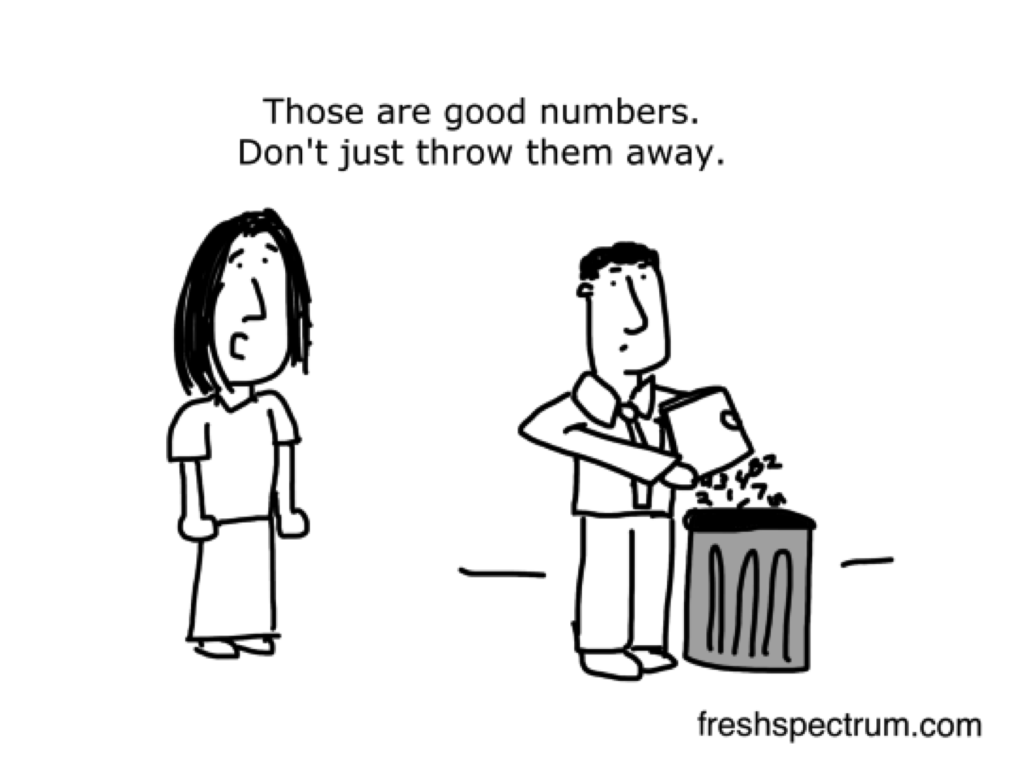
A lot has changed on the web over the last 20+ years. But many organizations are still reporting the same way they did two decades ago, by simply uploading a PDF to a big resource library. It’s time for a change.

Avoiding the Social Media time suck.

I think a lot of organizations feel like they need to show up big on social media. Or at least, that’s where they think they should go first.

Yes, it’s pretty easy to create a tweet, a Facebook post, an Instagram post, or even a TikTok video.

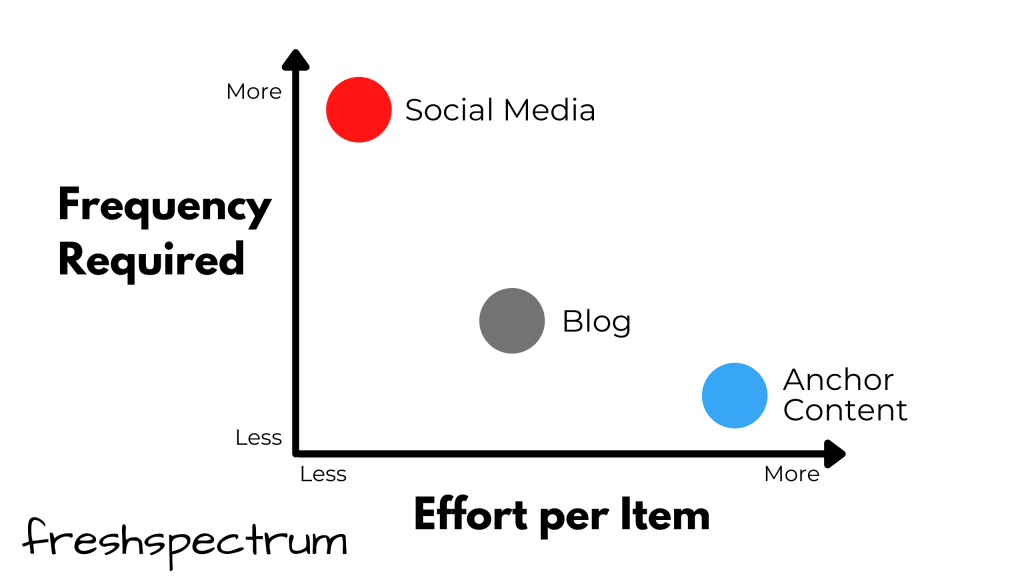
But for most of us, Social Media is a trap.

On the surface it’s just a little bit of work. But to do social well, you have to put in that work, over and over and over again. Day in, day out. And ultimately, it becomes a lot of work. And for what?

There is an alternative though, and that’s to go big instead of going small. To do something big on occasion instead of doing something small constantly.

Your big three audiences.

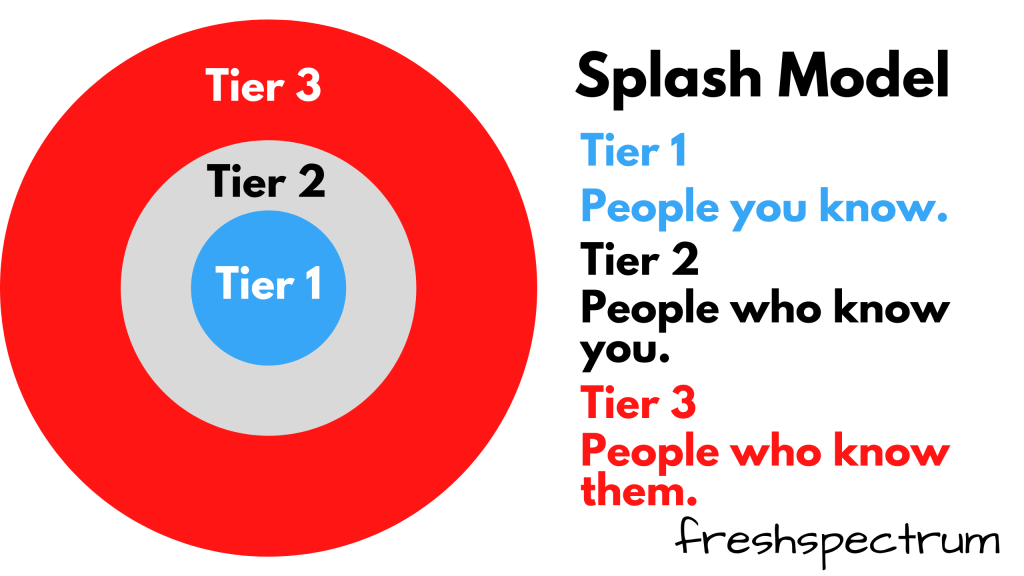
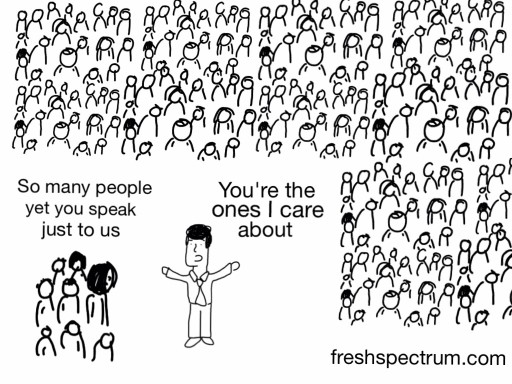
We have three main audiences.

The first tier is our primary audience. Ideally it’s the people you know already (you may even have their email addresses). This is not a casual audience but people who hopefully care deeply about what you plan to share.

The second tier are people who know you. They are the people who follow your work (and likely follow your organization’s social media accounts). They are a casual audience, when the stuff you share is relevant they may click, look, read, and engage.

The third tier are the people who know the people in tier 1 and tier 2. They might not know your work directly, but they will see it when it’s shared by those in the first two tiers. These are the people outside of your direct followers who are “reached” when you share your work and those who find your stuff using Google.
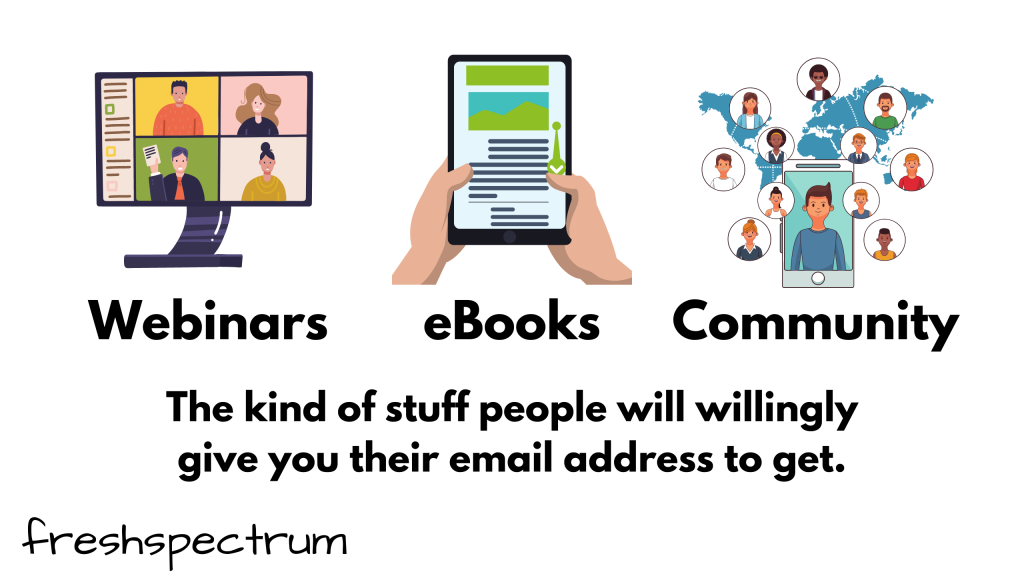
Big splash content.

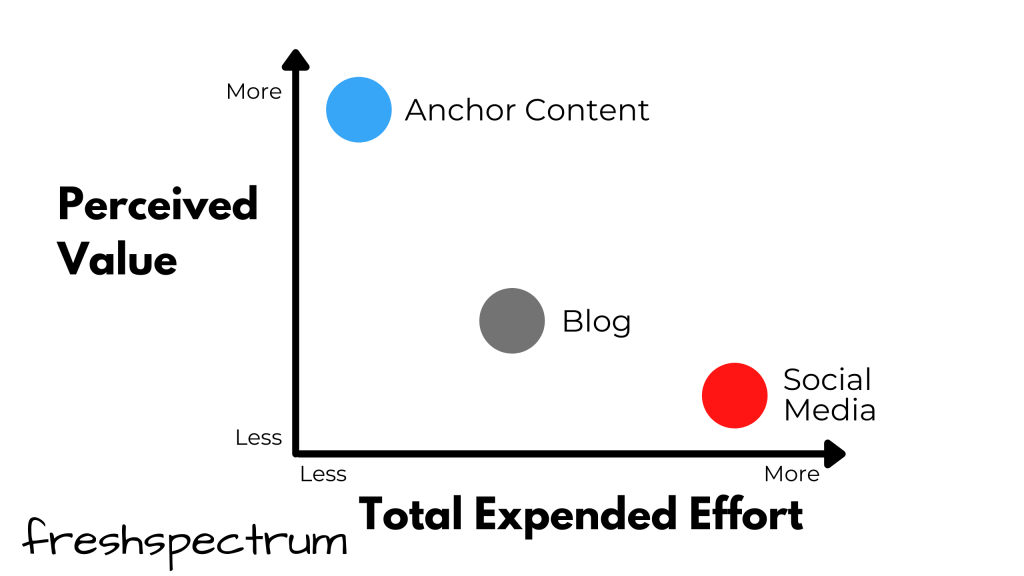
Big splash content (aka anchor content) is the kind of stuff people will give you their email address to get. This could be webinars that you register to attend, ebooks that you register to download, or communities that you register to join. And yes, this could even be a big PDF report.

This is content with a high perceived value. It’s not a throw-away social media post that has a half-life of just a few hours. It’s not a generic blog post that may or may not be designed specifically for the audience you are trying to reach.

For example, what if every time you released a report you had a release party webinar? In that webinar you feature the voices of the program sites, stakeholders, partners, and evaluators. The report is still the thing that you are sharing, but now it’s more than just a button click and skim.

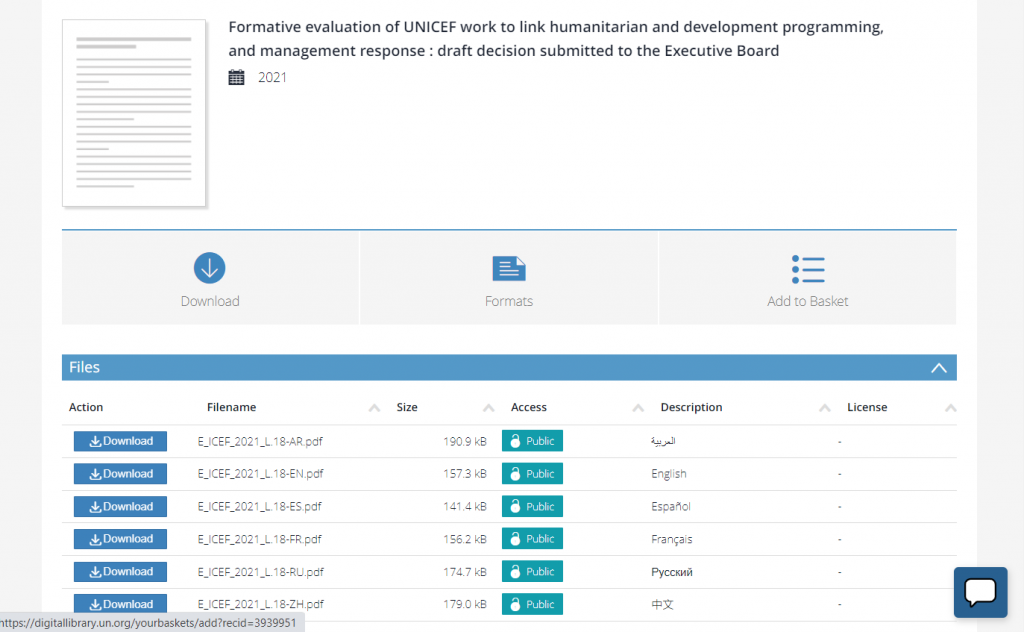
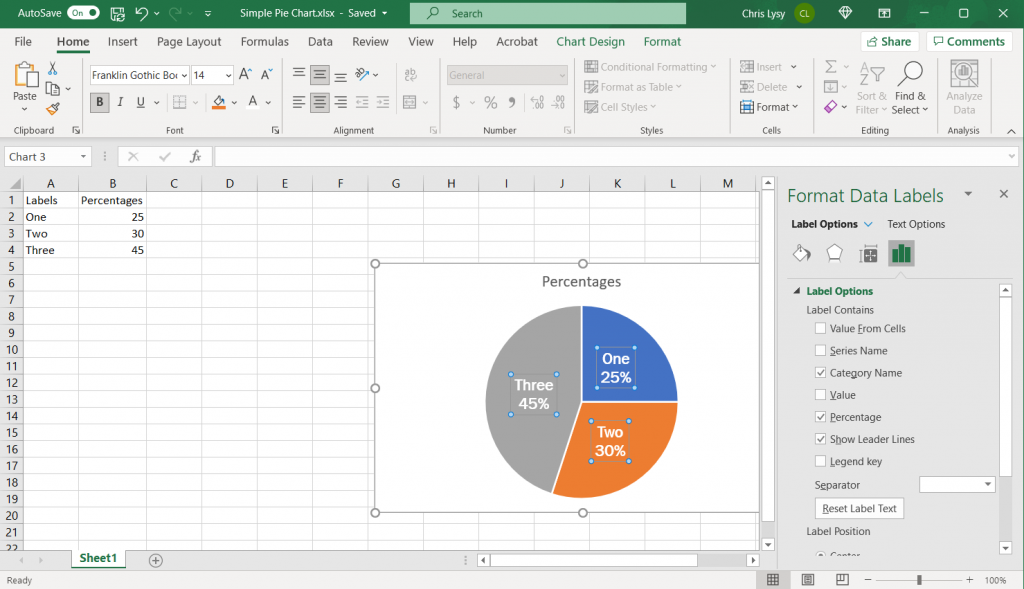
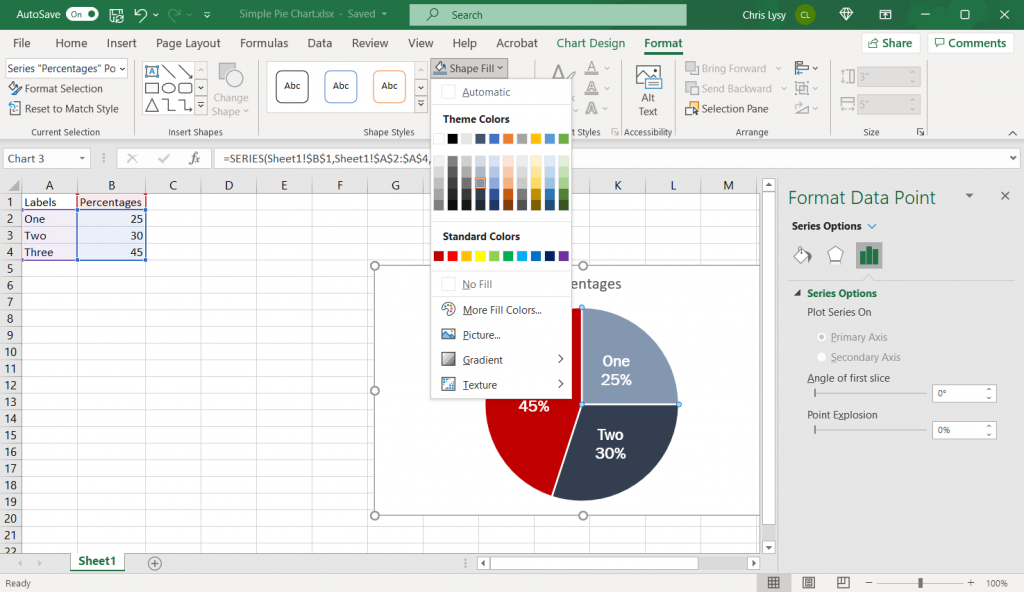
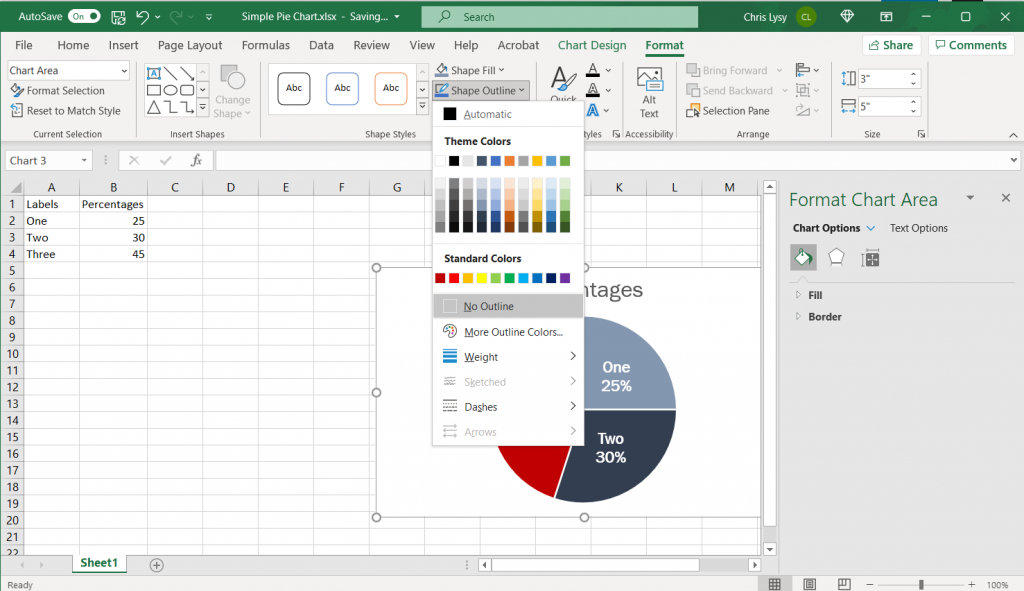
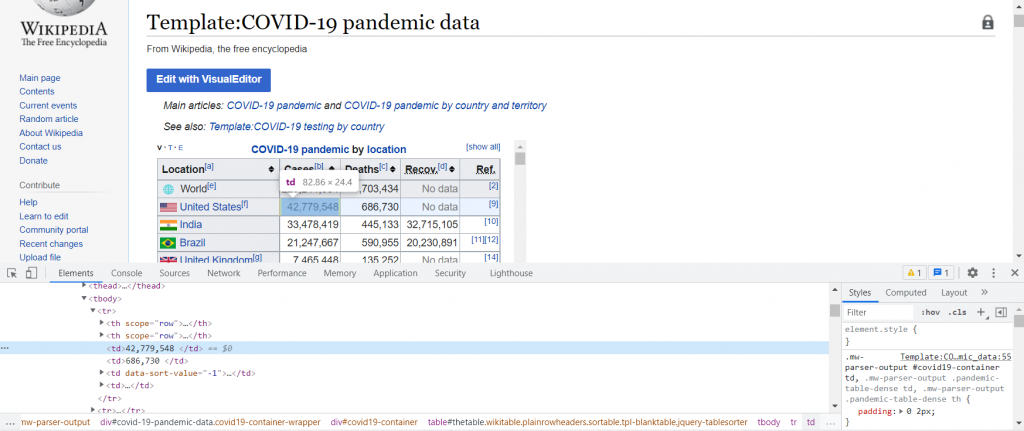
A report can be big splash content. Take this “Flagship Report” created by UNICEF or the Gates Foundation Goalkeepers report. But you have to treat it like it’s something special. If you treat it like a blog post, sharing it along with a simple tweet, a Facebook share, and a single mention in an email newsletter, it’s not going to have that much of an impact. You can’t just share the link, you have to adapt and expand into other forms of content (like infographics or videos) in order to boost the impact and make a bigger splash.

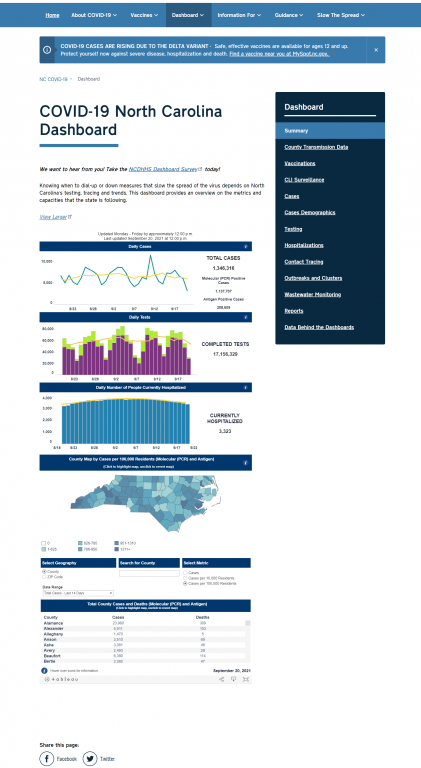
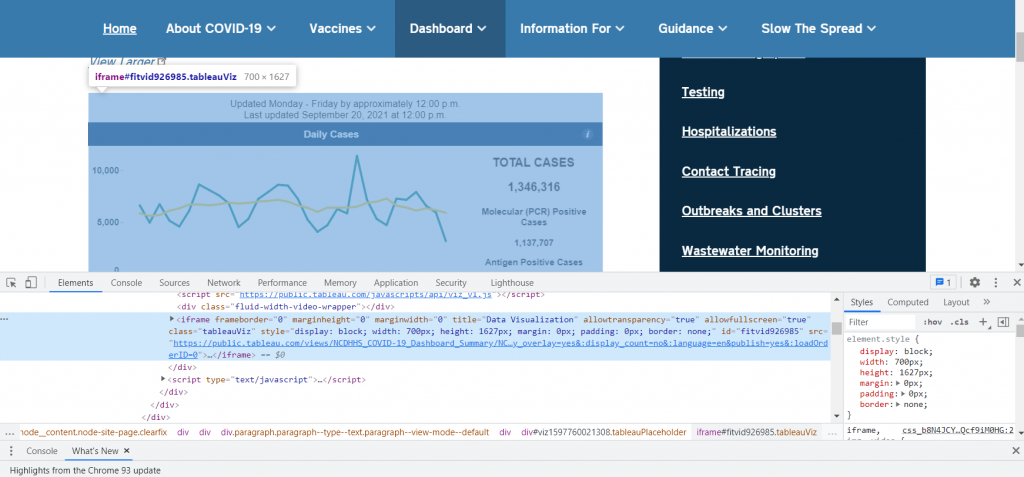
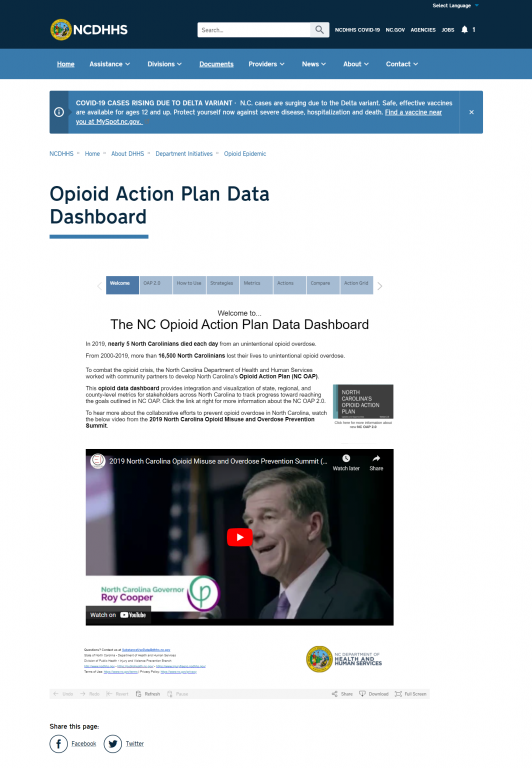
For instance, the UNICEF flagship report was paired with an interactive data dashboard, video, resources for parents, resources for youth, a social media hashtag campaign, assorted infographics you might only find within their social media feed, and other stuff you’re likely only to see if you are part of a specific UNICEF audience.

Byproducts and adaptations.

The cool thing about big splash content is that it naturally leads to other content. A webinar for example might also lead to the creation of the following byproduct content.

  • Announcement Email
  • Calendar Entries
  • Registration Page/Image
  • Announcement Blog Post
  • Announcement Social Posts
  • Follow-up Emails
  • Follow-up Posts
  • Speaker recruitment
  • Slides/Webinar Recording
  • Mentioned Links & Resources

Adaptations are similar to byproducts, but more intentionally created to help reach 2nd and 3rd tier audiences. Where byproducts are just a result of doing something big, adaptations are focused on reaching specific audiences.

  • Slide Inspired Infographics
  • Blog Post Speaker Introductions
  • Q&A Inspired by Webinar (Blog post or social)
  • New Resources Inspired by Webinar (Blog Post)
  • Clipped Video Content
  • Social Media Questions
  • Event screenshots
  • Quote posts with hashtags

Serve the 1st tier first.

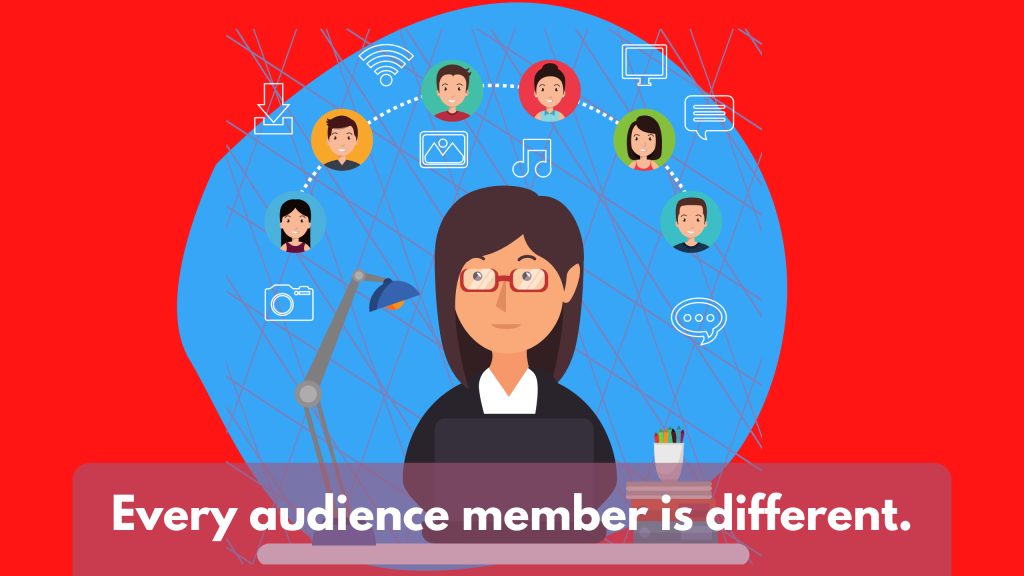
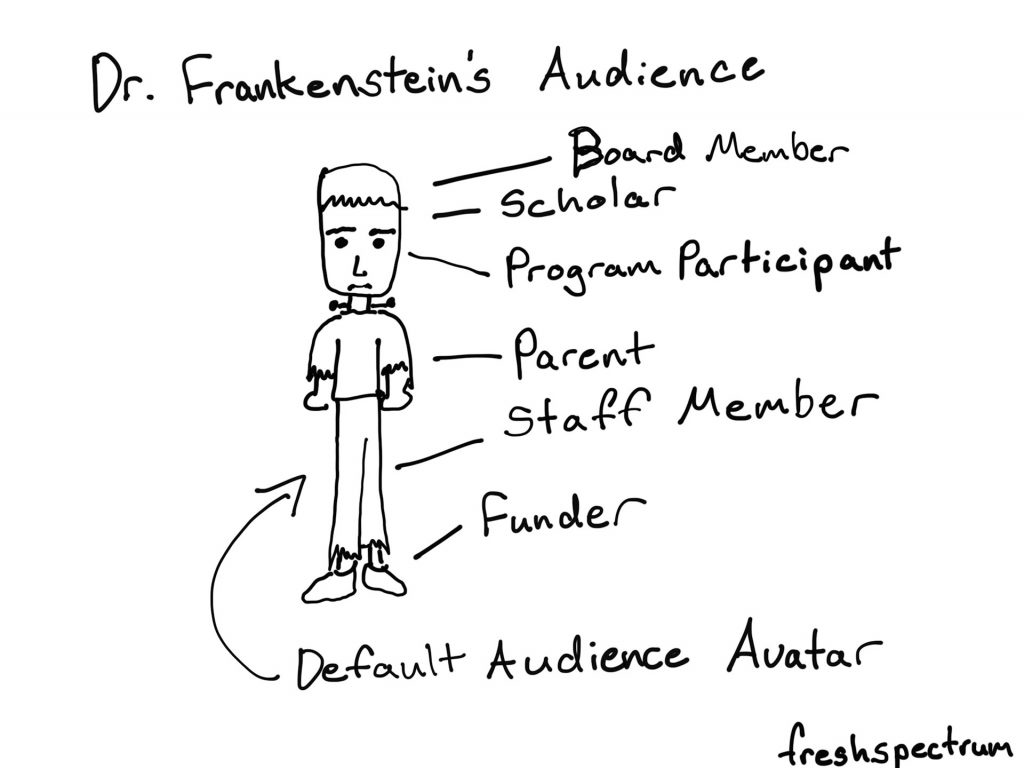
Your report audience is never a monolith. It’s not just an amalgamation of all the different stakeholder groups you can brainstorm on a whiteboard. Different audiences have different needs and desires.

Your job should be to serve the first tier audience first. This requires you to know who is in that first tier. If you have not had that discussion within your organization, you have it before you share your report.

Anything big you do should be of greatest value to those target audience members. If you don’t actually know these people, the big splash content should draw them in. If you do know these people, the big splash content should just be something they will greatly value.

Speaking just to us

Then serve the 2nd tier.

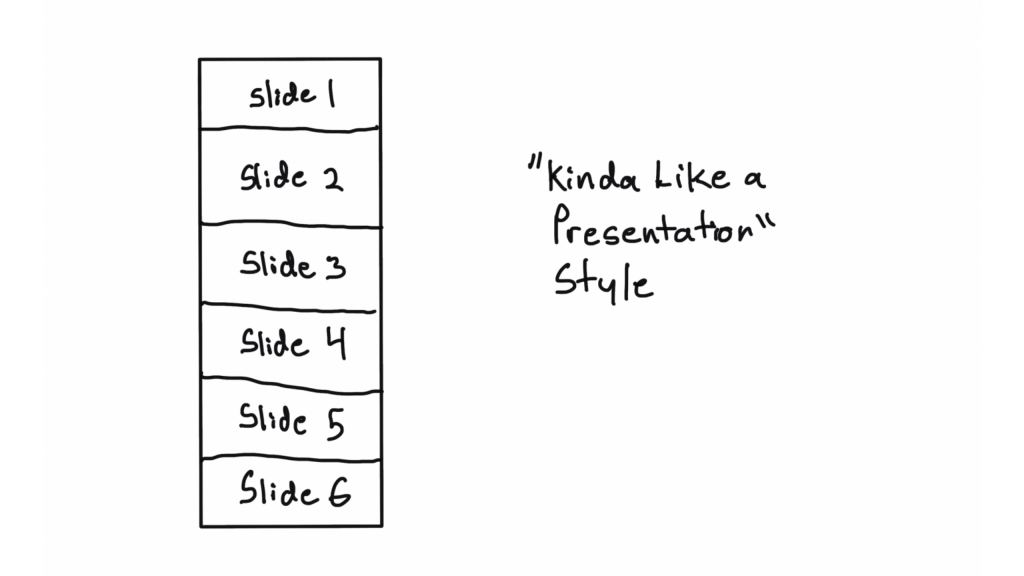
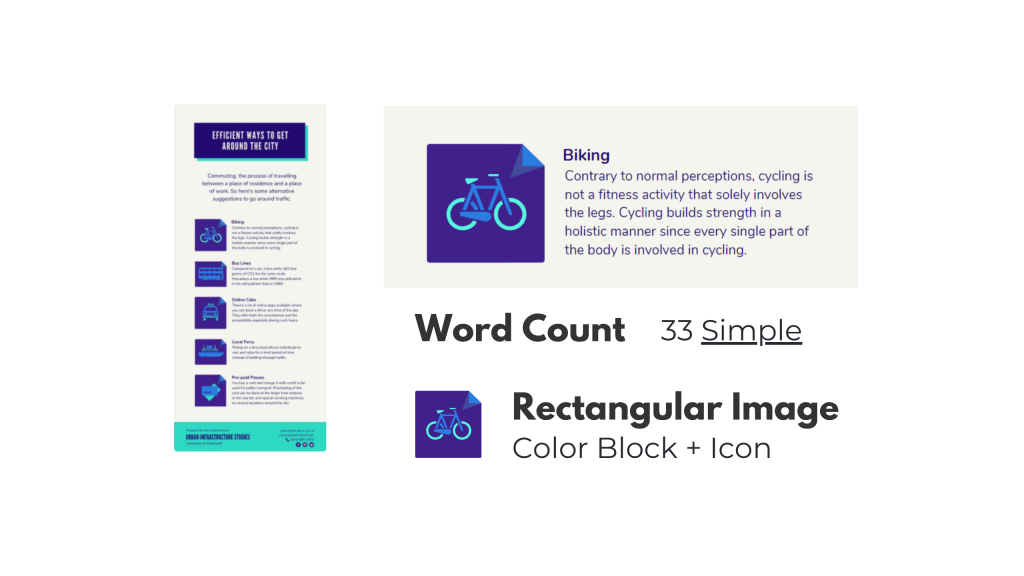
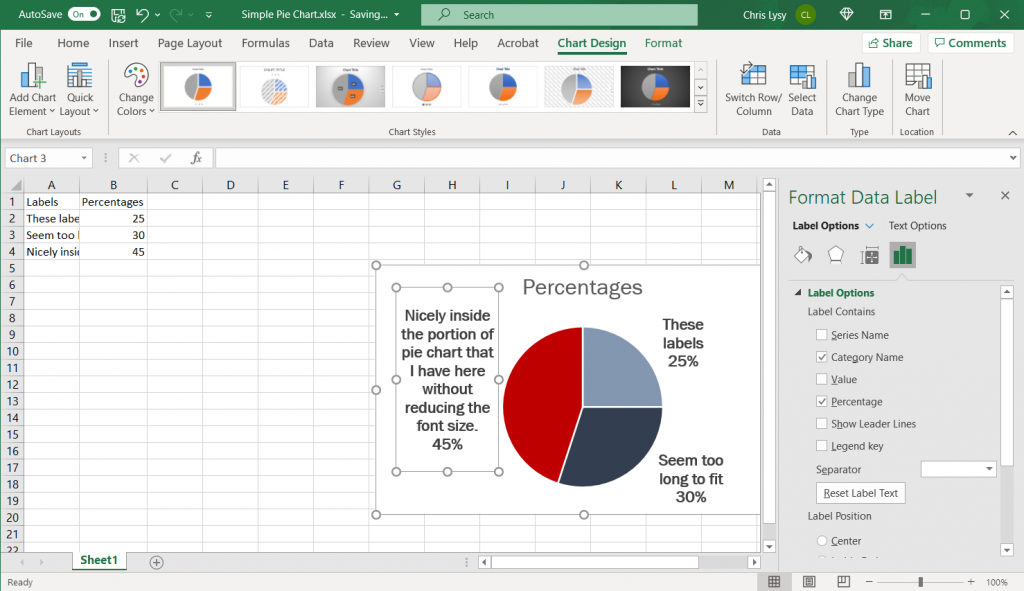
Your second tier is served intentionally by adapting your content to meet the needs of these different stakeholder groups. They are not your primary audience, but you can still serve their needs. Infographics, slidedocs, videos, and other assorted content should be adapted from your report or associated content. The goal is not to rewrite the report, but adapt it into a shorter format with a new audience in mind.

3rd tier by extension.

The third tier of your audience will be reached by extension. The better your big splash anchor content and adaptations, the wider the audience reach. By directly partnering with 1st and 2nd tier audience members in the creation of your content (panel discussion webinars, collaborative blog series, and collaborative social media) you will expand your reach into the 3rd tier. Reaching the 3rd tier requires temporarily borrowing audiences built by others.

When you know your whole audience.

When you known everyone in your 1st tier audience (and serving 2nd and 3rd tier audiences is not within your project scope) then a strategy like this is irrelevant. Just create things to serve that audience, and send them emails or call them on the phone. You likely don’t need social media or even bunches of report adaptations.

When you want to grow your audience.

Let’s say you know a few of your target tier 1 audience members, but there are more out there in the world that are currently unknown. Perhaps they follow you on social, but you don’t yet know them. Your goal for your big splash content will be to build your known audience (by asking for emails!). You’ll also want to build your second tier (by asking for social follows).

But when you design your content still focus on serving the people you know first. To broaden your reach, you start by solidifying your core known audience. The smaller your known audience, the more you will need to partner with 1st and 2nd tier audiences to expand your reach.

For more information.

One day I’ll write this all down, with more supporting evidence and examples, in a book. But given how busy I keep myself, I don’t think that will happen anytime soon. This is the way I conceptualize modern reporting, and it seems to work well when I initiate the strategy. But it is still certainly a work in progress.

Until it’s more fleshed out, I talk about it a bit in my workshop. But whether or not you follow the model doesn’t really matter. Because ultimately reporting this way is just about the following.

  • Known who you are serving.
  • Serve your main audience first with significant content.
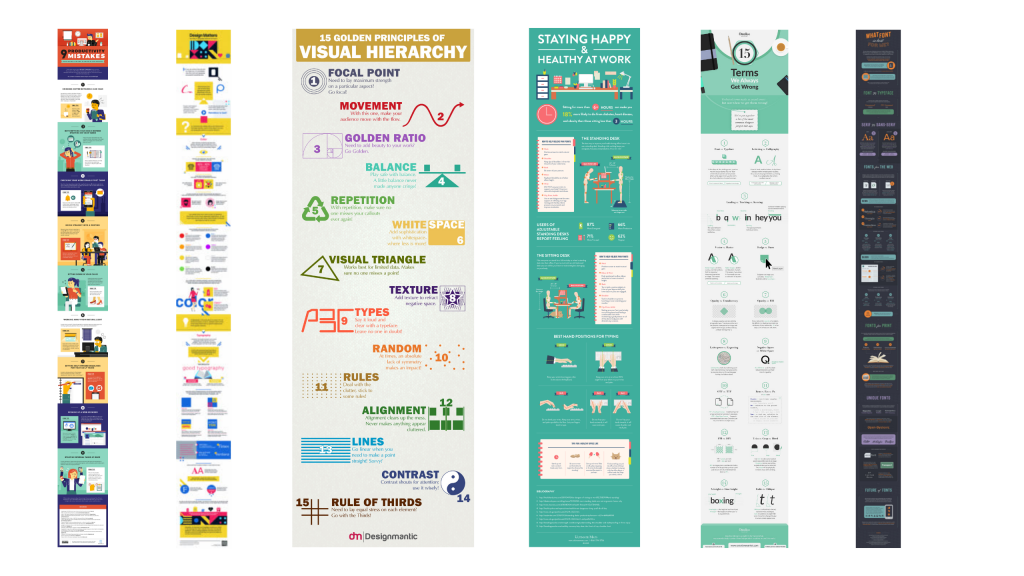
  • The more reach you want your report to have, the more report adaptations you need (infographics, etc.).

But if you have any thoughts, I would love to hear them.

Written by cplysy · Categorized: freshspectrum

Oct 12 2021

Slide Style Infographics – 4 Takeaways [and a free-to-watch workshop session]

Have you ever created an infographic?

No? Why not? Infographics can be a fun way to deliver information to different audiences. They can also be really easy to put together.

Yes? Which type? There are all sorts of different infographic styles and formats.

Today’s post features highlights from one of my pro workshop sessions. During the 33 minute session we walked through the design process for a particular kind of infographic that I call slide style.

  • If you read through this post, I’ll get right to the takeaway points.
  • But I also opened up this particular session recording because I hope it will give you a better idea of how these workshops are structured.
  • To access the session recording, you can find it free-to-watch by clicking this link.
Free-to-Watch Workshop Recording. Slide Style Infographics. Featured Image.
Click here for a free-to-watch version of this session.

Don’t want to watch?

That’s okay, you’ll get the gist by scrolling through this post.

Takeaway #1 An infographic is an audience connection device. Not a report replacement.

Illustrated Image. "Every audience member is different."

One of the biggest mistakes I see a lot is when an organization tries to reach all of their audiences with one report.

People complain, asking for something more visual. So the organization responds by making one infographic. [Facepalm]

Yes, your report was probably super boring. But it likely also was built for either a non existent audience (something I refer to as Dr. Frankenstein’s Audience) or a very specific audience that does not include the person complaining.

Stop trying to serve everyone with one report.

One of the easiest ways to deliver multiple visual reports is to create a string of infographics designed to meet the needs of separate individual audiences.

Cartoon by Chris Lysy.  Dr. Frankenstein's Audience. Board Member, Scholar, Program Participant, Parent, Staff Member, Funder. All represented as a Default Audience Avatar that looks like Frankenstein's monster.

Takeaway #2 Most infographics are designed using a formulaic process.

Kinda like a presentation style illustration.  Shows a sequence of 6 slides.
This is just one style of infographic, there are many more. And this won’t be the last time we talk infographics in this workshop.

Have you ever watched a cable TV cooking show, home design show, game show, or pretty much any mass production TV program?

It can get pretty formulaic, can’t it?

For example, every episode of house hunters. Realtor meets with couple searching for home. Shows three homes. One is definitely not what they were looking to find. The second is what they asked for but probably not what they really need, and it’s also way over budget. The third is perfect, just a little over budget but they can stretch…

Formulas are just conventions and structures that make it easier to produce something creative on a deadline. Most infographics are not going to be genre twisting award winners. And unless you’re building a fancy creative portfolio, let your infographics be purposeful communication tools.

6 Example infographics.
We walk through a string of example sub-types in the full session.

Takeaway #3 Constraints can be useful tools. Especially for something open like an infographic.

An example of an infographic breakdown.
Another thing we do is walk through a section by section template breakdown and talk about how you can use that to make a group design infographic process easier.

It’s hard to start with a blank canvas. Especially when that blank canvas can be any orientation or size that you can imagine.

Even as someone who spends his life creating stuff, I try to avoid the blank canvas. I also think that adding some constraints can make the design process much easier. Especially for something like infographics.

Looking for examples you like, and breaking down the components, can give you the proper foundation for a good infographic. This is also an effective strategy when working with a team.

Pull some examples, ask the team what they like. After they pick their favorites, tell them the exact word counts they should try not to go over if they want something similar. Also remind them that academic-speak and other jargon tend to have way more characters than the example infographic they probably chose.

Takeaway #4 A simple narrative can also guide your infographic creation.

A story, in five frames.
This is who I am now.
When I was a kid.
Gradual changes.
AND THEN THIS HAPPENED.
Charting a new future.
This is a simple story setup we walk through in the workshop. I use it to create my own infographic.

We hear a lot about telling a story with data visualization. But it’s actually really hard to tell a story in just one frame. Usually you need at a least a few frames to properly set the story and then deliver the twist.

Infographics are hardly ever one frame, and this format gives you a lot of room to build. Considering there is rarely a limit on infographic length (unless you self-impose) you can take your time and develop a full narrative.

Creating and telling good stories takes practice, whether or not you use an infographic. But even telling a simple story can really boost the power of a report.

A picture illustrating how to download a PNG in Canva.
This is just showing how to download an infographic from Canva as a PDF. If you want to read my full example infographic, I share it alongside the workshop session.

Activity – Create your own infographic.

Activity - Now it's your turn. Can you write your own story and turn it into an infographic in Canva?

If you do watch the video and decide to create your own infographic, I would love to see it.

Download it as a PNG and then share it on Twitter or LinkedIn. Mention my twitter handle (@clysy on twitter) or mention my name on LinkedIn (linkedin.com/in/clysy/). You can also just share a link in the comments.

DiY Data Design Workshop News

On Wednesday, October 13, we’ll have our 6th session (Splash Model Content Strategy). That means there are 5 other sessions you can watch right now if you join (~2.5 hours of content).

  • Featured Images
  • External Analytics
  • Tableau One-Filter Dashboards
  • Funnel Content Strategy
  • Slide Style Infographics

I’ve also released the next 4 sessions. My plan with this workshop is to just keep presenting, 4 times every month. My goal is to create a large self-paced library with a wide range of workshop sessions you won’t find anywhere else. Then pair it with the kind of community and personal attention you rarely find at this price point.

Upcoming Sessions.

  • 10/13 – Splash Model Content Strategy
  • 10/20 – UX/UI Design Tools
  • 10/27 – Social Media Insights
  • 11/3 – Cartoon Illustration
  • 11/10 – Slidedoc Reporting
  • 11/17 – Personas and User Stories
  • 11/24 – Thanksgiving Break
  • 12/1 – Evaluating Resource Websites

Right now you can still join us at anytime. And at the moment, you can still lock in 20% off. This discount won’t last forever, so join us now!

Written by cplysy · Categorized: freshspectrum

Oct 07 2021

Stop Reporting Like it’s 1999

Today’s post is a reflection on contemporary reporting, and how for many organizations, it looks almost identical to the approaches we used in the late 90s.

In today’s post:

  • Why I think it’s time to kill the “let’s just stick a pdf on a resource page” information sharing paradigm.
  • What has changed in the digital world since 1999.
  • The rise of social media and the attention competition.
  • Smartphones, tablets, big monitors, and the need for responsive design.
  • The evolution of UX/UI design and a new set of software tools.
  • Big data and easy access analytics.
  • The big takeaway.
Freshspectrum Cartoon by Chris Lysy. 
"I have an idea. What if we turn our report into a PDF, then share it on our resources page?"
"Sort of like what we have always done over the last two decades?"

Time to kill the “let’s just stick a pdf on a resource page” information sharing paradigm.

So back in 1999, if you wanted to share a report, you would either create an html version of the report or (increasingly at the time) share a downloadable PDF.

Flash forward to 2021. Now if you wanted to share a report, most organizations simply share a downloadable PDF (or occasionally put together an html version).

This is what I call the “let’s just stick a pdf on a resource page” information sharing paradigm. It’s how countless organizations share their research and evaluation reports. And I think it’s time to evolve.

A snapshot of the CDC’s Morbidity and Mortality Weekly Report from late 1990s.
A snapshot of the CDC’s Case Surveillance News from 2020.
A UNICEF Planning, Research, and Evaluation PDF Newsletter Series from 1999
One of many evaluation PDF reports found in the UN’s current digital library.

What has changed since 1999?

  • Social Media. For instance, Twitter and Facebook didn’t exist until the 2000s. In 1999, Mark Zuckerberg was still in high school.
  • Smart Phones and Flat Screen Monitors. The range of screen sizes you have in your home is incredibly wide compared to 1999.
  • UX Design as a Web Design Paradigm. User experience design predates 1999, but it did not have anywhere near the reputation it has now-a-days.
  • Big Data and Easy Access Analytics. Google Analytics didn’t launch until 2005, lots of websites still had hit counters in 1999.

1. The rise of social media and the attention competition.

Social media didn’t look nearly the same back in 1999. Blogger was launched that year and WordPress was a few years away. The now defunct GeoCities was the 3rd largest site one the web. As for peer to peer, it was pretty much email, old school internet forums, and AOL instant messenger.

It’s kind of amazing to think about how much social media has grown over the past two decades. There are so many ways for people and organizations to share their thoughts with the world today that just didn’t exist back then.

People are not losing their attention spans, they are just experiencing an overwhelming amount of new information. And the people who have monetized attention are playing hard, and not always fair. It means, if you really care about sharing, you need to up your own game.

Freshspectrum Cartoon by Chris Lysy. 
"Hey Sweetheart, what you workin on?"
"Grandpa needed help setting up his new computer. He said that all his important files are on this thing. What is it? It looks like the save button."

2. Smartphones, tablets, big monitors, and the need for responsive design.

The iPhone wasn’t released until 2007. We had cell phones, but definitely not smart phones. As for the monitors on our desks, they were boxy picture tubes that could only get so big. Which was okay, because our computers could only power so much and nobody had the internet bandwidth we have now.

Today I often bounce back and forth between an iPad, a large PC laptop, an old MacBook, and my iPhone. The screens are wildly different, and so is the experience.

PDF technology really helped our field get their print reports onto the web. You didn’t have to learn web design to share a report. It looked like it did on paper and that worked more or less okay on old school computers. Not so much in our now multi-responsive world.

Freshspectrum Cartoon by Chris Lysy. 
"When I was your age, sure we had the internet, but there was no Google. We had AOL. And for our family, AOL was the internet."

3. The evolution of UX/UI design and a new set of software tools.

When I think back to the late 90s I remember a lot of ugly websites. And as time went on, they started to get prettier but also more confusing.

In 1993 Don Norman coined the term “user experience” for his group at Apple Computer. (Watch Don explain the history of “UX” and what he thinks of how people use his word now.) But the field is older than the term.

A 100-Year View of User Experience – Nielsen Norman Group

In today’s software and web design worlds it is hard to miss the influence of user experience design. At the most basic level, it’s not so much a methodology as it’s a shift in perspective.

The original question, “what do we intend with this site and how does it perform?,” has been replaced with “what does the user experience and how can we improve that experience?”

It might not seem like much, but the simple shift in perspective changes so much in how we design. And the product is so much more relevant and useful.

Freshspectrum Cartoon by Chris Lysy. 
"Do you think there is a server somewhere that holds the remnants of my friendster profile?"
"Maybe. I have had this recurring dream where some future archeologist stumbles upon my livejournal."

4. Big data and easy access analytics.

In the early days of the web you would track web traffic based on how many times your server delivered data to a user. With these numbers you could pickup on things like, “how many times was a page visited?” or “how often was this pdf downloaded?”

Over time, analytics became more sophisticated. With web cookie based analytics programs like Google Analytics you can track just about every keystroke. You also get access to more information, sophisticated algorithms, and clean reports. There are also other external analytics data sources we can tap into.

All of this data provides us with a greater ability to influence strategy. But that assumes we have a strategy beyond, “let’s just stick our pdf on our report page.”

The big takeaway: It’s time for a change in strategy.

So to recap.

  • Audience attention is finite, and there is more competition than ever.
  • Our information viewing context has changed dramatically.
  • We have new sets of methods we can use to understand audience needs and experience.
  • We have sources of analytics that can directly guide our reporting strategy.

I am not against PDFs. Even super big PDFs that few people will ever read have their place in a larger strategy. But I think we can do better with how we share our research, evaluation, and other data than to default to same style of reporting we’ve been doing for the past 20+ years.

Instead, I advocate for strategic, thoughtful, and systematic approaches to information design. In a future post I’ll share my approach, a strategy that I call the splash model.

Written by cplysy · Categorized: freshspectrum

Sep 28 2021

How to make a pie chart in Excel


This is the fourth in a series of posts on chart design in Excel. In each post we will take on a different chart type. Today we’ll go with a chart that is widely used but often maligned by chart experts, the Pie Chart.

What you’ll find in this post:

  • An Oversimplified How To
  • How to create a good looking pie chart.
  • When to use a pie chart (and when not to use a pie chart).
  • Why pie charts don’t actually suck.
  • Some other considerations.
How to Make Pie Charts in Excel

An Oversimplified How To

Creating a pie chart (a.k.a. pie graph) is really simple in Excel. It just takes a column of data and a couple of buttons.

How to make a pie chart in Excel, step 1.

Step 1. Highlight a column of numbers.

How to make a pie chart in Excel, step 2

Step 2. Click on the insert tab, then the pie chart icon. Then select the first 2-D Pie.

*If you have any instinct to click the 3-D Pie button, resist that instinct. 3-D will distort the data.

How to make a pie chart in Excel, step 3

Step 3. Woohoo, you created a pie chart!

How to create a good looking pie chart.

Okay, so that’s the most basic of basics. Here are some more steps you probably want to take to create something worth sharing.

Labeling your graph.

How to make a pie chart in Excel Example Screenshot, Labeling your graph

So in addition to just a column of numbers it’s a good idea to have row labels and column headers. Lots of pie charts are created using percentages that add up to 100. I’ll just pretend my data is real and not fake.

Directly Label the Pie Chart Portions

How to make a pie chart in Excel Example Screenshot, Directly label pie chart slices

I don’t like the legend at the bottom. So I’m going to delete that (click on the legend and press the delete button) and then directly label the pie chart portions. You do this by right clicking on the pie chart and selecting “Add Data Labels” from the menu.

Changing the Label Position

How to make a pie chart in Excel Example Screenshot, Changing the Label Position

The labels need more work. I don’t like Excel’s “Best Fit” so I’m going to change the label position. Just right click on the label and select “Format Data Labels” to bring up the menu.

Adding the Category Name to the Data Label

How to make a pie chart in Excel Example Screenshot, Adding the Category Name to the Data Label

I also want to add the category name to the label. In the same Format Data Labels menu as the previous step, just click on the Category Name box. I’m also going to unclick the “Value” box and click on the “Percentage” box. Then add a “(New Line)” separator.

Format Data Labels Color and Font

How to make a pie chart in Excel Example Screenshot, Format the Color and Font

While I have the data labels selected, I’m going to move to the top of the page and change the font, font size, and data label color.

Changing Colors with Intention

How to make a pie chart in Excel Example Screenshot, Changing Colors with Intention

I also want to change the pie chart colors off the default. I like using a highlight color when possible (especially when I am going to discuss the chart in the body of a text). I’ll use a strong color (say red) for the highlight. Then I’ll draw from a gray scale for the other two segments.

If you think this might get printed in black and white, I suggest pulling the 3 colors from different color rows. So in my case, the darkest red, the second darkest gray/blue, and the third darkest gray/blue.

Taking away the outline.

How to make a pie chart in Excel Example Screenshot, taking away the chart outline

If you plan to copy this chart into another type of document, I suggest taking away the random chart outline Excel puts in by default. Just click on the chart box, and then select “No Outline.”

What if your pie chart category labels are too long?

How to make a pie chart in Excel Example Screenshot, what to do with longer category labels

If your category labels are too long to fit inside your pie chart, switch the label position to the outside. You also might need to extend the default textbox to show all the included text, and maybe shift it around the chart.

Color matching your labels to your pie chart segments.

How to make a pie chart in Excel Example Screenshot, color matching labels to pie slices

Depending on the colors you are using for your pie chart (and the number of slices), you might choose to adjust the color of the text to match each slice. This is best when you only have a few slices (which is really best with pie charts in general).

Saving the Image

How to make a pie chart in Excel Example Screenshot, saving as picture

Once you have made all the changes you want to the chart you can save it as a picture. Just right click on the chart area and click “Save as Picture.”

Alternatively, you can just copy and paste the chart from Excel into Word or PowerPoint. If you’re staying within the Office suite, this is the ideal way to move the image as it retains your full ability to reformat the graphic.

How to make a pie chart in Excel Example Screenshot, finished pie chart example

Beyond the Basics

Generally though I suggest keeping the chart itself simple and minimalist. You can always add flare through annotations/additional graphics. Doing things like making your charts 3D doesn’t help the presentation, it just makes the chart harder to interpret and can also skew the data.

When to use a pie chart (and when not to use a pie chart).

freshspectrum cartoon by Chris Lysy, "Can I get 12.5% of a cheese pizza please?"

Pie charts are used to break down things.

Take for instance, a budget. Let’s say you want to have a visual showing the break down of the budget into 4 different spending categories. You can certainly use a pie chart for that, as long as you don’t need your audience to precisely compare the sections.

In other words, you just kind want to show the gist of how a budget is broken down without getting into the comparison weeds.

Pie charts are probably better than any other visual for expressing a part-to-whole relationship. When you hear “percent of…” or “part of…” that’s one indication a pie chart could meet your needs.

Storytelling with Data – What is a Pie Chart?

So when shouldn’t you use a pie chart?

A lot of the time. If you wanted to have a default chart that you used over and over again, you would be better off with a bar chart. A bar chart is going to make comparing categories easier. It’s just way more precise.

But not every design choice is about visual precision.

Pies and doughnuts fail because:

Quantity is represented by slices; humans aren’t particularly good at estimating quantity from angles, which is the skill needed.

Matching the labels and the slices can be hard work.

Small percentages (which might be important) are tricky to show.

The University of Melbourne Statistical Consulting Centre – Why you shouldn’t use pie charts

Why pie charts don’t actually suck.

I really like this quote by data journalist and artist Mona Chalabi,

On a computer, data looks slick. I draw over it to show that data isn’t always precise. The lines aren’t completely straight to show that there is a margin of error in all data sets.

Fast Company – To tell the real story, data journalist Mona Chalabi draws imperfect lines

Hang out with enough data visualization people and you’ll hear a lot of pie chart hate. That hate inspired the following cartoon a few years back, and it’s still a regular holiday favorite among my cartoon fans.

freshspectrum cartoon by Chris Lysy, "At the dataviz expert ugly sweater party. Did we all go with pie charts again?"

But I think the hate is a bit overdone.

I mean check out this pie chart I pulled from Wikipedia’s entry on US Government Spending.

Defense spending pie chart example.
Wikipedia – Government Spending in the United States

We’re not looking at this chart to compare the differences in the amount of discretionary funding between Law Enforcement and Foreign Affairs. The basic gist of the chart is this, the US budgets over half of it’s discretionary funds to defense, more than all those other categories combined.

freshspectrum cartoon by Chris Lysy, "You know, if you used a bar chart, it would be much more precise."
"Of course it would. But given the small sample size, the added precision would be misleading."

One of the dangers of charts is that you can make a dataset look far more precise than it ever should look. And in those cases (such as in surveys with low response rates) maybe stepping back your level of visual precision isn’t such a bad thing.

Other Considerations

How many slices?

I tend not to like charts that use any more than a few. 2 or 3 slices tend to work best. Unless your point is that a single slice makes up most of the chart, and you have a bunch of itty bitty little slices there to prove their unimportance.

Way too many slices pie chart.
Example from Brian Cort’s Post – In Defence of the Humble Pie Chart

Create Small Multiples

Resist the urge to create big confusing charts. Most of the time, you are far better off creating multiple simple charts.

Facebook profits pie charts example.
Example from Flowing Data – Good Use of Pie Charts

Written by cplysy · Categorized: freshspectrum

Sep 21 2021

How to embed Tableau dashboards, without hiding them from Google.

Okay, long story short.

If you are presenting to a public audience, don’t just plop the embed code on your website. And if you don’t feel like reading about why, skip to the bottom of the page for how I would suggest you embed Tableau dashboards (and lots of other embeddable things).

Short story long? Continue reading.

What you see is not what Google sees.

Freshspectrum Cartoon. "Putting the TV in the window is clever, but isn't quite like going on a vacation."

Your web browser translates html and other code into a screen that you can see and read. But just because something looks like it lives on your website, doesn’t mean it does.

Google calls this content rich media. The star of rich media is video. Most video lives on YouTube, we just watch it through our web pages.

But this is something we should really consider when sharing data dashboards. We tend to be really concerned with what goes into a dashboard, but how often do you think about how it will be shared?

So if I embed a dashboard, Google won’t be able to crawl it?

Freshspectrum Cartoon. "These are my new Google glasses. They let me see a website like Google sees it."
"You know if you right click and choose 'inspect' it does the same thing."

Not exactly. Google has gotten really good at crawling the web and indexing web pages. So it’s pretty likely that they can also parse out the information on the page. But that doesn’t mean it won’t cause problems.

The biggest issue is that if you just plop an embedded dashboard onto your web page, your dashboard content is less likely to show up high in Google search. It’s fine if you don’t care whether people find your dashboard when they Google. But if you want to reach a public audience, you need to compensate.

If you do plan to use rich media on your site, here are some recommendations that can help prevent problems.

Try to use rich media only where it is needed. We recommend that you use HTML for content and navigation.

Provide text versions of pages. If you use a non-HTML splash screen on the home page, make sure to include a regular HTML link on that front page to a text-based page where a user (or Googlebot) can navigate throughout your site without the need for rich media.

In general, search engines are text based. This means that in order to be crawled and indexed, your content needs to be in text format.

Google Developers – Rich media file best practices

For Example. Let’s look at North Carolina’s COVID-19 dashboard.

When I see the page, this is what I see.

NC COVID 19 Dashboard. Accessed 9/21/2021. https://covid19.ncdhhs.gov/dashboard

Behind the dashboard I see, in the code, I find an iframe link.

NC COVID 19 Dashboard. Accessed 9/21/2021. With the inspect button.

IFrames are sometimes used to display content on web pages. Content displayed via iFrames may not be indexed and available to appear in Google’s search results. We recommend that you avoid the use of iFrames to display content. If you do include iFrames, make sure to provide additional text-based links to the content they display, so that Googlebot can crawl and index this content.

Google Developers – Rich media file best practices

Here, on this page, Google is most likely indexing the lead in paragraph and the header. But not really the data.

But here is the positive with this example, NC’s “COVID dashboard” is an entire subdomain website. It’s not just a page with an embedded Tableau dashboard. So this produces a lot of text for Google to index. Subsequently, the dashboard ranks high in search rankings.

For comparison, you can check out another NC Tableau Dashboard. This one with opioid data. Unlike the previous example, the Opioid Action Plan Data Dashboard has just about all of the text based information embedded within the dashboard.

The NC Opioid Action Plan Data Dashboard.  Screenshot taken on 9/21/2021

Ultimately, when Google looks at this page. Instead of seeing all that text content, it’s going to just register a few lines of IFrame code.

For the sake of being able to Google this information, all of the text based information (and the tabs) should exist within the websites HTML, not the Tableau dashboard.

Counter Example: NY Times?

So here is the North Carolina COVID Coronavirus Map on NY Times.

NY Times Coronavirus Map, accessed on 9/21/2021. https://www.nytimes.com/interactive/2021/us/north-carolina-covid-cases.html

Let’s look at the code underneath the visual.

Unlike the last example, everything you see on the page can be found in the code.

If you have ever wondered why Google tends to spotlight data in their search criteria from places like the NY Times and Wikipedia, this is one of the major reasons why. The data crawled, indexed, and visualized on its own terms. This in turn, helps direct people back to places like NY Times and Wikipedia.

Screenshot from Google search of "North Carolina COVID" on 9/21/2021.
Screenshot of inspected Wikipedia COVID-19 data accessed on 9/21/2021 https://en.wikipedia.org/wiki/Template:COVID-19_pandemic_data

I know, this isn’t Tableau. But this embed thing goes well beyond Tableau.

When sharing information on the web, if we want people to find it, we have to understand what is shared behind what we see.

Bonus Tip: Yes, they are ugly websites, but they are trusted ugly websites

Freshspectrum Cartoon. "But our website is so ugly!"
"Definitely, but Google trusts it."

So another question I’ve seen is about domains and dashboards. Should we publish our dashboard under our state or organization domain?

If you work for a state government, federal government, or university you might get annoyed by your website. But even the ugliest of websites fare pretty well in Google, because these sites have a lot of authority.

So when faced with a decision of whether to put your public data dashboard up on an established organization/government public facing website versus sharing on a new domain, generally use the established site. Even if that means a few more bureaucratic hurdles, it’s going to give you the best chance of your content being found.

So, how do we embed Tableau dashboards then?

Freshspectrum Cartoon. "Don't do this. Just embedding a dashboard." "Do this instead. Header, Subheader, chart embed. etc."

Okay, here is the short answer.

If it is going to be public and on your website, stop thinking about your dashboard as a “Tableau dashboard.” Instead, think of it as a dashboard on your website that you created with the help of Tableau.

Put as much as possible into the HTML on your web page. And if that means creating multiple sub-pages using HTML, do that. Google is going to see it better, and connect it with you if it lives directly on your website.

Then embed the interactive charts/views intermixed with the text based HTML content.

Still Confused?

Let's create together. DiY Data Design.

It can get confusing. That’s why I run a workshop and hold Q&A portions with every session. Click here to join us and get $100 off the annual workshop cost.

Written by cplysy · Categorized: freshspectrum

  • « Go to Previous Page
  • Go to page 1
  • Interim pages omitted …
  • Go to page 34
  • Go to page 35
  • Go to page 36
  • Go to page 37
  • Go to page 38
  • Interim pages omitted …
  • Go to page 54
  • Go to Next Page »

Footer

Follow our Work

The easiest way to stay connected to our work is to join our newsletter. You’ll get updates on projects, learn about new events, and hear stories from those evaluators whom the field continues to actively exclude and erase.

Get Updates

Want to take further action or join a pod? Click here to learn more.

Copyright © 2026 · The May 13 Group · Log in

en English
af Afrikaanssq Shqipam አማርኛar العربيةhy Հայերենaz Azərbaycan dilieu Euskarabe Беларуская моваbn বাংলাbs Bosanskibg Българскиca Catalàceb Cebuanony Chichewazh-CN 简体中文zh-TW 繁體中文co Corsuhr Hrvatskics Čeština‎da Dansknl Nederlandsen Englisheo Esperantoet Eestitl Filipinofi Suomifr Françaisfy Fryskgl Galegoka ქართულიde Deutschel Ελληνικάgu ગુજરાતીht Kreyol ayisyenha Harshen Hausahaw Ōlelo Hawaiʻiiw עִבְרִיתhi हिन्दीhmn Hmonghu Magyaris Íslenskaig Igboid Bahasa Indonesiaga Gaeilgeit Italianoja 日本語jw Basa Jawakn ಕನ್ನಡkk Қазақ тіліkm ភាសាខ្មែរko 한국어ku كوردی‎ky Кыргызчаlo ພາສາລາວla Latinlv Latviešu valodalt Lietuvių kalbalb Lëtzebuergeschmk Македонски јазикmg Malagasyms Bahasa Melayuml മലയാളംmt Maltesemi Te Reo Māorimr मराठीmn Монголmy ဗမာစာne नेपालीno Norsk bokmålps پښتوfa فارسیpl Polskipt Portuguêspa ਪੰਜਾਬੀro Românăru Русскийsm Samoangd Gàidhligsr Српски језикst Sesothosn Shonasd سنڌيsi සිංහලsk Slovenčinasl Slovenščinaso Afsoomaalies Españolsu Basa Sundasw Kiswahilisv Svenskatg Тоҷикӣta தமிழ்te తెలుగుth ไทยtr Türkçeuk Українськаur اردوuz O‘zbekchavi Tiếng Việtcy Cymraegxh isiXhosayi יידישyo Yorùbázu Zulu