• Skip to main content
  • Skip to footer
  • Home

The May 13 Group

the next day for evaluation

  • Get Involved
  • Our Work
  • About Us
You are here: Home / Archives for allblogs

allblogs

Aug 24 2022

The Reporting Revolution – Virtual Book Launch Party & Book Tour

The proof copy is on its way and if everything goes right, I will have The Reporting Revolution up on Amazon next week. So what now? It’s time for a party!

The Reporting Revolution Book Launch Party Flyer

First, Thank You!

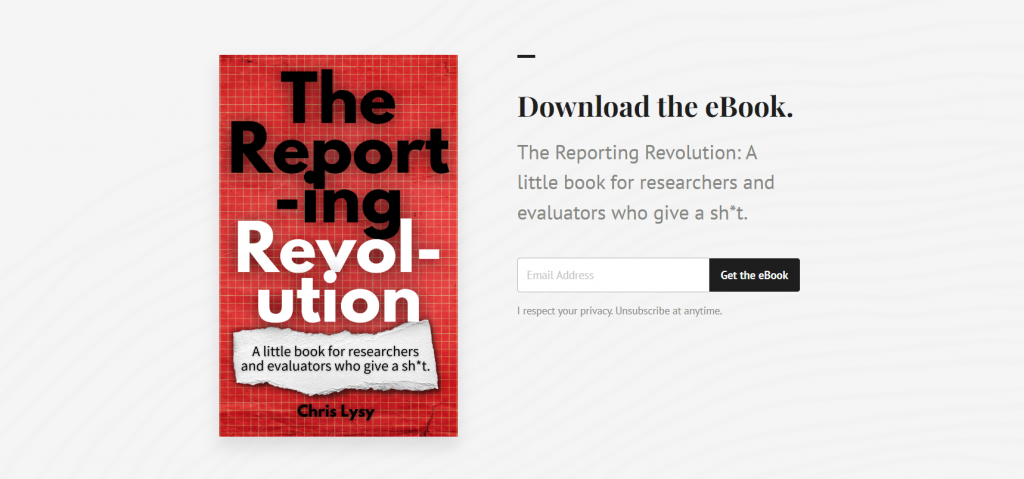
All told over 450 of you downloaded a free draft version of the book. I decided to share the book before it was finished because I knew it would help drive me to write, heighten my audience focus, and receive some good feedback.

I was not wrong.

The support and interest definitely helped me bring this book to market lightning fast.

Virtual Book Tour

This fall I want to have a modern virtual book tour and I could use your help.

I would like to virtually visit with:

  • Local Association Groups
  • Non-profits
  • Evaluation Classrooms
  • Evaluation Agencies
  • Podcasts (as a guest)
  • Blogs (as a guest poster)
  • and anywhere else where I can talk to at least a handful of interested evaluators and researchers.

(I bring my own Zoom room but can also use your own meeting platforms)

If you’re interested please send me an email (chris @ freshspectrum.com), message me on LinkedIn, or DM me on Twitter (I have opened up access so you can DM me even if we don’t follow each other).
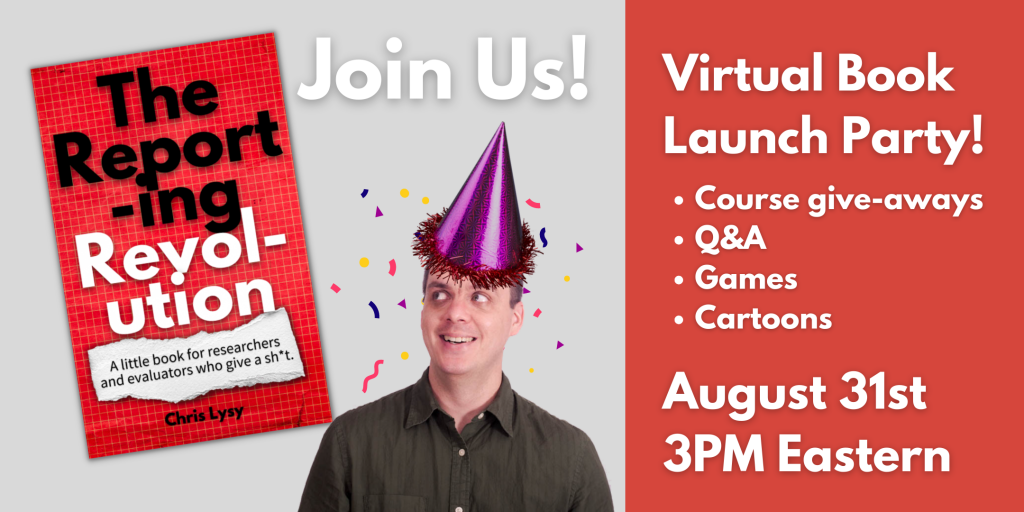
Launch Party

Next Wednesday I’m having a book launch party. We’ll have fun with a Q&A, games, cartoons, and course/consulting giveaways worth hundreds of dollars.

If you think you can make it, Please RSVP. You have to show up to win prizes.

Register on Eventbrite

Written by cplysy · Categorized: freshspectrum

Aug 24 2022

Try This: Assess Staff & Board Buy-In

Try this and let me know how it goes for you. This post is a follow up to What’s in it for Me? Evaluating Stakeholder Engagement, where I shared, “If [the question] “What’s in it for me?” sounds self-serving, it’s because it is. In order to increase engagement, communities and the people driving the actions […]

The post Try This: Assess Staff & Board Buy-In appeared first on Nicole Clark Consulting.

Written by cplysy · Categorized: nicoleclark

Aug 22 2022

When a Course is More Than a Course: 3 Ways “Great Graphs in Excel” Was Beyond Graphs

Last year, I finally enrolled in the Great Graphs in Excel course. After 2 years of thinking about it. And thinking I’m retired and I don’t really make graphs anymore. But I knew I had 10 years of mentoring data I wanted to analyze by the end of 2021.

Beyond Graphs 1: I made a Great Graph after just a Few Course Modules

Soon after the course started, I brought Ann data about who connected with me on LinkedIn after I was listed as one of Nick Martin’s 9 Amazing Humans to Follow. Nick has a HUGE network and I got over 69 connection requests in the first day. And requests continued for more than a week!

So I made a graph to go with a post on LinkedIn, applying all the learnings from the first few course modules.

Sue Griffey's horizontal bar chart showing the number of LinkedIn connection requests she received each day.

Beyond Graphs 2: 2 Things I Learned in 10 Minutes of Help in 1 Office Hour Session

I examined the few data variables on the LinkedIn connection requests. My impression was validated. Only 2 of 136 requests had a personalized message (despite LinkedIn experts emphasizing the need to personalize connection messages).

I tried different ways to display this finding (waffle chart, pie chart, and this one). Luckily, Office Hours were the next day. (Office Hours are a CAN’T MISS opportunity for immediate feedback!)

Sue Griffey's donut chart with miniature people icons in the center.

Ann took one look and exclaimed, “Ooh, let’s try the WeePeople font!” (Well, maybe not exactly like that!)

She then quickly used WeePeople to show the data.

Learning 1: More relevant and representative visuals with icons showing diverse silhouettes

Sue Griffey's icon array showing 136 tiny human-shaped icons.

(Hooray – No more using just the standard male icon.)

And then Ann taught us all how to make a gif which was even more effective at telling the “only 2 of 136 people” story.

Learning 2: Using a gif can give readers a quick result from your data

Sue Griffey's animated icon array showing that she received 136 connection requests on LinkedIn, but only 2 included a personalized message.

And, for those who follow LinkedIn stats to see how their posts engage, the post with the bar graph got 4,765 impressions and the 2nd post (the next day) with the gif got 8,778 impressions!

Beyond Graphs 3: Now I’m Applying a Mental Checklist to Graphs and Charts

No – not only to the few graphs I’m making.

The course taught me and heightened my awareness to look at all the visual elements in the many graphics we see each day. There was so much learning from the course modules. And then many great opportunities in Office Hours to learn from what others were working on.

Here are things I find I am automatically looking for in these graphics:

  • Color choice(s)
  • Is it a Traditional or Storytelling title?
  • The clarity of the data message
  • Is the graph or chart the best for that message and the data being used?
  • What elements could be removed for better clarity?

And a Beyond Graphs Bonus: Consistency and Efficiency

I consider myself a digital pioneer. But I didn’t know what I didn’t know, even being a longtime Word, PowerPoint, and Excel user.

I jumped into the course, and my efficiency increased in the first week! The course started – not with graphs – with ensuring basics including branding by setting my color and font defaults.

And then, a couple weeks later, I set up branding for a 3-part seminar series I did for Waey, the Association for Community Health in Saudi Arabia.

A screenshot of the Theme Colors that Sue Griffey set up in her Microsoft products.

And I now have the consistency across Excel, Word, and PowerPoint and across my different PCs. What a difference!

This is just the tip of the iceberg of everything I am doing differently after Great Graphs – Excel!

Ann’s wise counsel and breadth of experience shared unstintingly!  

Connect with Sue Griffey

LinkedIn: https://www.linkedin.com/in/suegriffey/

Twitter: @SueMentors

Youtube: https://www.youtube.com/channel/UC-rjWX4ZmTdo0S3ssKbut_A

SueMentors Resources: https://suegriffey.fyi.to/suementors-resources-for-your-professional-presence

A no-cost short course: Build and Update Your Professional Presence in 4 Steps at this page: https://www.linkedin.com/company/4-steps-to-build-update-your-professional-presence

Written by cplysy · Categorized: depictdatastudio

Aug 18 2022

Last Chance to Download – The Reporting Revolution

I think the book is done. Depending on the response, there may be a second book to follow-up this one. But for now, I’m done writing.

In 5 days, on August 23, I will taking the free download offline as I prepare the book for publication. But until that day, you can download the book for free using the following link.

The Reporting Revolution: A little book for researchers and evaluators who give a sh*t.  
Screenshot of the eBook landing page.

Click here to go to the download page.

Here is what’s inside currently as of August 18:

  • Introduction – A Little Story
  • Chapter 1. The Big Why
    • Why are we still reporting like it’s 1999?
    • Our reports tell everyone else a story about our profession.
    • Seeing our work through our audience’s eyes.
    • Unintentional gatekeepers.
    • Mindset change – Noun report to verb report.
    • Not just better, faster too.
    • Make it easy.
  • Chapter 2. Finding Your Audience
    • Who is in your audience?
    • Activity: Naming your Audience
    • Your Big 3 Audiences
    • Activity: Three Bucket Audience
    • The Audience Growth Saturation Point
    • Audience Reach Splash Model
    • Measuring your Audience
    • Audience Building or Serving?
  • Chapter 3. Developing YOUR Modern Reporting Strategy
    • Rule #1 – Everyone is overwhelmed.
    • Activity: The Overwhelmed Reader
    • The Default Reporting Strategy
    • Activity: What is Your Organization’s Reporting Strategy?
    • Towards a Practical Strategy
    • 1:3:25 Strategy
    • Flagship Report Strategy
    • Comprehensive Blog + Social + Email Strategy
    • Audience Borrowing Strategy
    • Email Newsletter Strategy
    • Webinar Series Strategy
    • Learning Community Strategy
    • Creating a YOU Strategy
  • Chapter 4. Building YOUR Report Design Systems
    • The HiPPO Problem
    • Activity: Finding the HiPPO
    • Developing your Design Process
    • Reducing HiPPO Problems
    • The Status Quo Problem
    • The Power of Double Delivering
    • Choosing your Reporting Software Stack
    • Your Modern Software Stack
    • Creating a Simple Style Guide
    • Report Writing, Report Design, and Report Illustration are Three Different Steps
    • Developing an Asset Library
    • Building out Templates
  • fin – A Call to Action
    • If Not You, Then Who?

Written by cplysy · Categorized: freshspectrum

Aug 17 2022

Let’s Build a Partnership

Recently, the Association of Social Work Boards (ASWB) published data on the 2022 pass rate for the ASWB licensing exam. The analysis concluded major disparities in pass rates for Black test takers, older adults, and other marginalized groups. The data were published as a result of years of advocacy and pressure from the National Association […]

The post Let’s Build a Partnership appeared first on Nicole Clark Consulting.

Written by cplysy · Categorized: nicoleclark

  • « Go to Previous Page
  • Go to page 1
  • Interim pages omitted …
  • Go to page 118
  • Go to page 119
  • Go to page 120
  • Go to page 121
  • Go to page 122
  • Interim pages omitted …
  • Go to page 310
  • Go to Next Page »

Footer

Follow our Work

The easiest way to stay connected to our work is to join our newsletter. You’ll get updates on projects, learn about new events, and hear stories from those evaluators whom the field continues to actively exclude and erase.

Get Updates

Want to take further action or join a pod? Click here to learn more.

Copyright © 2026 · The May 13 Group · Log in

en English
af Afrikaanssq Shqipam አማርኛar العربيةhy Հայերենaz Azərbaycan dilieu Euskarabe Беларуская моваbn বাংলাbs Bosanskibg Българскиca Catalàceb Cebuanony Chichewazh-CN 简体中文zh-TW 繁體中文co Corsuhr Hrvatskics Čeština‎da Dansknl Nederlandsen Englisheo Esperantoet Eestitl Filipinofi Suomifr Françaisfy Fryskgl Galegoka ქართულიde Deutschel Ελληνικάgu ગુજરાતીht Kreyol ayisyenha Harshen Hausahaw Ōlelo Hawaiʻiiw עִבְרִיתhi हिन्दीhmn Hmonghu Magyaris Íslenskaig Igboid Bahasa Indonesiaga Gaeilgeit Italianoja 日本語jw Basa Jawakn ಕನ್ನಡkk Қазақ тіліkm ភាសាខ្មែរko 한국어ku كوردی‎ky Кыргызчаlo ພາສາລາວla Latinlv Latviešu valodalt Lietuvių kalbalb Lëtzebuergeschmk Македонски јазикmg Malagasyms Bahasa Melayuml മലയാളംmt Maltesemi Te Reo Māorimr मराठीmn Монголmy ဗမာစာne नेपालीno Norsk bokmålps پښتوfa فارسیpl Polskipt Portuguêspa ਪੰਜਾਬੀro Românăru Русскийsm Samoangd Gàidhligsr Српски језикst Sesothosn Shonasd سنڌيsi සිංහලsk Slovenčinasl Slovenščinaso Afsoomaalies Españolsu Basa Sundasw Kiswahilisv Svenskatg Тоҷикӣta தமிழ்te తెలుగుth ไทยtr Türkçeuk Українськаur اردوuz O‘zbekchavi Tiếng Việtcy Cymraegxh isiXhosayi יידישyo Yorùbázu Zulu