• Skip to main content
  • Skip to footer
  • Home

The May 13 Group

the next day for evaluation

  • Get Involved
  • Our Work
  • About Us
You are here: Home / Archives for allblogs

allblogs

Jun 13 2022

Three Metrics for Design Evaluation

Design is about the creation of products, services, policies, and systems for use and benefit. It’s a structured, creative process that shapes what we do, how we do it, and what impact we create. Design is fundamentally about innovation: doing something different or new for benefit within a context.

Inspiration, Utility, and Values

How should we measure design and its impact on our organization? We suggest three core evaluation metrics above all to consider.

  1. Inspiration. A design has to inspire you. If you’re not excited about what you’re producing, why would it inspire your clients, customers, or users? By inspiration, we mean that it must capture or focus attention, delight, or attract energy. It does not mean a design has to be glamorous, just that it’s noticed for its purpose or appropriately invisible. For example, creating a negative opt-in to organ donation on driver’s license renewal forms vastly increases the donor pool (and reflects the desire of the population to be donors in the process) because it means people have to choose not to donate, rather than the opposite. Even with something benign like a form adjustment, Inspiration is an outcome.
  2. Utility. Use is the second key metric. Design is about being fit for purpose and if there is a poor fit then the benefits will also be poor. A great design fits the purpose for what it was designed for and is useful. It doesn’t have to be the best, just useful and better than the available alternatives. If your design is not used, then no matter how functional, attractive, or conceptually sound it is, it is a failure.
  3. Values. The alignment of your design with the values of your organization is critical to ensuring that the benefits that you accrue are the ones you want. If you value sustainability and responsibility, then your design has to reflect that. To illustrate, if you’re a company or organization that stands for human rights and ethical practices, what you produce (your designs) needs to reflect that. We see a lot of problems with organizations that say one thing and then design for something else.

From Perfection to Fit

There are no ‘perfect’ designs. A design is made within a time and context and the value and benefit of that design will change over time as the context changes. Even if we want things to stay the same and stable, the world around our designs is changing and evolving. Designs are also made with constraints posed by resources, time, and circumstances. However, design is designed — your process and procedures need to aspire and be set up to achieve the results you’re looking for.

These changes are why evaluation is such an important part of design: we need to continue to monitor and evaluate our designs in light of changes in context and circumstance.

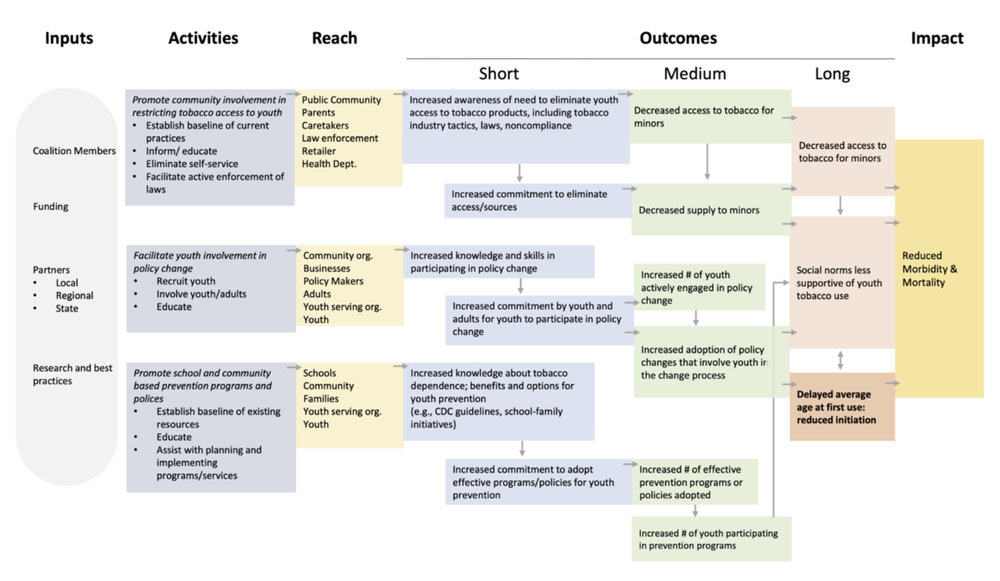
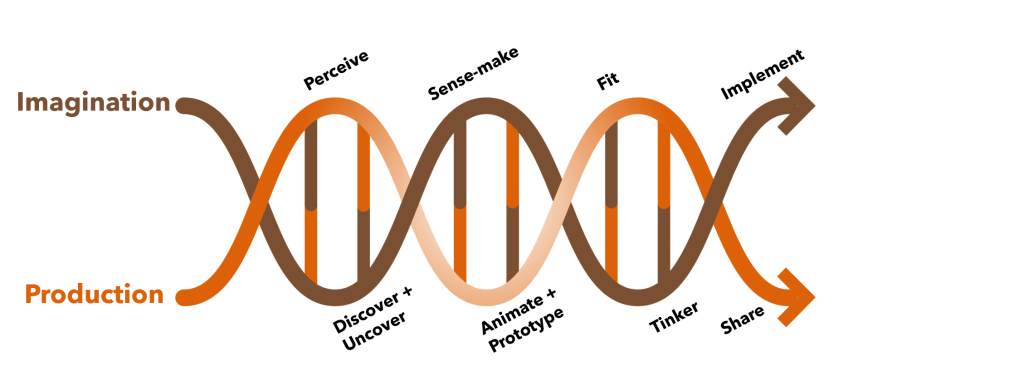
We can’t hope for inspiration, utility, and alignment with values unless we design our designs to match that. Models like the Design Helix (below) can provide some guidance on what can be done to facilitate this.

The process of design and innovation is part art and part science. If you’re looking to design better — whether it’s to improve your products and services, make better policies, or build a culture of innovation we can help. Let’s talk.

Photo by Annie Spratt on Unsplash

The post Three Metrics for Design Evaluation appeared first on Cense Ltd. .

Written by cplysy · Categorized: cameronnorman

Jun 10 2022

Differences between Theory of Change, Log Frames, Results Frameworks and Logic Models – what are they and when to use them

In some of our previous articles, we’ve introduced and explained how to use different evaluation planning tools for identifying and assessing outcomes. You might have noticed how there seem to be quite a few tools doing very similar things. It’s no surprise that these tools can sometimes be confused, and the lines can be blurred around when and how to use them.

To help you on your way to deciding which tool is best suited to your evaluation, we’ve selected a few of our favourites to compare and contrast. These tools include: 

  • Theory of Change (ToC) 

  • Log Frames 

  • Results Frameworks 

  • Logic Models 

There are some common points across all of the available tools: 

  • All tools provide transparency and a visual explanation for why your program is expected to contribute to change 

  • All tools can help to track progress towards a specific objective 

  • All tools can be used at both the planning and evaluation stages of a program 

  • All tools are living documents and should be reviewed throughout the program lifespan 

  • All tools are time-consuming to develop, but to differing extents; they all require some reflexivity and strategic thinking to develop 


Theory of Change (ToC)

What 

  • Explains how a set of activities will solve a problem through a diagram often made up of boxes and arrows 

  • Goes into more detail by explaining the why also known as the “casual logic;” i.e., why one step is expected to lead to the next

Why 

  • Explanatory and best suited to complex programs that are influenced by multiple systems 

  • By defining long-term goals and then mapping backwards to identify necessary preconditions, ToC can provide the basis for arguing that a program is making a difference whilst identifying weaknesses in the argument and providing the opportunity to make changes 

When 

  • Can be used to both design and evaluate programs 

  • Can be developed at any stage of an intervention 

  • ToCs are living documents and should be flexible to the program’s needs and any changes happening on the ground

Strengths 

  • ToCs capture unintended and unexpected results 

  • Provides a reporting framework and identifies what data need to be gathered to test the theory 

Weaknesses 

  • Can be challenging and time-consuming as it involves facilitating collaboration with all key stakeholders, synthesizing a range of views and information sources, as well as obtaining agreement and buy-in from stakeholders

Log Frames

What 

  • Focused on how you will get to your program’s goal 

  • Usually presented as a matrix which structures the main activities in a program, highlights the logical connections between them, and identifies what these activities are expected to achieve 

Why 

  • Descriptive and better placed for small to medium sized projects

  • Log Frames help you to think about the relationships between available resources, planned activities, and the desired changes or results

When 

  • Most Log Frames are developed during program design and are updated throughout the program’s life span 

  • Like ToCs, Log Frames are not set in stone and should be flexible to the program’s needs

Strengths 

  • It ensures objectives are clear and measurable 

  • It ensures concrete evidence for a program’s achievement is collected 

  • Because risks and assumptions are made explicit, problems can be analyzed systematically 

Weaknesses 

  • It is a “one size fits all approach” which does not always capture the complexity and context of a program 

  • Don’t easily capture the how and why in the same way a ToC does

Results Frameworks

What 

  • Often in the form of a matrix that links activities with outcomes and results that directly relate to the objectives

  • Captures the essential steps of the logical and expected cause and effect relationship within a program

Why 

  • Focus on explaining the program’s results

  • It helps achieve strategic objectives i.e., the ultimate driver of the program by showing where resources could be best leveraged

When 

  • Useful as part of a strategic planning process

  • Is a living management document to support consensus, guide course correction, and serve as an accountability framework for evaluation

Strengths 

  • Helps identify and focus on specific, high leverage outcomes

  • Helps establish an evidence-based approach to monitoring and evaluation

  • Helps measure progress towards strategic objectives

Weaknesses 

  • The effects of interventions can be difficult to fully measure as unintended consequences and external influences are not captured. This can lead to a risk of tunnel vision

Logic Models

What 

  • Usually presented in a flow chart (not a matrix)

  • Logic models visually summarise how a program is expected to work by listing: what resources will be used, what activities will be completed, and how the activities will lead to outcomes

Why 

  • Logic models reveal intention, assumptions, and rationale behind a program

  • Logic models are useful to support stakeholders to think through and understand why a program is expected to lead to change

When 

  • In the planning phase, logic models can help to shape program strategies, set priorities, and illustrate approaches to stakeholders

  • During program implementation, logic models can support accountability

Strengths 

  • Builds a common understanding of goals, processes, and expectations for resources 

  • Can help to explain the need for a program to the community, organization, or funder 

  • Known for their easy-to-use format 

Weaknesses 

  • Don’t capture unintended or unexpected results

  • Don’t capture causality

  • While some logic models capture contextual factors and assumptions, they are often high-level and don’t look at each specific step within the change process


Theory of Change (ToC)

Main Components:

  • Activities 

  • Outputs 

  • Outcomes 

  • Impacts 

  • Purpose statement 

  • Impact pathways 

  • Description of the causal logic 

  • Description of the key actors 

  • Description of the indicators 

  • Assumptions (the factors outside of the program’s control that are necessary to ensure the program’s success) 

Description of alternative explanations and external factors (i.e., the different ways that may lead to change that are not related to your program) are often included in the narrative. 

Log Frames

Main Components:  

  • Main Goal  

  • Outputs 

  • Outcomes  

  • Activities  

Log Frames may also include indicators of how you will measure change and risks or assumptions underlying the change 

Results Frameworks

Main Components:  

  • Activities 

  • Outcomes (intermediate and longer term) 

  • Impacts (longer term) 

  • Outputs 

  • Indicators 

  • Critical assumptions and risks that must be in place for the intervention to be successful 

Results frameworks are often accompanied by a monitoring plan which includes baseline values and targets for expected outcomes and specifies the measures of achievement 

Logic Models

Main Components:  

  • Goals 

  • Inputs 

  • Activities 

  • Audience 

  • Outputs 

  • Outcomes 


Have you worked with any of these models before, or do you notice one that’s missing from our list? Comment on this article or connect with us on LinkedIn or Twitter! 


Sign up for our newsletter

We’ll let you know about our new content, and curate the best new evaluation resources from around the web!


We respect your privacy.

Thank you!


Sources: 

  • Belcher, B., Davel, R., & Claus, R. (2020) “A refined method for theory-based evaluation of the societal impacts of research”.  MethodsX. 7(1). Available from: https://www.sciencedirect.com/science/article/pii/S221501612030008X  

  • Hearn, S. (2009) “Outcome Mapping: Monitoring and Evaluating Policy Influencing” Presentation for Overseas Development Institute. Available from: https://www.slideshare.net/sihearn/om-for-policy-influencing  

  • Mitroff, I., & Bonoma, T. V. (1978). Psychological assumptions, experimentation, and real-world problems: A critique and an alternate approach to evaluation. Evaluation Quarterly, 2(2), 235–260. Available from: https://doi.org/10.1177/0193841X7800200204  

  • Nkwake, A.M. (2012) Working with Assumptions in International Development Program Evaluation: With a Foreword by Michael Bamberger. Springer Science & Business Media: Berlin, Germany.  

  • Stein, D., & Valters, C. (2012) “Understanding Theory of Change in International Development”. Justice and Security Research Programme at the London School of Economics and Political Science. Available from: http://eprints.lse.ac.uk/56359/1/JSRP_Paper1_Understanding_theory_of_change_in_international_development_Stein_Valters_2012.pdf  

  • Jones, N. D., Azzam, T., Wanzer, D. L., Skousen, D., Knight, C., & Sabarre, N. (2019). Enhancing the Effectiveness of Logic Models. American Journal of Evaluation, 1098214018824417. https://doi.org/10.1177/1098214018824417 


Written by cplysy · Categorized: evalacademy

Jun 10 2022

What program managers need to share with their new evaluators

Evaluators – this one’s not for you, but maybe you can share it with some clients! 

As a program manager or project lead, you may find yourself needing an evaluator. How do you get that evaluator oriented to the project? What information do they need? Let’s walk through it. 

Hopefully your new evaluator has a few questions to kick things off. Usually things like “What is the purpose for needing an evaluation? How will the information be used? What do you need answers to?” You might even sit down for an engagement meeting to answer most of those questions. This is my job. I do this on repeat. And yet no matter how I try to harvest all the important information from the key stakeholder group, I still find that I’m often missing core pieces of information when I set out to develop my evaluation plan. Key information tends to trickle out in bits and pieces over the initial weeks or even months. So, I thought it might be helpful to compile a list of what makes the new evaluator orientation and planning process as efficient and effective as possible. 

Here’s a checklist of things every program manager should share with (or tell) their evaluator:


  1. Describe the program.

    This sounds obvious, but you’d be surprised how often the people that hire me don’t start with a clear overview of what the program is! Be prepared to describe, from start to finish, what it is you do or what service you offer and who you serve. 

    TIP: Share any documentation you have, including project proposals, grant applications, or work plans. Include a description of who’s who in the zoo: what are the key roles.

  2. Has the program been evaluated before?

    If yes, share previous: 

    • Evaluation plans 

    • Evaluation reports 

    • Data (if you want year-to-year comparison, for example) 

    • Logic models or Theories of Change 

    TIP: It can be helpful to share what you liked or didn’t like about your previous evaluations and reports – what missed the mark? What was really helpful? What do you want this new evaluator to do differently or the same?

  3. A description of current data collection processes.

    Ideally this would be documented but I’ve yet to find a program that has this (and have found myself creating process maps myself for the complicated programs). In the very least, be prepared to share a verbal description of how things work. For example: 

    “When a participant expresses interest in our program, they sign a consent form (here’s a copy) and fill out a baseline survey (here it is). Then they attend a weekly workshop for 2 months. We keep an attendance list (like this). Then there is a post workshop session survey (here it is).” 

    Note that sharing the current data collection tools is critical. 

    TIP: It can be helpful to share what’s working or not working about data collection. For example: “We really struggle to get a decent response rate on our post workshop survey.” Or “We collect those attendance sheets, but we have no use for them, they just get recycled!” Even detailed insights can help “On our survey, the age ranges we offer aren’t a great reflection of our clients.” or high-level reflections “We have no ability to match data between two very important data sets”. 

  4. Funder and reporting requirements and timelines.

    Do you have mandatory reports due? Even if you don’t intend to have the evaluator write them for you, be clear about who is contributing to what and what the timelines are. Often the evaluator can time data collection to be ready for your annual, quarterly or interim reports. They can certainly help you out by ensuring that key metrics or key success factors are captured and ready for you. So even if writing the report(s) is beyond the scope of the role you want the evaluator to play, it can be helpful to share these anyway. 

    TIP: Documenting who is responsible for what in mandatory reporting is very helpful. You could ask your evaluator to contribute to certain sections, contribute data, or plan to use the evaluation report as an appendix to the required reporting template.

  5. Who are the decision-makers?

    Is there a program steering committee or advisory group? Perhaps there is even an evaluation advisory committee that is disbanded or defunct? Share these details with your evaluator so (a) they can ensure their reporting is prepared for the appropriate audience(s) and (b) they know who to go to for important decisions – like signing off on the evaluation plan.

    TIP: I’ve found it to be effective when a program has a core group of no more than 5 people who provide input into an evaluation. Five seems to be able capture enough diverse perspectives, but with more than this it gets hard to convene for key discussions (and timelines get pushed out).

BONUS TIP: Be prepared to answer key evaluator questions. 

I get that it can be difficult to come up with great insights on-the-spot – so don’t! If you have an evaluation meeting coming up, try to carve out even 15 – 30 minutes in your schedule to prepare for it.

Be prepared to describe why you want this evaluation, what questions you have about your program and how you plan to use the information.

Consider reviewing your program material – work plans, proposals, previous evaluation reports, even meeting minutes.  Were there key questions posed by program stakeholders or partners? Take a few minutes to reflect: If I could know anything, what would I want to know about this program? It could be about the way it’s run, about the impact it has, or about the effectiveness or efficiency of it. 


Evaluators want to provide you with information that is valuable, relevant, and actionable! Setting them up with the right information makes it more likely that you will find value in the role. 

Do you need help with an evaluation? Reach out to one of our Evaluation Coaches to get started. Or perhaps you’re looking to commission an evaluation. We’ve got some great tools to help you there, too! Take a look at our recommendations for what to include in your Evaluation RFP and a checklist to make sure you’ve got it all covered. 


Sign up for our newsletter

We’ll let you know about our new content, and curate the best new evaluation resources from around the web!


We respect your privacy.

Thank you!


Written by cplysy · Categorized: evalacademy

Jun 09 2022

How to create a timeline infographic using Canva.

Looking for an infographic that is easy to write and design? This post will you through the process of creating a timeline infographic from scratch using Canva. I’ll also include the final templates at the end of this post.

Here is what I will design – “Our Project Timeline”

This is just a simple timeline, nothing too fancy with only so many text blocks. The text blocks are fairly large (at 18pt font). So if you wanted a busier timeline with more blocks, there is certainly room if you drop the text size a bit.

Timeline Infographic Concept created in Canva - Screenshot

Step 1. Choose your base size.

Canva’s infographic templates are all based on a size of 800 by 2000 px. That’s a fine size if you are only sharing on the web and want a portrait style infographic.

If you plan to print your infographic, I would suggest creating with a standard paper size. Most professional office printers can easily print up to 11 inches by 17 inches (or A3 if you are going with international sizes).

This tabloid format is kind of cool because it’s like having two letter size pages side by side. You can easily fold it in half and put the infographic into a folder.

Screenshot of creating a custom size infographic in Canva

Step 2. Build your grid.

I like having a basic grid when I start designing. It really helps me arrange things.

In Canva I’ll create that grid by clicking on Elements and searching for “Grids”. These are technically photo grids, but I’m just going to keep them in the back and use them as measuring tools. Later on, after I put in content, I’ll delete the grids.

Screenshot of setting up grids within Canva

Step 3. Add in your timeline.

For my line I’ll simply search for “Lines”.

Choose the line style first, then you’ll be able to change the line weight, color, and end points. I usually place my line in the middle of the page.

Screenshot of adding a line in Canva

Step 4. Putting a Title on the Page.

Next we’ll add a Title. For this we will use the Text menu and Add a heading. Even though I am designing this infographic for print, I still think it will likely be reviewed via a screen most of the time. So I’ll use a pretty large font size (64 pt).

Screenshot of adding a header in Canva

Step 5. Adding a Subtitle.

A sub heading is a great way to keep you from writing too much in your main heading. Use the subheading to setup your infographic for your reader. I’m using a fairly large font size (18pt) for a print piece because, again, I do want it to be readable on a screen.

Screenshot of adding a subheader in Canva

Step 6. Adding your starting and end points.

Now we can start adding blocks of text. For this template I created a block at the beginning and at the end. I also put general dates above the line.

You don’t have to create timelines exactly to scale, but it should it be close.

Screenshot of adding text blocks in Canva

Step 7. Adding content blocks.

You have choices for the content blocks under the line. I kept the font large at 18pt, but if you have more to write you can shrink the size a bit. All sorts of infographics will drop down their text size to 10pt (sometimes less). This all depends on how much content you have to share (and how much you white space you would like to see on the page).

I also added a short by line at the bottom of the page. Most good infographics will send you somewhere at the end of the page where you can find sources or other additional information.

Screenshot of adding additional text boxes in Canva

Step 8. Adding color blocks.

I put a couple of rectangles behind the text at the top and bottom of the page. This creates a bit of differentiation between the heading, main timeline content, and the little footer.

Screenshot of a Canva infographic with colored rectangles used to separate sections

Step 9. Illustrating the text blocks with icons.

Now that we have all the text in the infographic it’s time to illustrate. One of the easiest ways to illustrate is to find icons that pair well with your text blocks. Canva has a ton of icons available through a simple search in the Elements tab (especially if you have Canva Pro).

Screenshot of a timeline infographic with Icons being added

Step 10. Deleting the grids.

Once I have everything on the page, it’s time to drop the background grids, I don’t need them anymore and this lets me see the infographic like it will be seen by the reader.

Screenshot of the timeline after the grids were erased

Step 11. Adding connecting lines.

So I’ll want to connect the text boxes to the appropriate times on the infographic using lines. If an icon is in the way, just click on the line and send it to the back.

At this point we really have a completed infographic and could stop.

Screenshot of the project timeline infographic with additional connecting lines

Step 12. Adding background texture.

Black text on a white background can feel pretty stark sometimes. It has really good contrast but can feel a little too bright for your eyes.

Since the random text I wrote for the infographic had a kind of adventure vibe, I put in a map paper texture in the background. It was a little too dark so I lowered the transparency and added a really light color behind the texture.

Screenshot of project timeline template with added texture.

Step 13. Creating space for a logo.

Finally, I shifted the header and subheader over a little to make room for a logo. Since this is just a fake project, I created a fake logo.

And that’s it, we now have a ready to share completed timeline infographic.

Screenshot of final project timeline infographic template

Start where I finished: grab the template.

Link to the Canva template referred to in this blog post.
Use this link to open the Template in Canva.

BONUS: Template Script

When writing an infographic, especially with a team, the actual template can be a bit of a distraction. In these situations a script can be really helpful. You don’t have to create one in Canva like I did (a simple word document is fine).

But here is an example, the script has all the words you’ll find on the infographic and some additional details. Save it as a PDF and share it with colleagues for comments and cowriting.

Screenshot of the two pages in the timeline infographic script.

Grab the template script worksheet here.

Screenshot of the infographic script template.  Accessible on Canva if you click on this picture.
Use this link to open the worksheet in Canva.

Create an Infographic in an Hour Webinar

Like this tutorial? Sign up for my upcoming webinar, Thursday, June 9 at 2PM EDT.

I’ll be walking you through another example of a quick to create infographic.

Register on Eventbrite

Written by cplysy · Categorized: freshspectrum

Jun 08 2022

What Gets Measured Doesn’t Always Matter

In one of my earlier evaluation projects, I spoke with a program participant, who received a grant from my client organization to use towards a community-based event focused on community-level breastfeeding education. She felt that their event had not been successful because, in her eyes, the event wasn’t well attended. I believe the attendee goal […]

The post What Gets Measured Doesn’t Always Matter appeared first on Nicole Clark Consulting.

Written by cplysy · Categorized: nicoleclark

  • « Go to Previous Page
  • Go to page 1
  • Interim pages omitted …
  • Go to page 125
  • Go to page 126
  • Go to page 127
  • Go to page 128
  • Go to page 129
  • Interim pages omitted …
  • Go to page 310
  • Go to Next Page »

Footer

Follow our Work

The easiest way to stay connected to our work is to join our newsletter. You’ll get updates on projects, learn about new events, and hear stories from those evaluators whom the field continues to actively exclude and erase.

Get Updates

Want to take further action or join a pod? Click here to learn more.

Copyright © 2026 · The May 13 Group · Log in

en English
af Afrikaanssq Shqipam አማርኛar العربيةhy Հայերենaz Azərbaycan dilieu Euskarabe Беларуская моваbn বাংলাbs Bosanskibg Българскиca Catalàceb Cebuanony Chichewazh-CN 简体中文zh-TW 繁體中文co Corsuhr Hrvatskics Čeština‎da Dansknl Nederlandsen Englisheo Esperantoet Eestitl Filipinofi Suomifr Françaisfy Fryskgl Galegoka ქართულიde Deutschel Ελληνικάgu ગુજરાતીht Kreyol ayisyenha Harshen Hausahaw Ōlelo Hawaiʻiiw עִבְרִיתhi हिन्दीhmn Hmonghu Magyaris Íslenskaig Igboid Bahasa Indonesiaga Gaeilgeit Italianoja 日本語jw Basa Jawakn ಕನ್ನಡkk Қазақ тіліkm ភាសាខ្មែរko 한국어ku كوردی‎ky Кыргызчаlo ພາສາລາວla Latinlv Latviešu valodalt Lietuvių kalbalb Lëtzebuergeschmk Македонски јазикmg Malagasyms Bahasa Melayuml മലയാളംmt Maltesemi Te Reo Māorimr मराठीmn Монголmy ဗမာစာne नेपालीno Norsk bokmålps پښتوfa فارسیpl Polskipt Portuguêspa ਪੰਜਾਬੀro Românăru Русскийsm Samoangd Gàidhligsr Српски језикst Sesothosn Shonasd سنڌيsi සිංහලsk Slovenčinasl Slovenščinaso Afsoomaalies Españolsu Basa Sundasw Kiswahilisv Svenskatg Тоҷикӣta தமிழ்te తెలుగుth ไทยtr Türkçeuk Українськаur اردوuz O‘zbekchavi Tiếng Việtcy Cymraegxh isiXhosayi יידישyo Yorùbázu Zulu