How do we make our graphs more accessible?
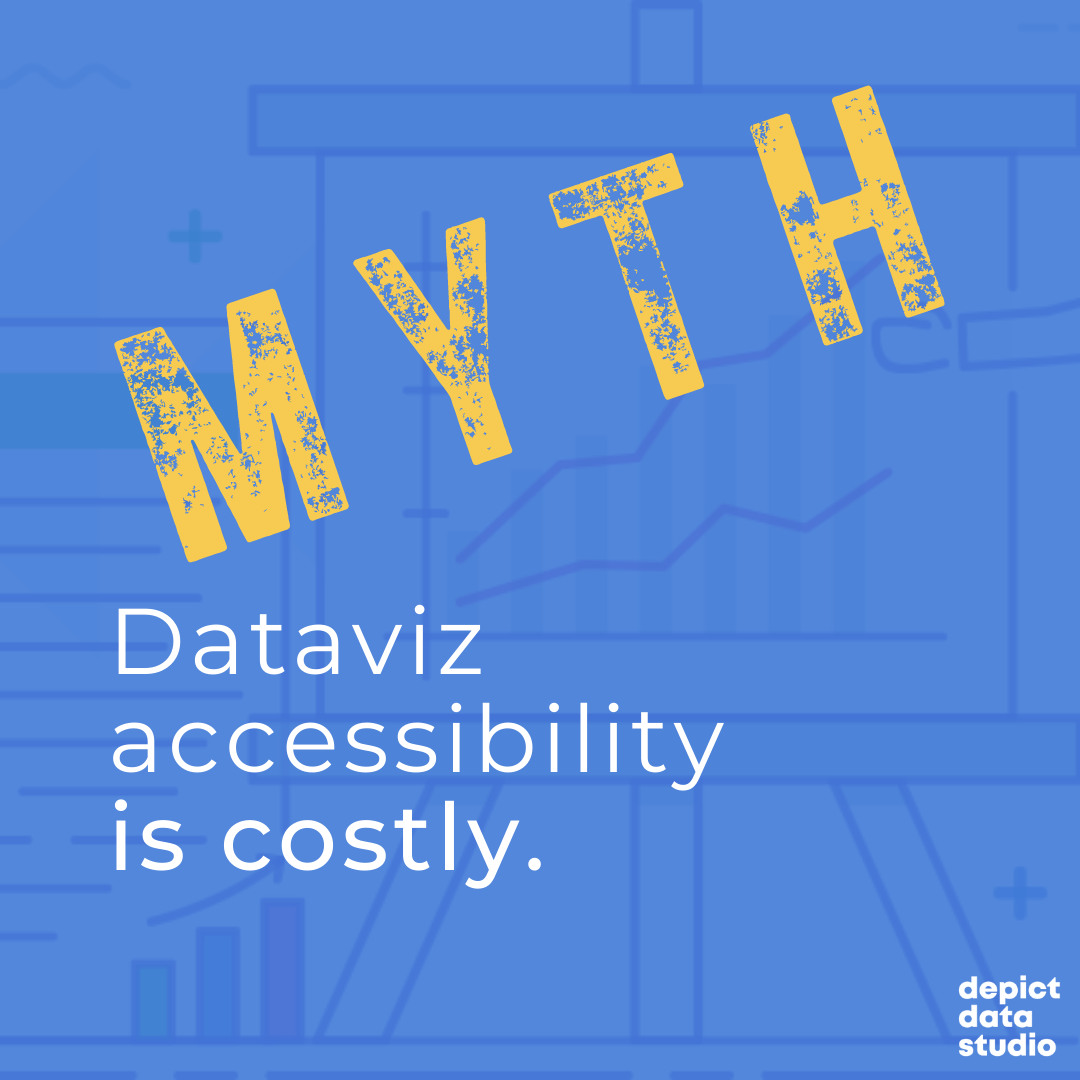
There’s a misconception that accessibility takes all day, that’s it’s costly, or that it’s complicated. Those are all false.
Accessibility is woven into all my trainings, but since this is a topic I get asked about a lot, I decided to make a new talk that’s focused just on accessibility for dataviz.
In Spring 2021 I gave a talk at the Good Tech Fest conference about dataviz accessibility quick wins.
The talk was “Choose Your Own Adventure” style where the audience chose what we discussed from a list of options. They chose:
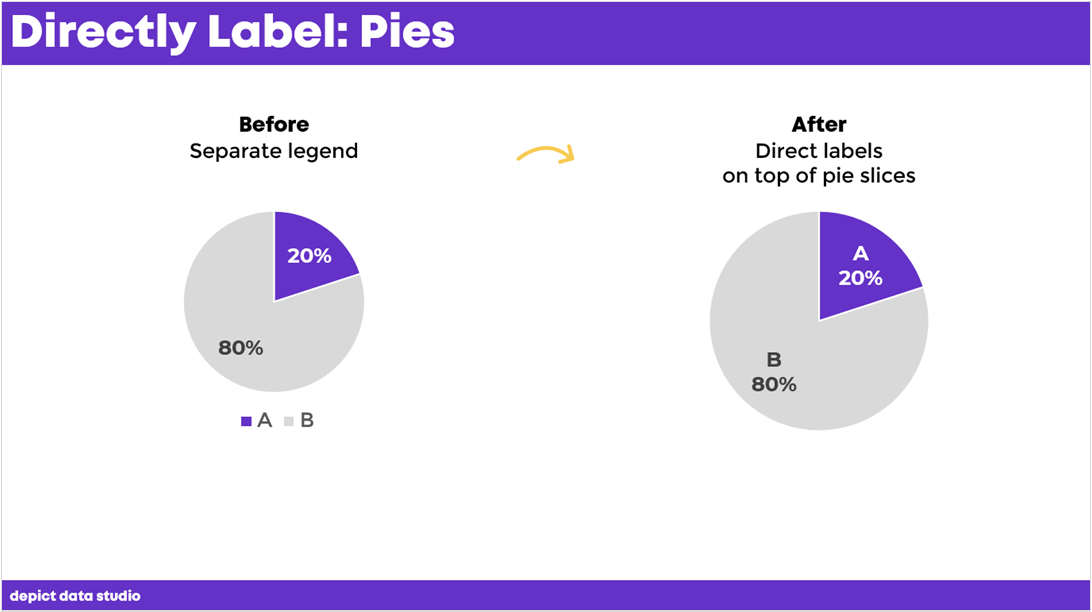
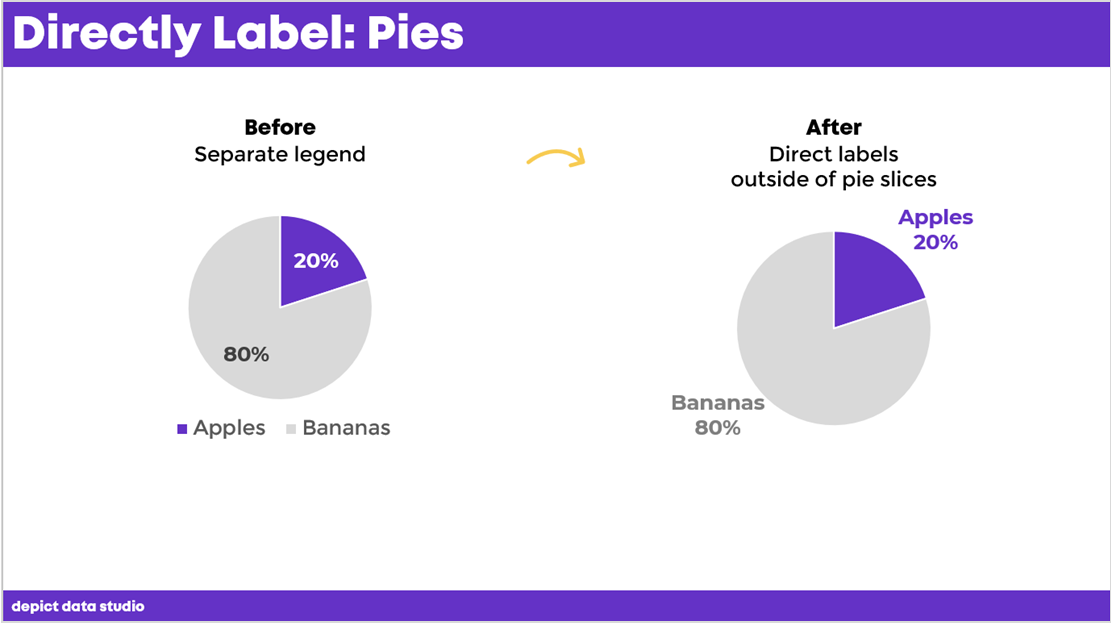
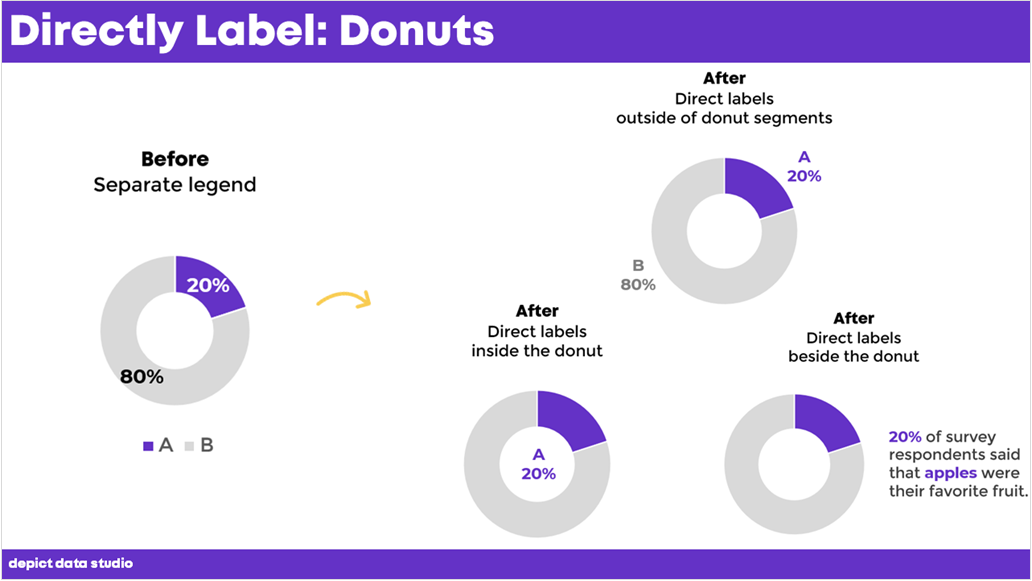
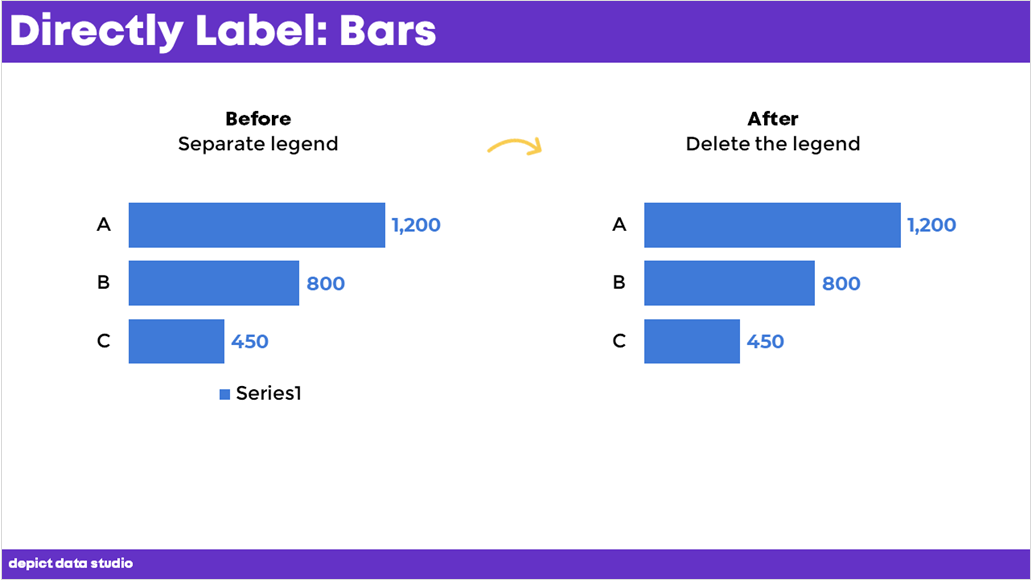
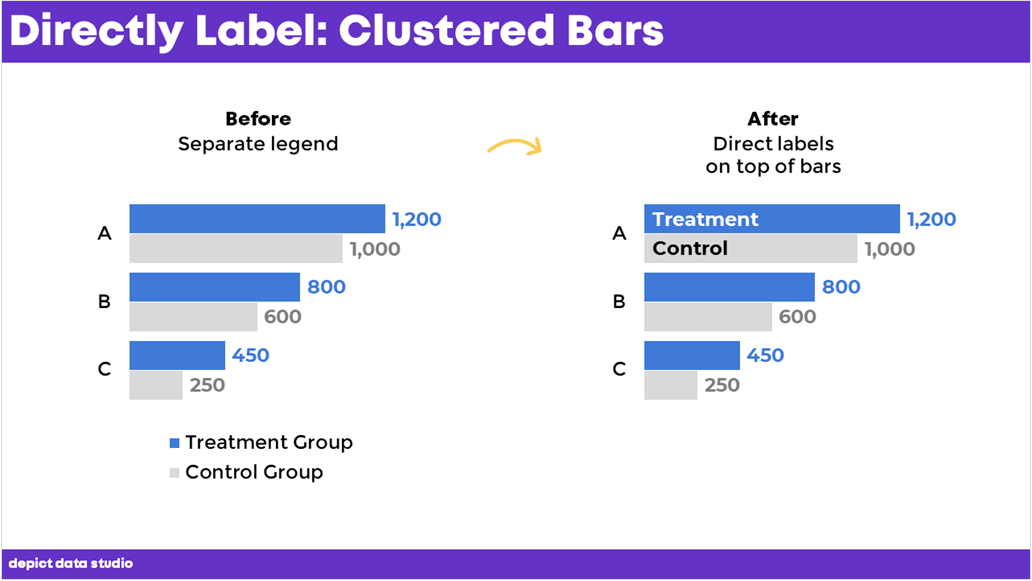
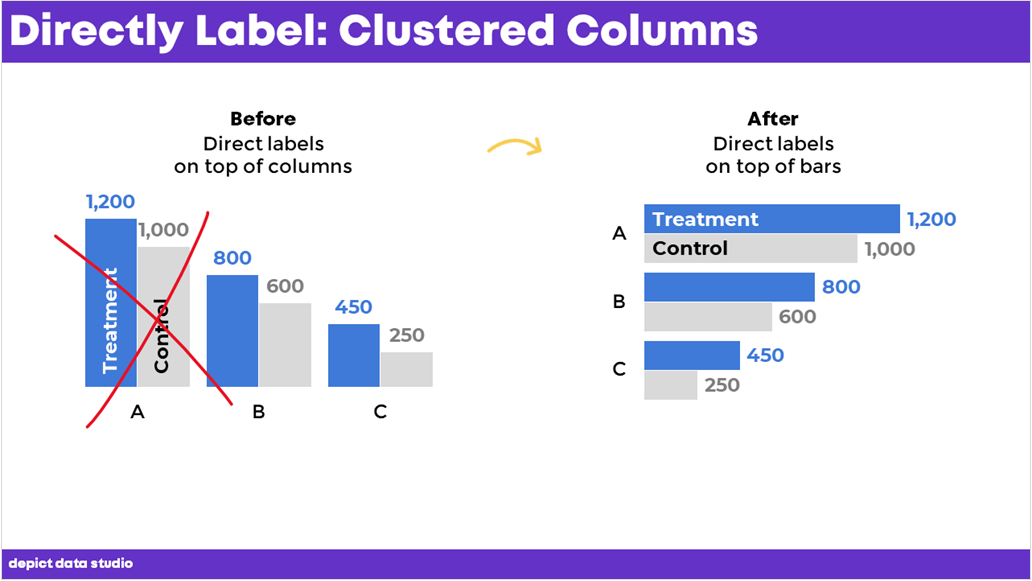
- direct labels,
- lower the reading level, and
- lower the numeracy level.
You can watch the recording or read the highlights. Enjoy!
—–
Watch the Conversation
Why Bother Lowering the Reading Level?!
We’re writing for busy people. The ones who see tons of graphs coming into their inbox every day.
We need to lower the reading level.
Not because our readers dumb, but because they’re busy.
They need to be able to understand what you wrote the first time—not the second, third, or fourth read-through.
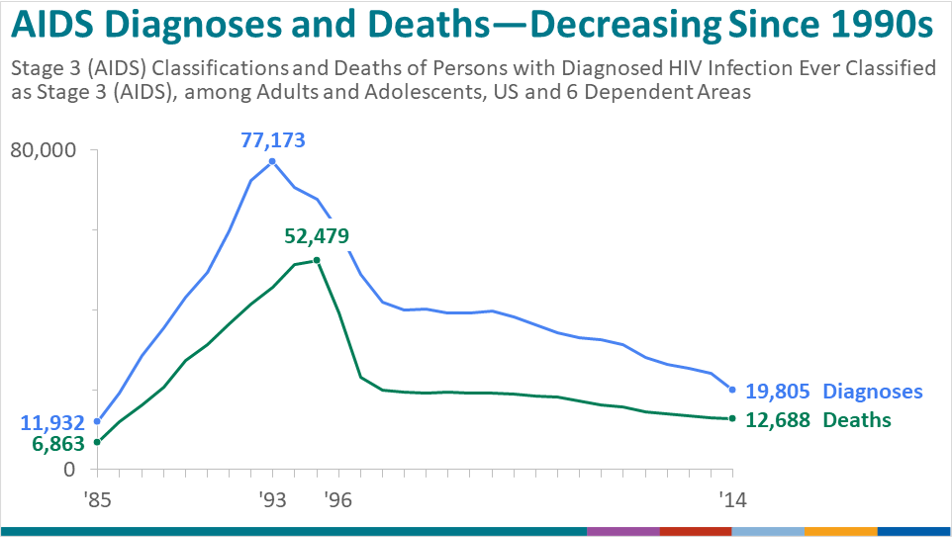
Before: A Dense Slide Title
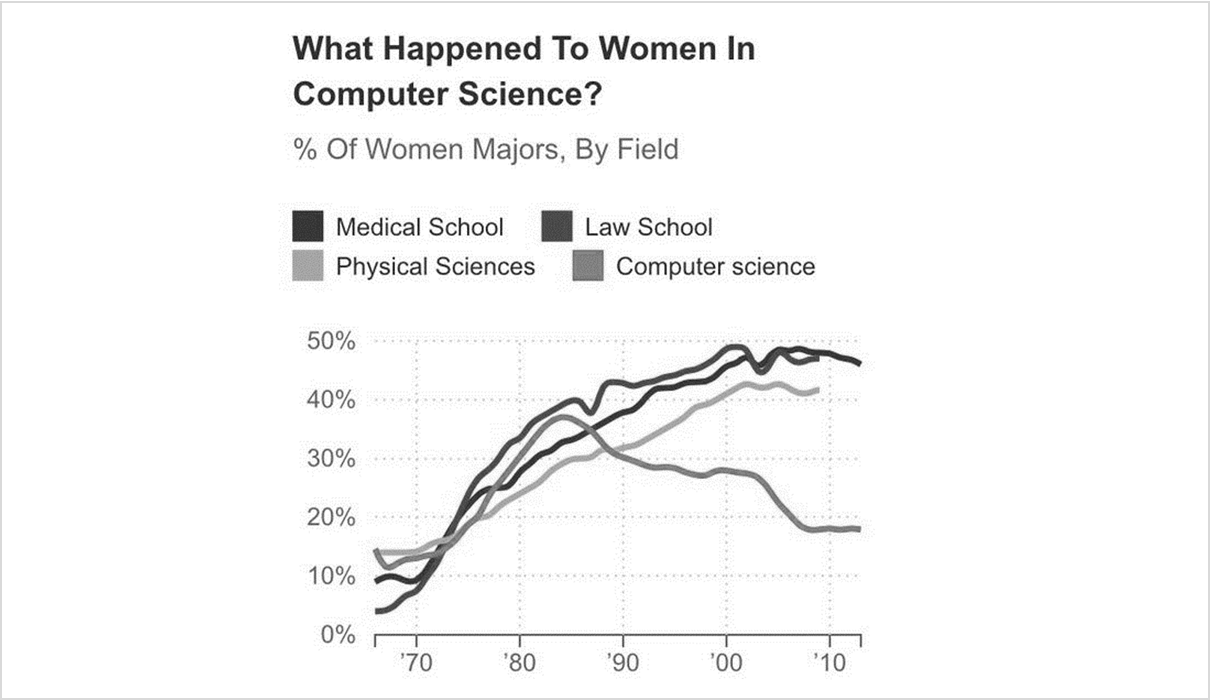
Here is a real-life graph from a public health agency.
I had to read this slide title at least five times to figure out what it was talking about.
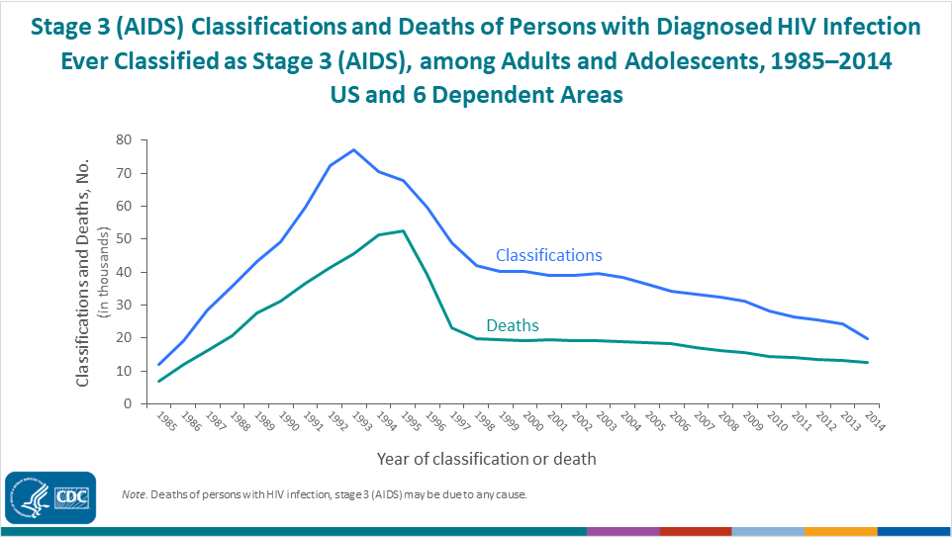
After: A Skimmable Slide Title
I talked with the epidemiologist who made that slide, and here’s what we came up with:
Here’s what we did:
- We put the main takeaway point in the title.
- We used a text hierarchy so that your eye is drawn to the largest, darkest, boldest text first.
- We kept her original title so that the technical people had all of the information they would need, but made it the subtitle instead.
- We rotated the diagonal text and used horizontal text instead (for speed-reading).
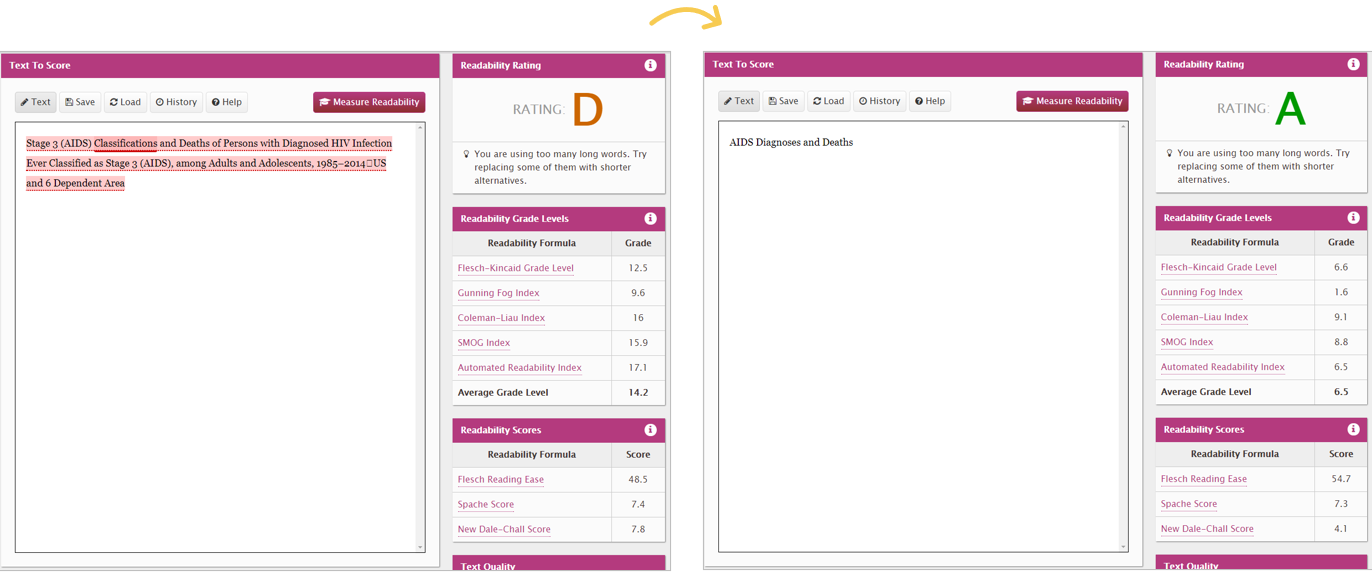
Objectively Testing the Reading Level
We tested both titles with an official readability website.
In the past, I’ve used https://readable.com/.
They used to be free, but now have a fee.
(Comment below if you have a great, free readability website you use. You can also use Word or Google for this.)
The before graph title was a 14.2, which in the U.S. would mean you’ve graduated high school.
The after version was a 6, woohoo!
The Average American Reading Level
Speaking of grade 6 being a great spot to be at.. What do you think is the average reading level?
Hint: it’s lower than you think.
The average American reading level is a 6 – 8.
While a lot of people have gone on to higher education levels than that, it’s not a one-to-one comparison.
For example, it’s not, “I finished 12th grade, therefore I read at a grade 12 level.” A lot of us read a little bit below our formal education years.
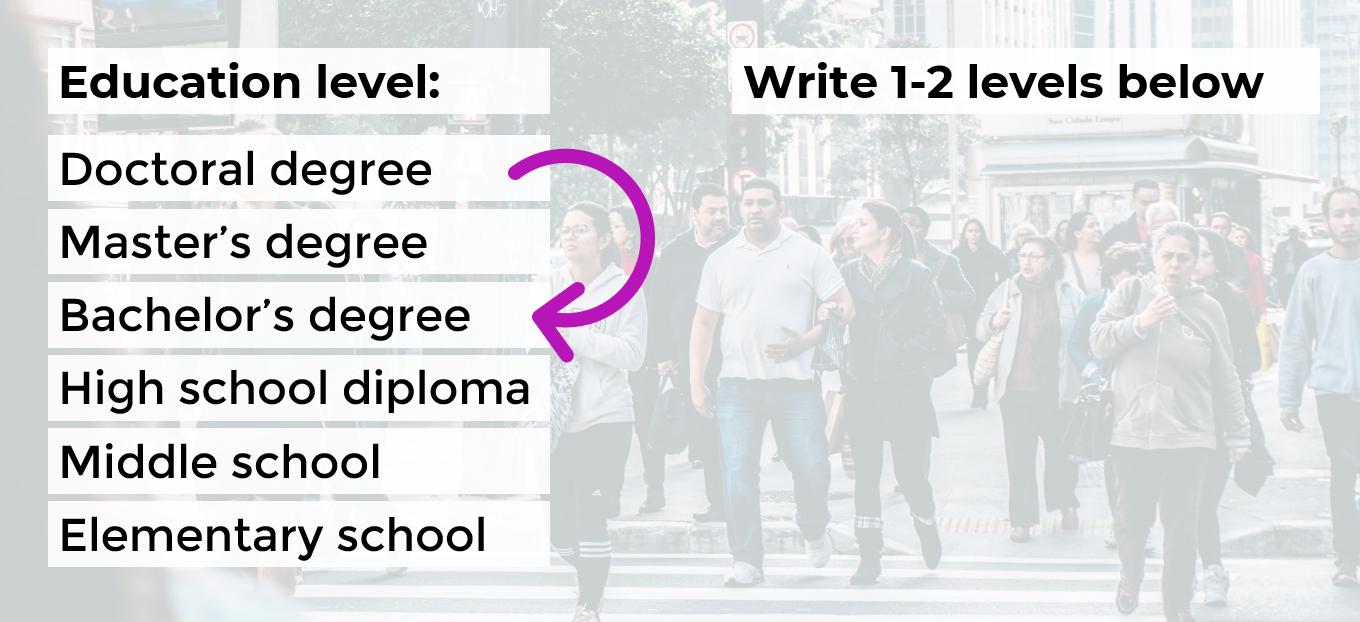
Rule of Thumb: Write 1-2 Levels Below
Sure, you might not be writing for “the general public.”
You might be writing for grant makers, policy makers, trustees, etc.—folks who likely read much higher than a grade 6-8.
A good rule of thumb is to aim for 1-2 levels below your audience’s education level.
For example, if I’m working on a board packet, and I know all the board members have an undergraduate degree, then I write two levels below that—at a middle school level.
If I’m working on a technical report for a government agency, and I know that all the recipients have Master’s degrees or higher, then I write two levels below that—at a high school level.
How to Lower the Reading Level
Here are some quick wins:
- Active voice (instead of passive voice)
- Shorter words, sentences and paragraphs
- Replace jargon with synonyms
After drafting your sentence or paragraph (they’ll probably be really long—mine usually are!), you’re going to go back and edit your writing.
Anytime you see a comma, replace it with a period.
Or, if your paragraph is six sentences long, break it into two shorter paragraphs.
Please make sure to objectively test your own writing (with Readable, Word, etc.). I don’t care what tool you use.
Let’s Practice
During the Good Tech Fest conference session, we practiced lowering the reading level for a few common data sentences.
How would you lower the reading level for these examples?
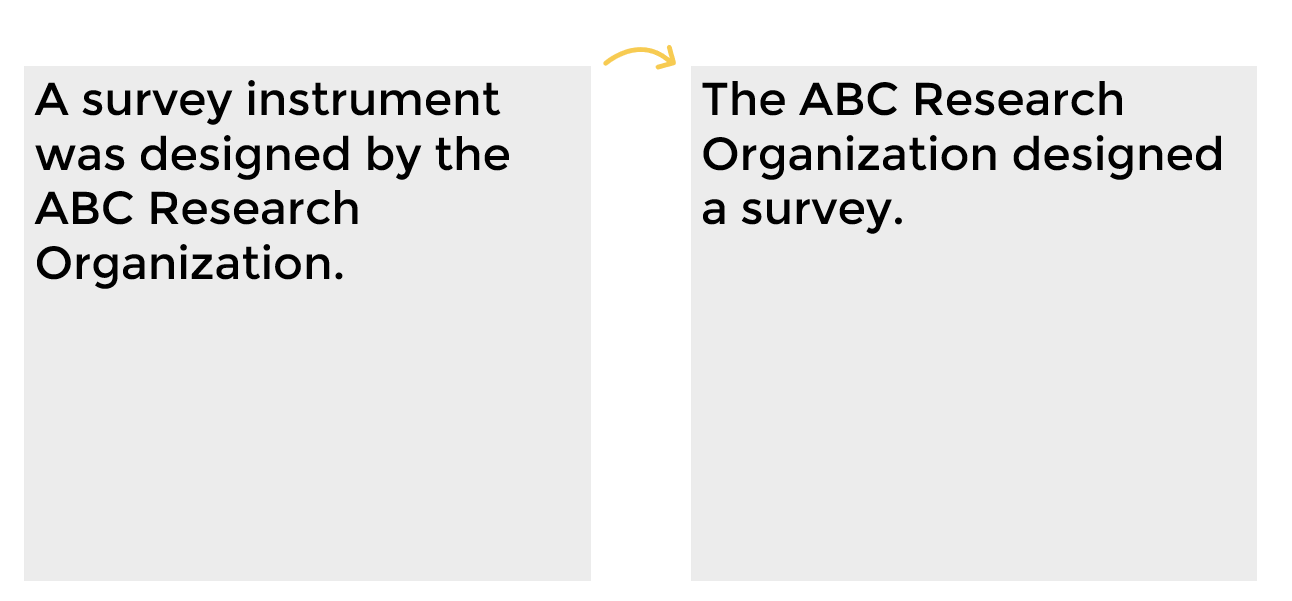
Example A: A survey instrument was designed by the ABC Research Organization.
The quickest wins would be:
- shorter words, sentences and paragraphs; and
- replacing jargon with synonyms.
Here’s the after:
What if you’re trying to explain the number of participants in a survey?
How would you lower the reading level here?
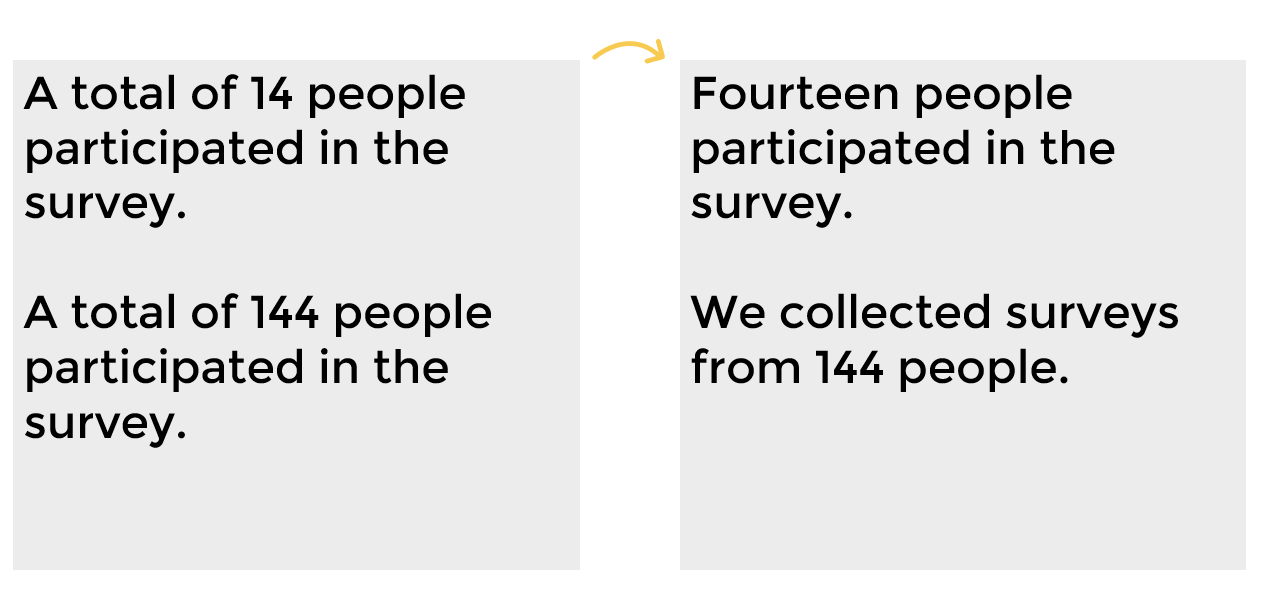
Example B: A total of 14 people participated in the survey.
Example C: A total of 144 people participated in the survey.
Here’s the after versions:
One last example with some jargon.
Example D: Undergraduate students comprise 65% of total responses.
How would you replace the jargon with synonyms to lower the reading level?
Here’s the after:

Your Turn
How’s the reading level in your writing? Comment and let me how your writing scored.
This blog post has a Flesch-Kincaid Grade Level of 6.3.
Download the eBook
Want to learn more about accessible data visualization?
In this ebook, you’ll learn 10 quick wins for designing accessible data visualizations. These small edits can have a big impact for our coworkers, board members, and funders who have color vision deficiencies, hearing loss, or learning disabilities–and for all of us who are pressed for time.
For your complimentary copy, use code: goodtechfest