• Skip to main content
  • Skip to footer
  • Home

The May 13 Group

the next day for evaluation

  • Get Involved
  • Our Work
  • About Us
You are here: Home / Archives for allblogs

allblogs

Jun 09 2021

The Hotel Bar of Evaluation Communities

The last few weeks…a recap.

  • Launched a new evaluation networking group (Awkward Evaluation Networking).
  • Had our first virtual get together (went well, looking forward to the next one).
  • Planned the second virtual get together (today, Wednesday, June 9 at 3PM).

This afternoon at 3 we’ll have our second Awkward Evaluation Networking webinar. George Mount of Stringfest Analytics will open up the event with a short talk about his new book Advancing into Analytics: From Excel to Python and R.

Then we’ll dive into some conversation and open networking. You can register here.

Freshspectrum Cartoon by Chris Lysy - So I decided to put on today's webinar because I pay zoom monthly for a pro account and wanted to justify the expense.

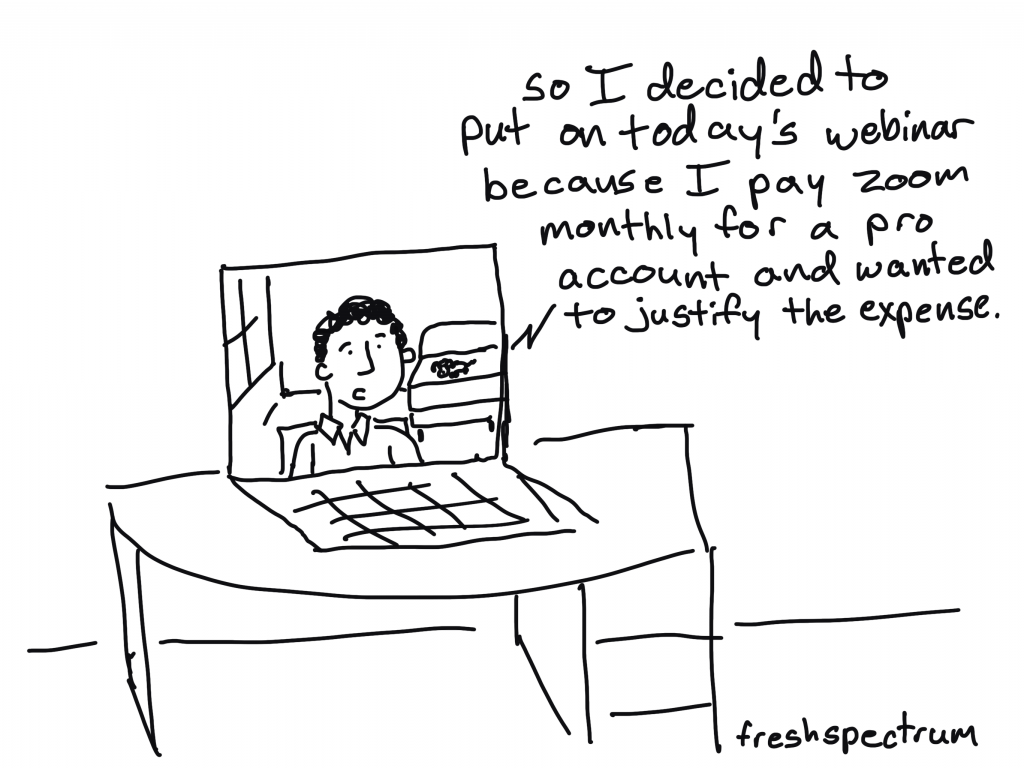
Online Community is a Webinar

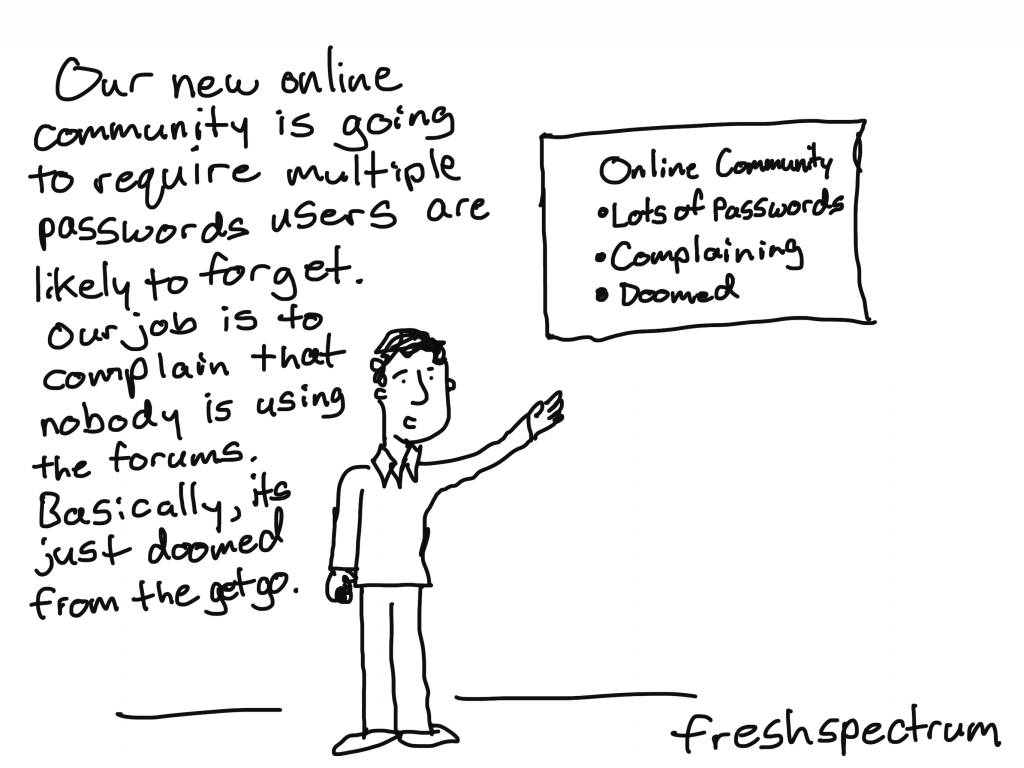
For all the fanciness of new-fangled online community software, there is one lesson I’ve learned in the past that keeps getting reinforced.

If you want to build an online community, you should start with a webinar series.

Community sites, forums, blogs, and email listservs can be awesome tools, but it’s too easy to hide. To lurk instead of participate. To avoid the awkwardness that is necessary for connection.

It’s harder to hide on a webinar, especially if you use breakout groups and call on people to participate by name. Sure it can be uncomfortable, but it’s necessary.

Freshspectrum Cartoon by Chris Lysy - Our new online community is going to require multiple passwords users are likely to forget. Our job is to complain that nobody is using the forums. Basically, it's just doomed from the get go.

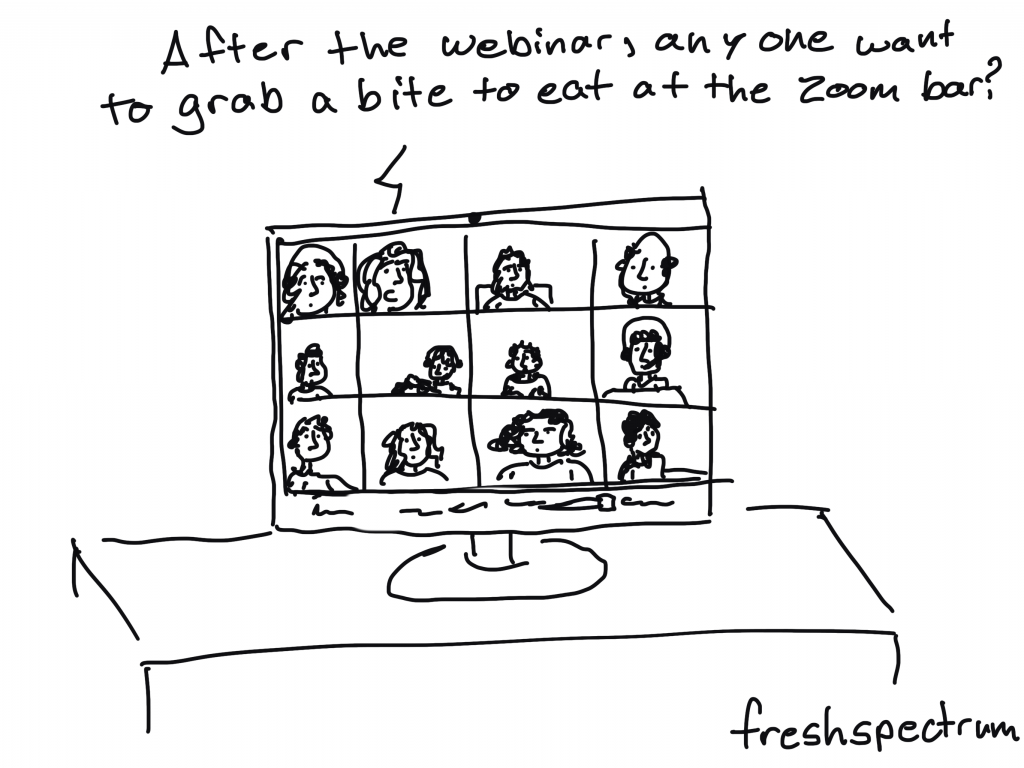
The Hallway between the Webinars

Once people meet and open up to one another, then you need additional space where they can deepen their relationships.

At a conference this is the hallway between the rooms, the hotel lobby, or the hotel bar. This is where you can reinforce connections. The spot where you can follow-up with that person who shared an interesting story or connect with the presenter to ask your more specific questions.

This is the part that is often missing in the virtual world. It’s not the place to start, but it can be helpful to help the community grow.

Freshspectrum Cartoon by Chris Lysy - After the webinar, any one want to grab a bit to eat at the Zoom bar?

Introducing the freshspectrum Community.

Consider this the hallway between the webinars.

Or maybe the hotel bar of evaluation communities.

It’s also a space that will tie together all of my personal digital initiatives.

What you’ll find.

  • Featured cartoons (I’ll share a few cartoons each week, some new and some from the archive)
  • An open evaluation networking section, designed to go in tandem with the live webinars but open to everyone.
  • A spot for my Cartoon patrons to request cartoons and get access to my cartoon dropbox folder.
  • An EvalCentral section, where you can submit your evaluation blog or suggest other evaluation blogs for inclusion.
  • An Evaluation Workshops section, where we will hold private discussion communities for people enrolled in the workshops I create for other evaluators (and for my own).
"Hello Neighbor Come on In" Sign.
Check out the New Community Site!

Written by cplysy · Categorized: freshspectrum

Jun 09 2021

Comentario en El Diálogo, como entendimiento mutuo, base de la Gestión del Conocimiento por EL PODER DE LA CONVERSACIÓN III: ESPACIOS Y TIPS –

[…] Blog «TripleAD»: Aprendiendo a Aprender para el Desarrollo va un paso más allá, tratando el Diálogo como gestión del Conocimiento a través de su focalización para la obtención de […]

Me gustaMe gusta

Written by cplysy · Categorized: TripleAD

Jun 09 2021

You Know Your Community Better Than Your Funder

Find the alignment One of my favorite blogs is Nonprofit AF by Vu Le, former executive director of RVC, a Seattle-based nonprofit that promotes social justice by cultivating leaders of color, strengthening organizations led by communities of color, and fostering collaboration between diverse communities. My favorite blog post from Nonprofit AF is “Answers on grant […]

The post You Know Your Community Better Than Your Funder appeared first on Nicole Clark Consulting.

Written by cplysy · Categorized: nicoleclark

Jun 08 2021

Escaping the Bar Chart

Bar charts aren’t evil. But they’re overused.

Ready to escape the bar chart? I talked about Designs to Start Using Instead at the DataScienceGO conference in April 2021.

Watch the Conference Session

Choose Your Own Adventure

This was a Choose Your Own Adventure presentation, where I gave the conference attendees a chance to vote for the chart families they wanted to learn about.

These non-linear presentations aren’t for everyone. You need to be extremely comfortable with the topic area and with presenting. You can learn more about Choose Your Own Adventure presentations here.

Exploratory Data Visualization

First, we talked about my three favorite techniques for exploratory data visualization:

  1. Spark lines
  2. Data Bars
  3. Heat Tables

Spark Lines

Want to add miniature trend lines to your spreadsheet? Here’s how:

  • Highlight the top row of your dataset (the numbers that you want to visualize).
  • Go to the Insert tab.
  • Click on the Sparklines button.
  • Follow the instructions: Choose where you want the sparklines to be placed. I usually position them off to the right side of my dataset.
One option besides a bar chart is to use miniature trend lines or spark lines.

Data Bars

Want to explore your dataset with miniature horizontal bars? Here’s how:

  • Highlight the data you want to visualize.
  • Stay on the Home tab.
  • Click on the Conditional Formatting button.
  • Choose a solid-filled Data Bar.
One option besides a bar chart is to use miniature horizontal bars or data bars.

Heat Tables

We can also explore our dataset with instant color-coding. Here’s how to add a heat map or heat table to your spreadsheet:

  • Highlight the data you want to visualize.
  • Stay on the Home tab.
  • Click on the Conditional Formatting button.
  • Choose a Color Scale.

PLEASE avoid the inaccessible options—anything with red and green. Most of the Conditional Formatting options are absolute garbage, to be honest. Here’s a blog post that lists which Conditional Formatting options to avoid altogether—and what to use instead.

You can also add add a heat map or heat table to your spreadsheet.

Want more info? In the video, you’ll see me open Excel and provide how-to tutorials.

Maps

Next, we discussed a few options for maps.

Choropleth Maps

You’ve seen this one: The regular ol’ color-coded map, or choropleth. Big numbers are dark. These maps are familiar and intuitive.

But, there’s a problem with regular maps: The large places can dwarf the small places. No matter how dark we color-in tiny Delaware, for example, the larger places like Texas and Alaska will always steal the show.

Cartographers have a name for this misleading issue with regular maps. It’s called The Alaska Effect.

You’ve seen this one: The regular ol’ color-coded map, or choropleth. Big numbers are dark. These maps are familiar and intuitive.

Tile Grid Maps

Don’t worry, we’re not doomed by The Alaska Effect! There are a couple alternatives worth mentioning.

Square tile grid maps can help us overcome The Alaska Effect. Every location is the same shape and size, so now our audience only has to look at color. In other words, since Delaware and Texas are the same shape and size, we’re free to focus entirely on color.

BUT.

There’s a learning curve with tile grid maps. They’re almost too novel. Sometimes we spend more time focusing on why our home state isn’t in the right spot than on actually finding patterns in the data.

Tile grid maps have become more and more common over the years. In the video, I show you some real-life examples from the Urban Institute, the Washington Post, Child Trends, CNN, and National Geographic.

Square tile grid maps can help us overcome The Alaska Effect. Every location is the same shape and size, so now our audience only has to look at color.

Hex Maps

Rather than using squares…. What if we try hexagons?

With six edges, hex maps give us more flexibility in arranging the shapes. That way, the maps can look closer to real-life maps.

In the video, I discuss some additional advantage of hex maps:

  • Hex maps combat the Alaska Effect.
  • Hex maps include more of the correct neighboring states compared to square maps.
  • Hex maps include the correct southern tips.
  • Hex maps include more notches for the Great Lakes.
  • Hex maps visualize the correct four corners of the U.S.

And of course, hex maps aren’t just for the United States. You can create maps for zip codes, Census tracts, states, provinces, countries, etc. In the video, I show you a waffle map of African countries.

With six edges, hex maps give us more flexibility in arranging the shapes. That way, the maps can look closer to real-life maps.

Learn More

You can download the 2-page Chart Chooser at https://depictdatastudio.com/chartchooser/. Use code DataScienceGO for a complimentary download.

Written by cplysy · Categorized: depictdatastudio

Jun 08 2021

Project Management for Evaluation


Sometimes managing evaluations can feel like herding cats. Despite your best efforts at nailing down methods, timelines, and other evaluation requirements, plans tend to change, especially if you aren’t paying attention.  

Evaluators work in multiple environments and just like there’s no one-size-fits-all evaluation plan, I’ve found there’s no one-size-fits-all project management solution for managing evaluations.

Based on my experiences and as a self-proclaimed process geek, I’ve accumulated my top project management tools and strategies to help keep your evaluation projects on track and ensure they meet your stakeholder’s needs.  

pexels-fauxels-3183186.jpg

First, there are project management tools – systems and processes that you can use to keep your evaluations on time and on budget.

Using our evaluation plan template helps you plan your evaluation and is the first set of tools you can use to determine what needs to get done when.

But managing the execution of that plan is where project management tools come in handy.

Traditional Project Management Strategies

If your evaluation work involves: 

  • A single evaluation project, 

  • Firm deadlines, 

  • Dedicated project staff, 

  • Internal control of data (i.e., collected, collated, accessed, analyzed by your team) 

you can draw from more traditional project management strategies, where specific tasks are assigned to specific people with estimated amounts of time to complete them. Tasks are linked together depending on the order in which they must be completed and generally the evaluation is executed in a linear fashion.

Examples of these more ‘traditional’ tools include: 

  • Project timelines or Gantt charts 

  • Programs like MS project or Forecast that are designed based on assigning tasks with set timelines to specific people  

  • Progress and status updates

Agile Project Management Strategies

Once you begin adding more complexity, like: 

  • Multiple evaluation projects, 

  • Estimated or loose deadlines, 

  • Shared project resourcing, 

  • External control of some data (i.e., evaluation partners are collecting or analyzing data) 

traditional tools tend to stop working as well. In my experience, items can easily be forgotten or get off track once the evaluation(s) you manage have these additional elements of complexity. A Gantt chart works well to estimate work, but if deadlines are continually changing, you will need to continually update the chart and add additional tools to your arsenal. 

Some of these additional tools can be gleaned from less traditional or ‘agile’ project management strategies (https://www.apm.org.uk/resources/find-a-resource/agile-project-management/). Agile project management was created for managing projects in software development, where management must be adaptive, not anticipatory. Agile projects work in cycles to maintain flexibility and to respond to constantly changing demands. Examples of these tools include: 

  • KanBan boards; where tasks are moved between three lanes: To Do, Doing, Done 

  • Programs like Asana or Trello that are designed around creating a list of tasks, then assigning people and updating progress on an ongoing basis 

  • Simple tracking documents such as calendars or spreadsheets to keep track of items 

  • Frequent meetings (some methods advocate for daily!) to divide up work and assess project risks 

In one sense, these less traditional methods seem more rudimentary; they’re based on the idea of keeping a rolling list of tasks and deadlines, rather than outlining all of the plans and steps at the start.


At Three Hive, we work on multiple evaluation projects, some with firm deadlines, some without; we share staff between evaluations based on availability and expertise; and very often we rely on our clients for some or most of the data we use in the evaluation.

Essentially, traditional project management tools and software do not meet our needs. What I’ve learned from working in this environment a set of principles and strategies that help me to help me juggle competing tasks and demands.

1. Be utilization-focused

We have utilization-focused evaluation and I advocate for taking a utilization-focused project management approach. That is, be adaptable and focus on managing the work in a way that makes sense for you, your team, and the evaluation(s) at hand. Don’t get hung up on adhering to certain processes and tools if they aren’t meeting your needs. If Gantt charts don’t make sense for managing an evaluation, ditch them!

2. Communication is key

Communicate clearly with both your client and your team. Start communicating early and be consistent. Give people the information they need to help make decisions and be upfront about your constraints. Notify team members and clients ahead of time if you are going to need something from them; assume your project is not at the forefront of their minds and that they will need to be reminded about tasks and deadlines. Manage expectations by being proactive and highlight the risks, benefits, and consequences of action or inaction.

3. Don’t live and die by the plan

Managing evaluation projects requires responding to change. Being overly rigid in your process, methods, and timelines will lead to you being out of touch with what you are evaluating. Build in space for review and course correction. Unless fidelity to the original evaluation plan is an important measure of success, focus on delivering a quality product and setting up your team for success.

4. Redundancy is kind of good

Having redundancy in your project management tools is probably going to happen when you are managing complex projects. I would argue that redundancy in methods is actually a good thing – it serves as a double-check for your project management constraints and assumptions. The key is to find the balance between too much and too little redundancy.

5. Use your data

Well, first off, collect it, then use it! Look at past budgets and timelines to help you gain a better understanding of how long certain evaluative activities take. At Three Hive, we use Harvest to track our work and monitor budgets. Use that information to constantly improve your project management skills. Ask yourself and your team what could be improved and what worked well after each stage of the evaluation.


For my own use, I use high-level planning tools such as Gantt charts combined with short-term to-do lists and calendar reminders.

Our Three Hive team meets weekly to discuss what is on our plate for the week and our team has an excel spreadsheet outlining upcoming projects and tasks which will require support from various team members. These methods allow for flexible scheduling and prioritization among the team.

I’m sure by the time you, the reader, are reading this article, part of this system will have changed or evolved.

Be sure to check out our evaluation plan template to get you started in the right direction! 

Download our Evaluation Plan Template


To learn more about applying evaluation in practice, check out more of our articles, or connect with us over on Twitter (@EvalAcademy) or LinkedIn.


Sign up for our newsletter

We’ll let you know about our new content, and curate the best new evaluation resources from around the web!


We respect your privacy.

Thank you!


Written by cplysy · Categorized: evalacademy

  • « Go to Previous Page
  • Go to page 1
  • Interim pages omitted …
  • Go to page 180
  • Go to page 181
  • Go to page 182
  • Go to page 183
  • Go to page 184
  • Interim pages omitted …
  • Go to page 310
  • Go to Next Page »

Footer

Follow our Work

The easiest way to stay connected to our work is to join our newsletter. You’ll get updates on projects, learn about new events, and hear stories from those evaluators whom the field continues to actively exclude and erase.

Get Updates

Want to take further action or join a pod? Click here to learn more.

Copyright © 2026 · The May 13 Group · Log in

en English
af Afrikaanssq Shqipam አማርኛar العربيةhy Հայերենaz Azərbaycan dilieu Euskarabe Беларуская моваbn বাংলাbs Bosanskibg Българскиca Catalàceb Cebuanony Chichewazh-CN 简体中文zh-TW 繁體中文co Corsuhr Hrvatskics Čeština‎da Dansknl Nederlandsen Englisheo Esperantoet Eestitl Filipinofi Suomifr Françaisfy Fryskgl Galegoka ქართულიde Deutschel Ελληνικάgu ગુજરાતીht Kreyol ayisyenha Harshen Hausahaw Ōlelo Hawaiʻiiw עִבְרִיתhi हिन्दीhmn Hmonghu Magyaris Íslenskaig Igboid Bahasa Indonesiaga Gaeilgeit Italianoja 日本語jw Basa Jawakn ಕನ್ನಡkk Қазақ тіліkm ភាសាខ្មែរko 한국어ku كوردی‎ky Кыргызчаlo ພາສາລາວla Latinlv Latviešu valodalt Lietuvių kalbalb Lëtzebuergeschmk Македонски јазикmg Malagasyms Bahasa Melayuml മലയാളംmt Maltesemi Te Reo Māorimr मराठीmn Монголmy ဗမာစာne नेपालीno Norsk bokmålps پښتوfa فارسیpl Polskipt Portuguêspa ਪੰਜਾਬੀro Românăru Русскийsm Samoangd Gàidhligsr Српски језикst Sesothosn Shonasd سنڌيsi සිංහලsk Slovenčinasl Slovenščinaso Afsoomaalies Españolsu Basa Sundasw Kiswahilisv Svenskatg Тоҷикӣta தமிழ்te తెలుగుth ไทยtr Türkçeuk Українськаur اردوuz O‘zbekchavi Tiếng Việtcy Cymraegxh isiXhosayi יידישyo Yorùbázu Zulu