[…] has been three months since we pledged our commitment to anti-racist […]
allblogs
Anti-racism Pledge: 3-month Update
It has been three months since we pledged our commitment to anti-racist practices.
We at RK&A, individually and collectively, pledge our commitment to being anti-racist—which we recognize as an ongoing pursuit through our everyday actions.
To hold ourselves accountable, we want to document publicly the work we have been doing and work still to be done.
First, we have continued personal and professional development in how to be anti-racist through various avenues. We have read the CCLI National Landscape Study: The State of DEAI Practices in Museums, a first field-wide study of DEAI practices by Cecelia Garibay and Jeanne Marie Olson, participated in the Visitor Studies Association discussion of the report with our colleagues, and have referenced it in recent writings. As a staff, we have read and discussed AAM’s TrendsWatch report, whose first trend addresses systemic equalities of wealth and power. We have engaged in conversation with our clients about museums and neutrality and AAM’s recent Audiences and Inclusivity Primer. Further, we have worked to stay abreast of developments in our field about anti-racism. And unfortunately, confront the racist practices that persist, such as the release of a job posting for a museum position with duties that include maintaining its “traditional, core, white art audience” followed by a critique of this museum’s leadership by the former director who intones the same white supremacist language in calling for the museum’s return to “its historic purpose.”
A second step we have taken is to actively encourage our clients to share the results of our studies out with the people from whom we have collected data. More and more, museums have been working to bring underrepresented voices into their development processes for exhibitions, programs, etc. through evaluation. Our goal has been to make sure the museum approaches those relationships as equitable and not extractive. For example, when we collect any data, we tell the person for whom the data is being collected and how it will be used (per IRB requirements). However, for equity and accountability, we also want to tell audiences exactly when and how the museum will follow-up with them (e.g., sending them a written report, inviting them to a presentation by the evaluator, etc.), so they know specifically how their feedback is being considered—not just that is being considered in abstract terms.
Third, we have been considering how we can represent the individuals behind the data points. Our professional development has taught us that aggregated data can hide inequities. Therefore, we have had ongoing discussions about how to disaggregate data to explore equity issues (i.e., by ethnicity, gender identity, socioeconomics, etc.). We are still trying to tackle the best approach to disaggregation within our work since (a) our samples tend to be of museum visitors (although we have been working to broaden our reach in this remote era); and (b) museum visitors tend to be largely homogeneous and do not allow for us to disaggregate with confidence statistically (although arguably those statistics are white supremacist structures). We plan to continue to develop in these areas and also look forward to presenting more equitable data visualization, inspired by this AEA365 blog post.
There is of course more work for us at RK&A to do in our efforts to be anti-racist. One of the most important steps we have taken over these last three months is to put anti-racist practices on the agenda for every one of our staff meetings to generate conversations to move our work forward. We look forward to sharing with you our ongoing work.
The post Anti-racism Pledge: 3-month Update appeared first on RK&A.
How to Plan and Deliver an Online Presentation with Zoom
This is the first in a series of tutorials on delivering online presentations. We’ll start with creating webinars using the current industry leader, Zoom.
What you’ll find in this post:
- An Oversimplified How To
- Going Beyond the Basics
- Event Registration with Eventbrite
- Visual Slides with Canva
- Zoom Meeting vs Zoom Webinar
- PowerPoint Presenter Notes in Zoom
- Engaging the Audience
- Polls, Q&A, Chat
- Getting Fancy
- Common Zoom Fails
An Oversimplified How To
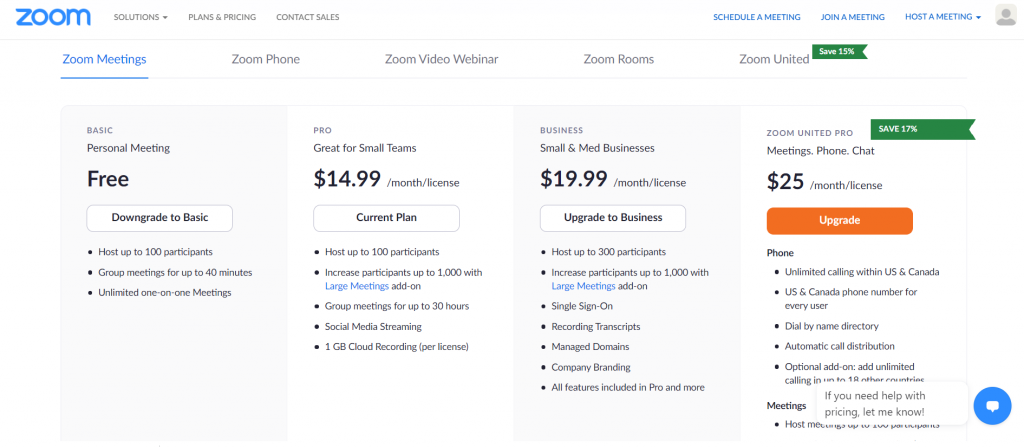
To start, you’ll need a Zoom account. If you can stick within a 40 minute time slot you don’t even need to pay Zoom anything and can still lead a webinar with up to 100 people.
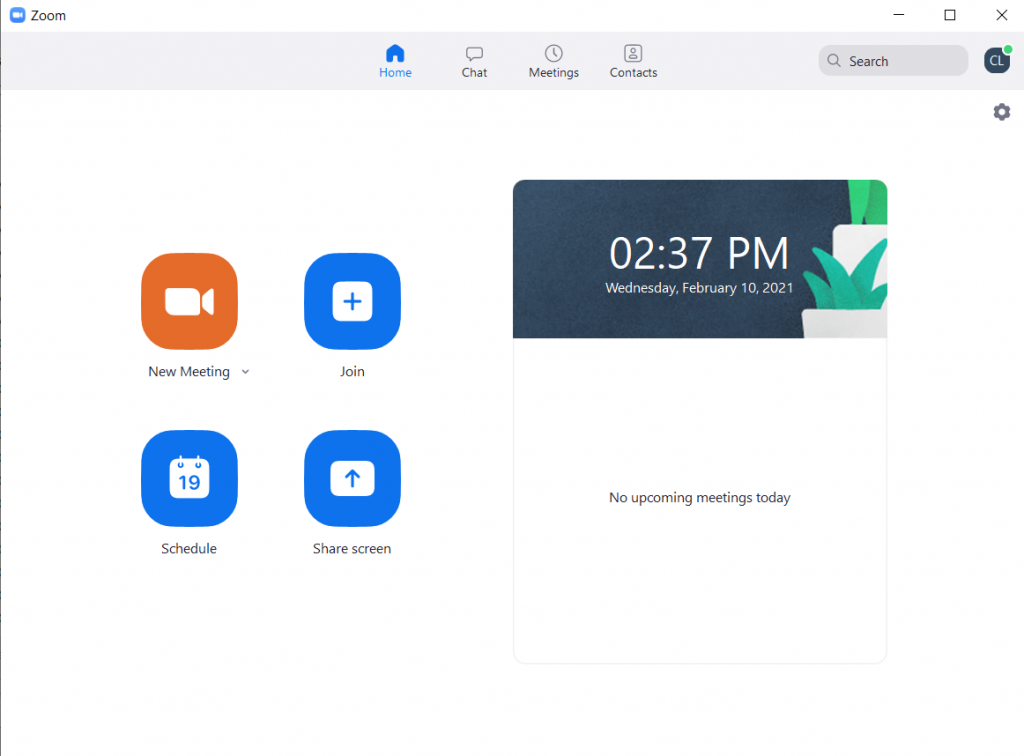
Everyone with a Zoom account has a Personal Meeting ID. Consider this your personal Zoom office. Basically you can share your personal room with anyone and meet there whenever. You just click on New Meeting, and start with your Personal Meeting ID.
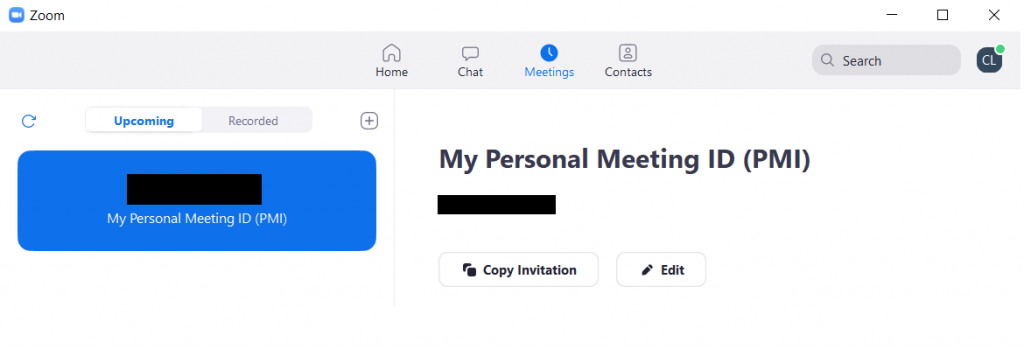
If you go over to the meetings tab in Zoom, you’ll find your invitation link. It even gives you pre-generated meeting invitation text you can copy and paste.
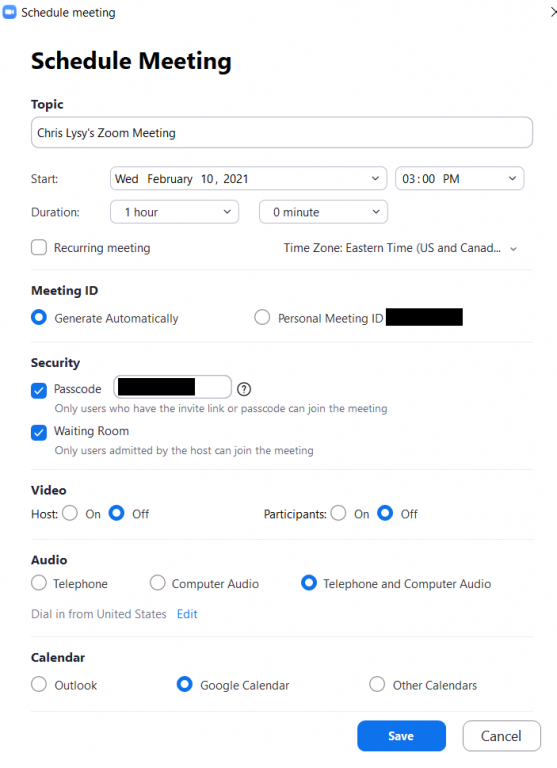
Or you could schedule a meeting if you’d prefer…
If you’re the kind of person who just likes to stand in front of a presentation room and talk, this is all you need to know.
If you’re super new to Zoom, I definitely suggest going through Zoom’s getting started guidance. It won’t take long.
Going Beyond the Basics
Okay, so that’s just the basics. Chances are you’ll want to do a little bit more than just that.
Share Screen
The biggest things is going to be Sharing Your Screen.
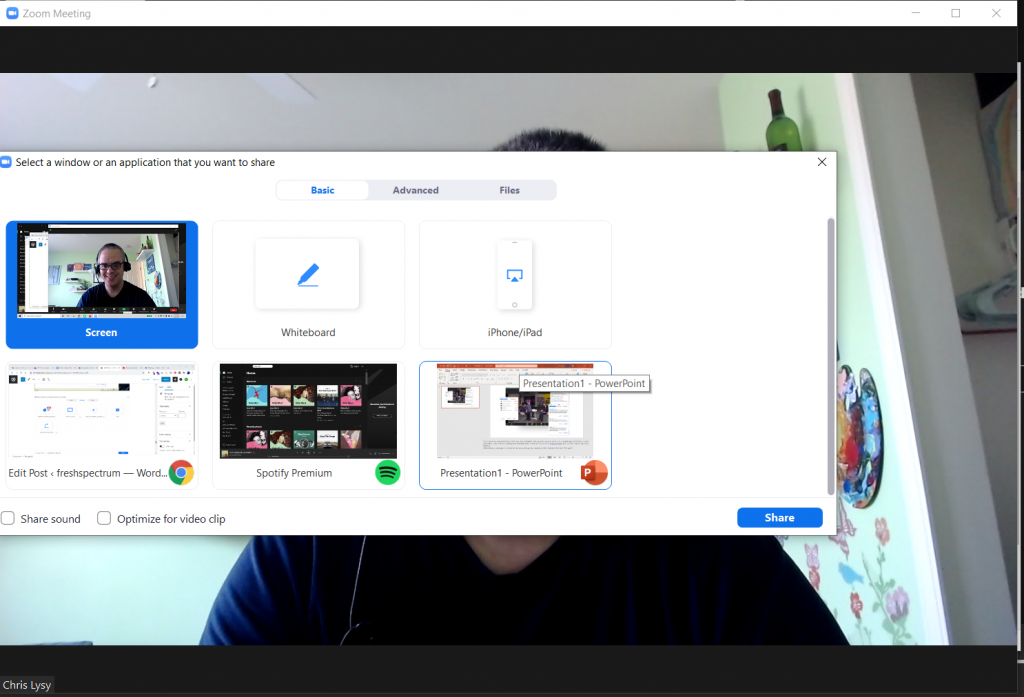
To do this, you just click the little “Share Screen” button on the bottom of your window. This will open a menu with a bunch of stuff you could share if you so chose.
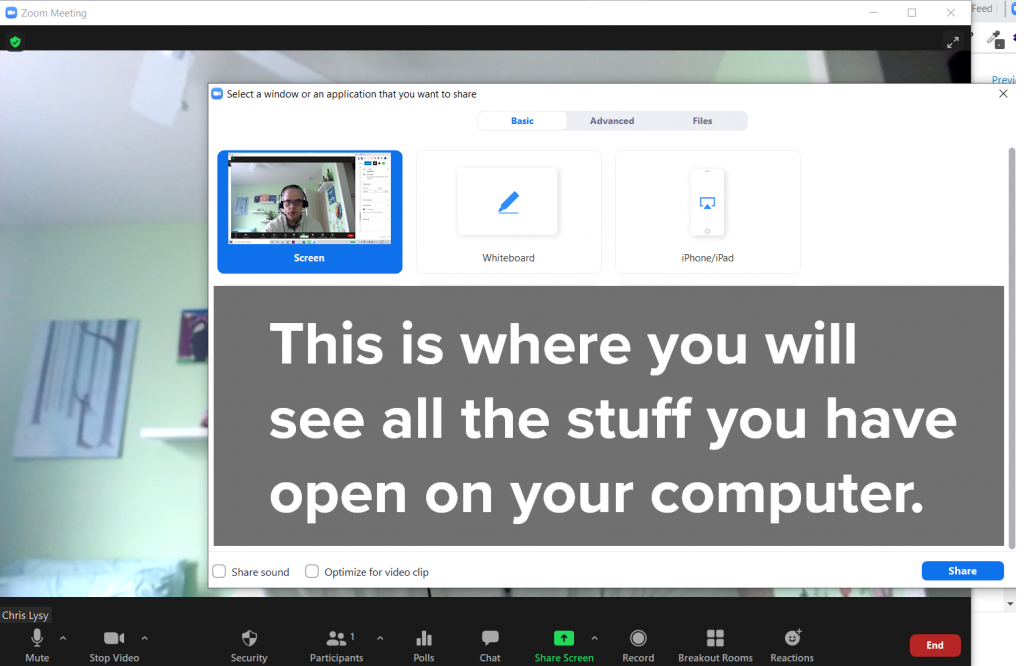
If you’re sharing a Power Point, or anything else really, I suggest having it open on your computer. Then selecting the specific thing you want to share.
Yes, you could just share your whole screen, but then your computer might pop up with someone annoying you didn’t want other people to see.
Participants and Chat
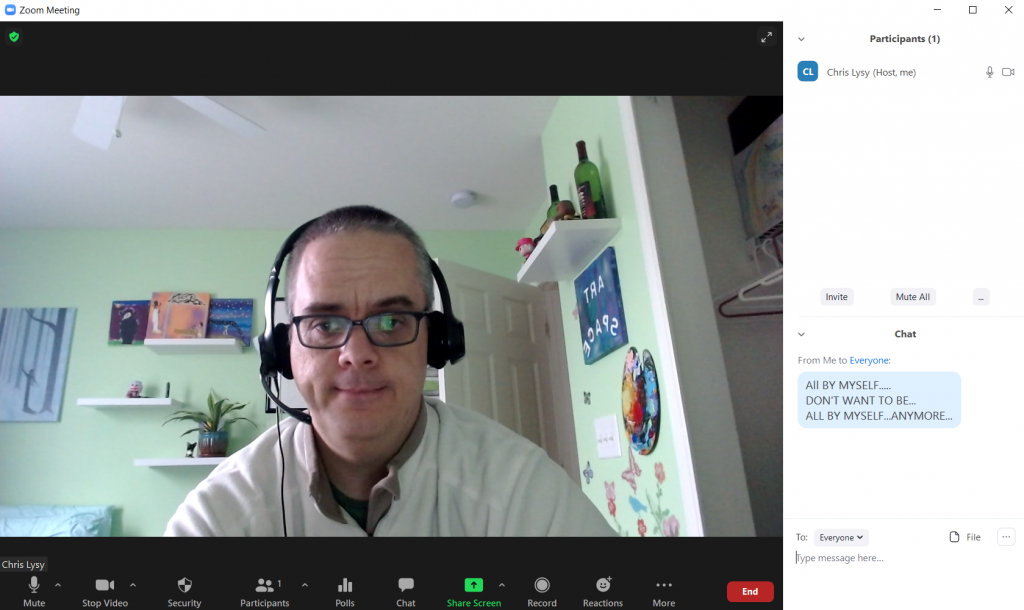
Anytime I’m giving a presentation I always open up the Chat and Participants panel.
The Participants channel let’s me see who joins (even if they don’t have audio or video connected). It also let’s me see if anyone is stuck in the Webinar waiting room.
The Chat is just an easy way to connect with everyone or share links. Lots of people prefer to respond to webinars via the chat, even if you invite live conversation or questions.
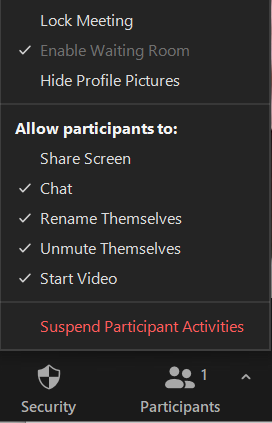
Security Settings
So in recent times, Zoom has upped their default security settings. This was a response to pandemic era Zoom bombers (a.k.a. anonymous jerks jumping into webinars and sharing inappropriate things).
If you’re using your personal meeting room, it will enable a waiting room by default. This makes you approve all incoming participants. Scheduling a meeting in advance (and using a password) will allow you to have a meeting without the Waiting Room.
By default participants won’t be able to share their screen. So you need to enable that if you would like anyone else to share their own stuff.
Recording, Polls, Breakout Rooms, and Other Stuff
Okay, so I’m not going into recording (it’s just a button you click and you choose whether to record to Zoom’s cloud services or your desktop).
Polls and Breakout Rooms are things you can do, but if you’re just getting started I would suggest keeping it simple. Some things need to be setup in Zoom settings before you start your meeting. Zoom’s user guides are fairly comprehensive, so just Google your question if you have any specific challenges and the answer will probably pop up.
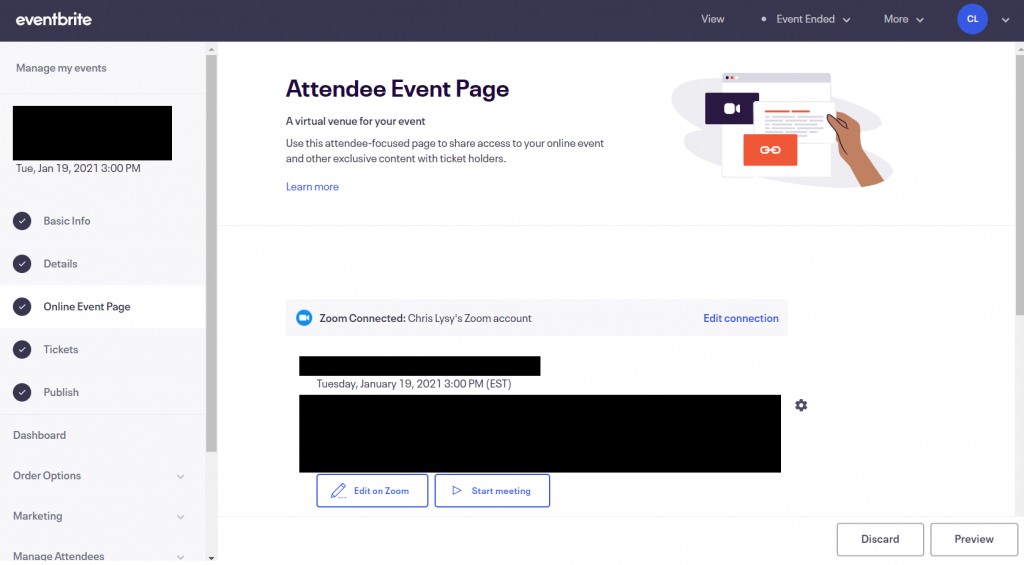
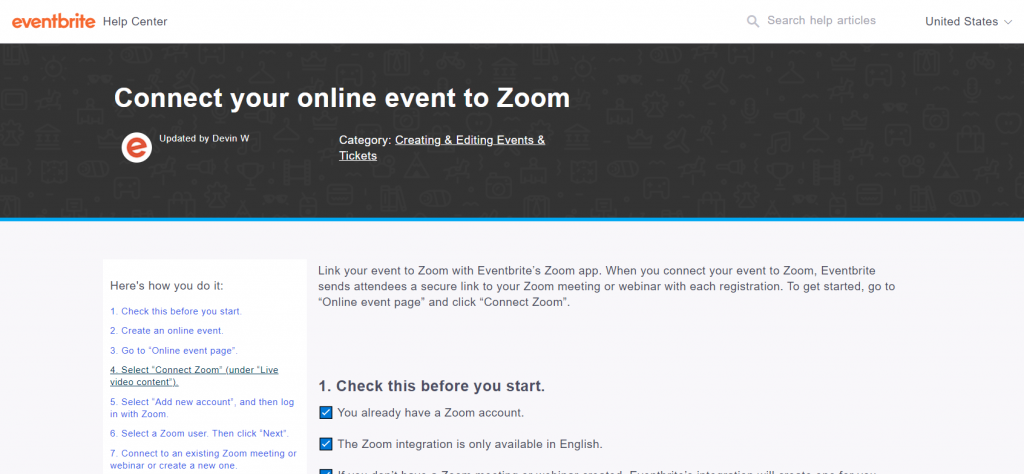
Event Registration with Eventbrite
Yes, you “could” just send people the link to your event. But chances are you’ll want to do at least a bit more marketing.
Zoom Webinar has some options for this, but I find Eventbrite works better. You can even directly connect your free Eventbrite account with your Zoom account, allowing you to schedule, create, and manager webinars right through Eventbrite.
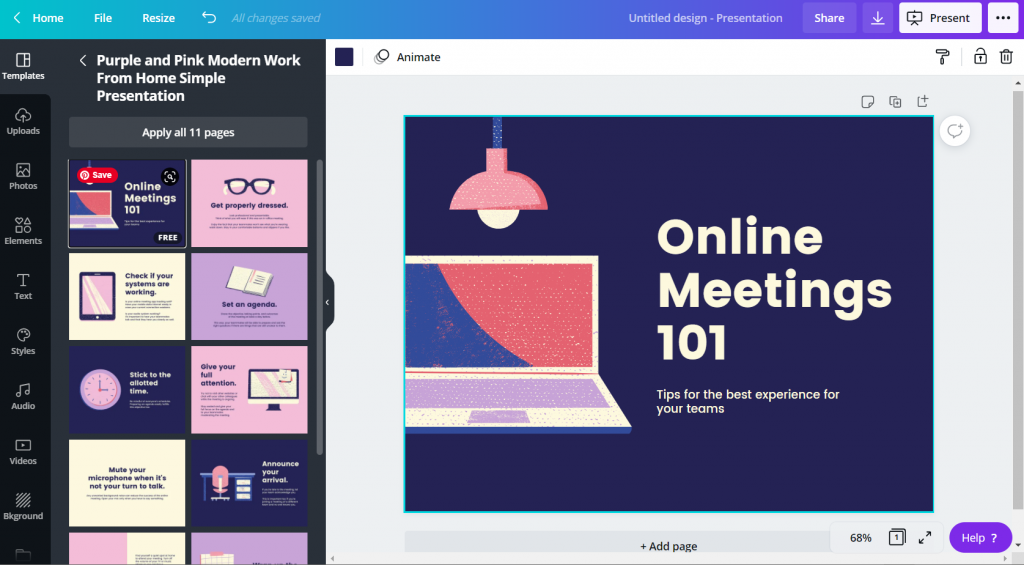
Visual Slides with Canva
Death by power point still applies to online presentations.
My suggestion, use Canva to create your slidedeck. Just follow along with a visual presentation template, making it your own.
Zoom Meeting vs Zoom Webinar
Yes, there are two Zooms (well, at least two main ones, more actually).
Zoom Webinar is more expensive. But it’s setup to be an actual webinar tool, not just a meeting tool that you’ll use for Webinars.
You can boost the number of participants of a Zoom meeting using the Zoom large meeting add on. You would use this if you wanted everyone to be able to turn on a camera, share screens, etc.
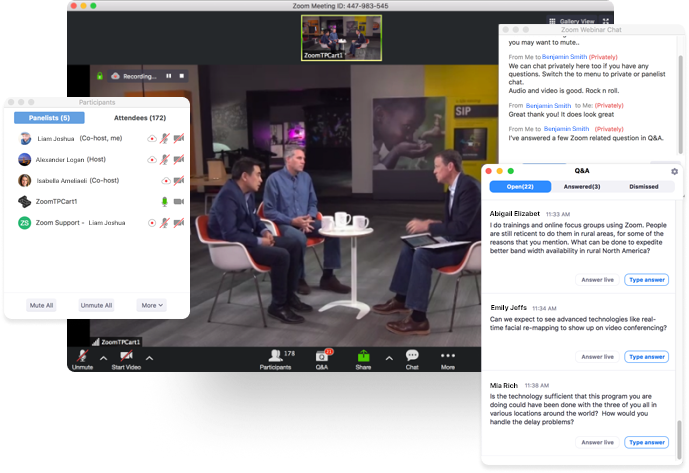
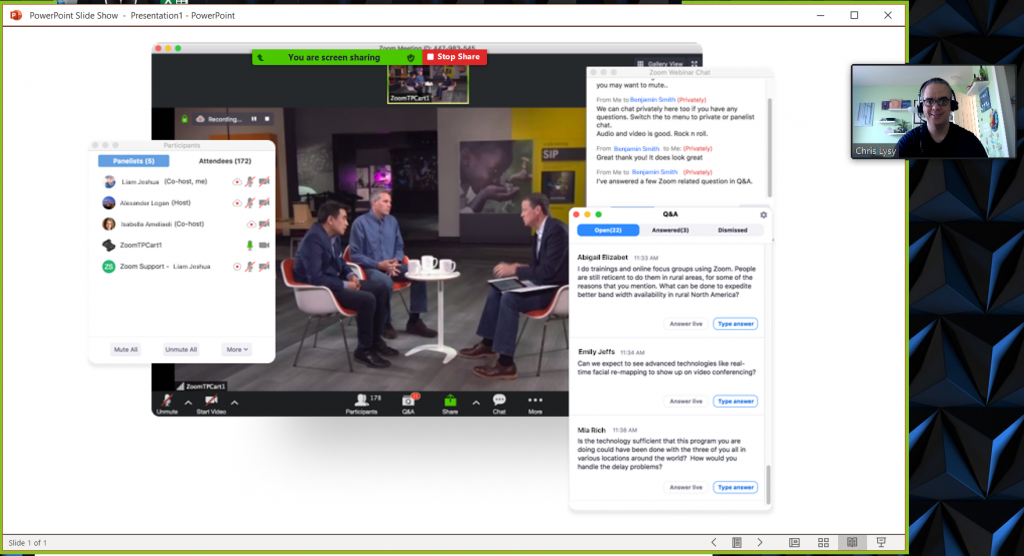
If you want more administrative control over the experience, with separate experiences for your panelists (who would see a screen more like you see in Zoom meeting) and attendees (who would see a much more stripped down version of the screen), use Zoom Webinar.
Zoom Webinar also adds a Q&A panel, where people can type questions that is separate from the Chat panel.
PowerPoint Presenter Notes in Zoom
Sharing PowerPoint presentation’s in Zoom is super easy. But getting the presentation screen to appear properly for your audience can get a little tricky.
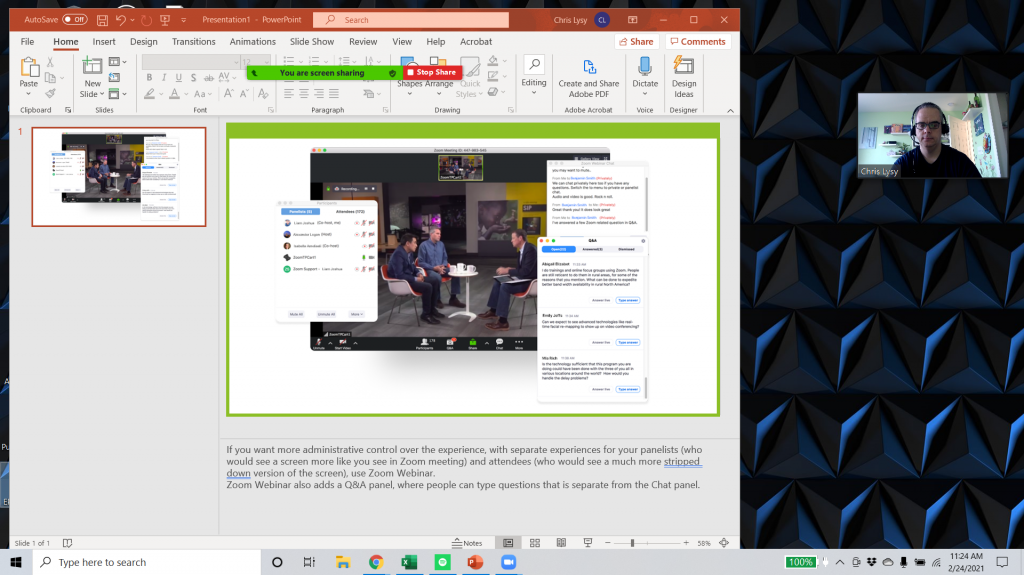
I always suggest having your PowerPoint open on your computer. Then when you click share, you can select the open presentation (and not the screen).
Your audience is going to see what’s in the green outlined box, which is the entire Power Point window.
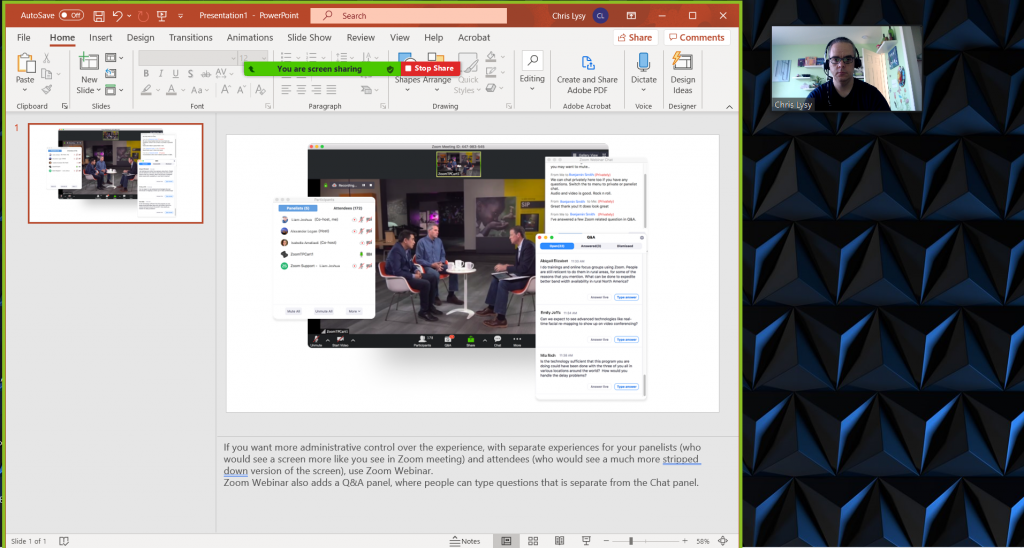
You can choose to go into slideshow mode, which will show your audience the full presentation screen. But this also means your video gallery will hover over top of your slides and your notes will go away, which could be annoying.
Another option is to click the “reading view” in Point to strip away a lot of the menu items, leaving only the slide in a window. This is my default, just feel like sharing something, approach.
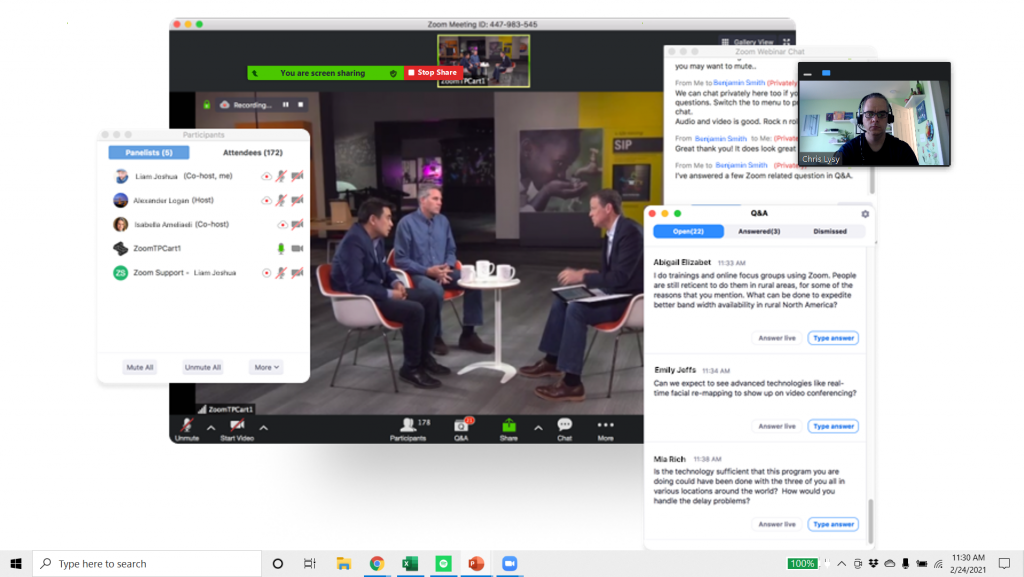
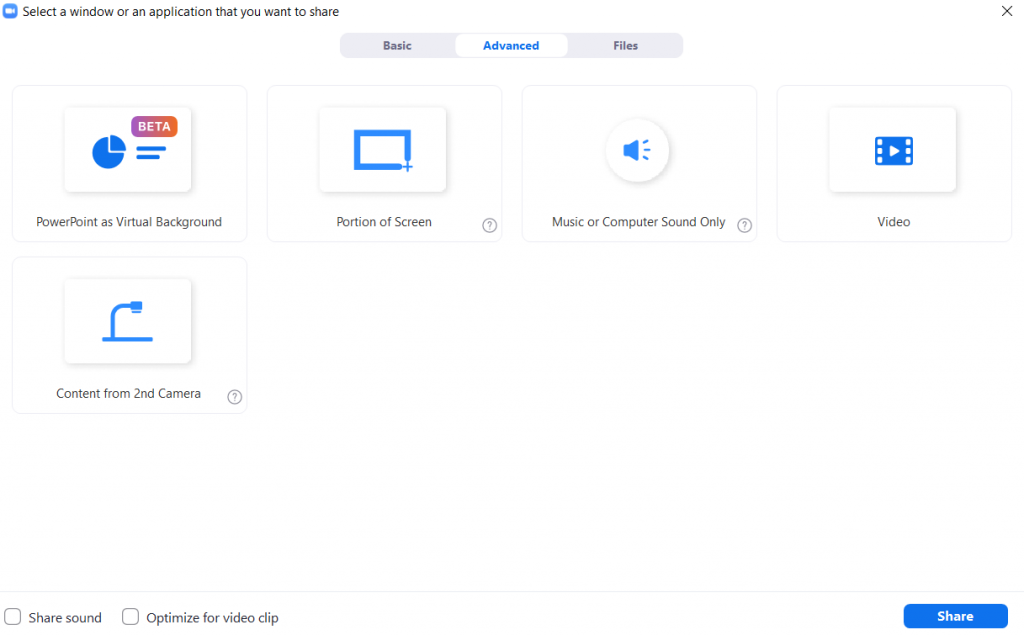
Now if you have presenter notes, there is another way to go. This time after you share screen, click on the Advanced tab. Now select “Portion of Screen.”
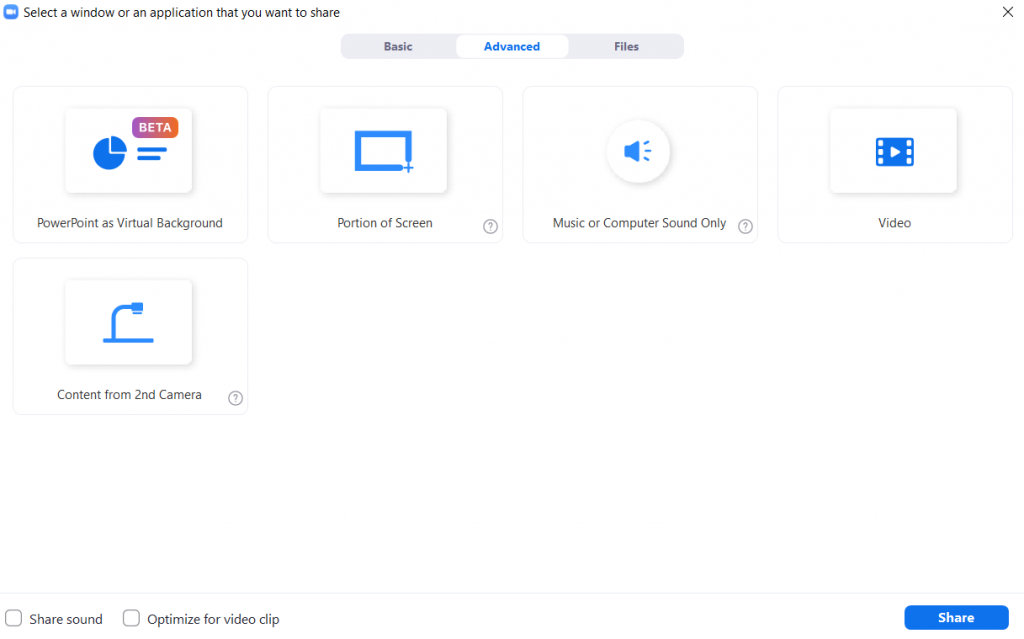
This will give you a green box that you can expand or minimize to fit over just your presentation slide. The audience will only see what’s in the green box.
This does take away a lot of the Zoom controls. So I usually open up the Participants box by scrolling over the menu (that way I can see who is here and retain mute control over participants). I’ll also open the chat (which is sometimes in the “More” part of the Zoom menu).
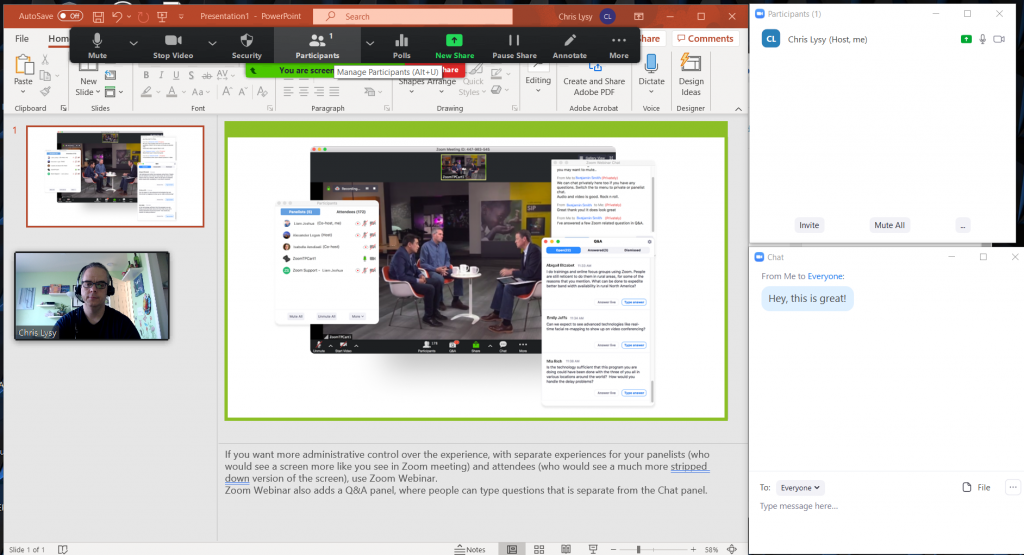
There, now I can see my notes, the chat, and the participant’s channel. All my audience sees is the slide.
Engaging the Audience
So most presenters on the web are not actors or hosts. But audience members are definitely people.
Start your webinar by talking to the people as they come in. Ask them if they can hear you by responding in the chat. I usually also ask where people are joining us from. I might also have a little chit chat.
The point, if you want people to connect with your presentation, connect with them. They didn’t tune in to see something static, they would just wait for the replay if that were the case. So engage, engage, engage. Dead air is the enemy.
Polls, Q&A, or Chat
So if you have different options to engage with your audience.
Chat.
Your primary mechanism is going to be the chat. Not everyone is comfortable using the chat, but if you engage they are much more likely. If you start with simple questions like, “can you hear me?” it breaks the chat ice.
Reward people who use the chat by responding to their questions/comments live. Give them an incentive to write, or else nobody will.
Q&A.
Q&A is only an option if you are using Zoom Webinar. It offers a different way for people to ask questions. In small meetings/presentations I find the chat works just fine and a Q&A would just add confusion. In larger audience presentations it can be really helpful in staying on top of questions.
There is also a way for the audience upvote/downvote certain questions, and even try to answer them through typing. You’ll need to adjust the settings prior to the event to get it to work the way you would like.
Polls.
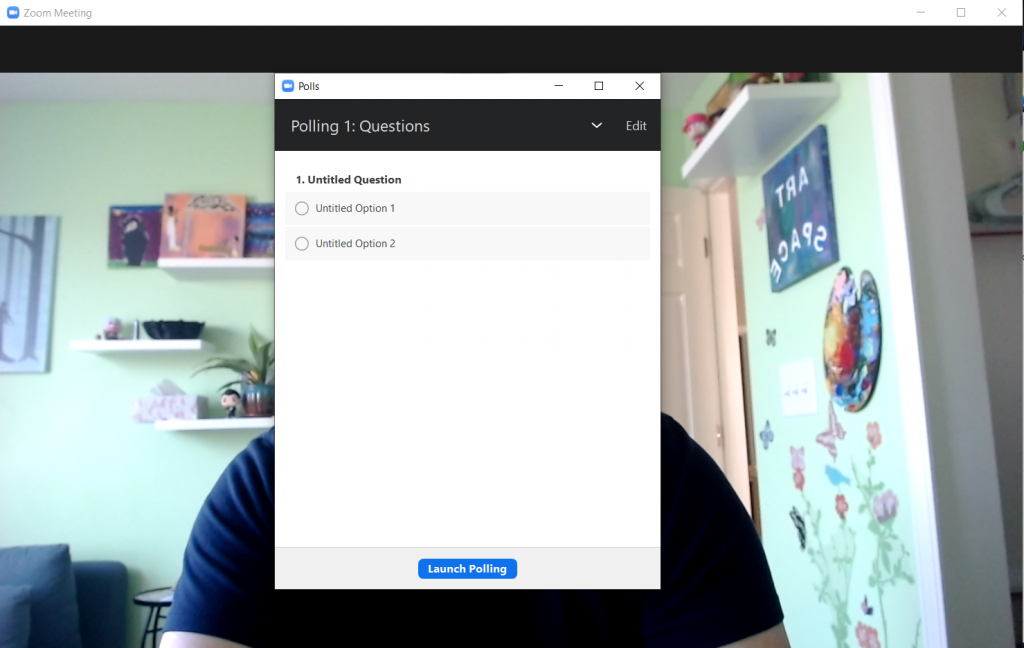
Using polls is yet another way to get some engagement and feedback from your audience. I would suggest using them sparingly, too much and it just feels like a live survey.
You can setup your polls in advance by scheduling your meeting and adding the polling questions through meeting settings. You “can” launch a poll directly from the platform without any planning, but it might take you a few minutes to get it setup.
Polls tend to get higher engagement than chat, but you’ll only want to use them if you have a discrete set of responses (Multi-Choice not Open Response).
Getting Fancy
There is a lot that you could do with Zoom. From streaming videos and music to live drawing on an iPad. Just keep in mind that Zoom requires a lot of multitasking in the first place.
It takes enough energy to share a presentation deck, deliver the presentation, keep an eye on the audience with your hand on the mute button, provide basic tech support to audience members, and watch the chat. Adding other potential complications only increases the chances that something might go wrong.
If you do decide to go fancy, I always suggest having backup. Whether that’s someone playing the producer role, a tech savvy friend, or a co-presenter that can tag team the webinar administration.
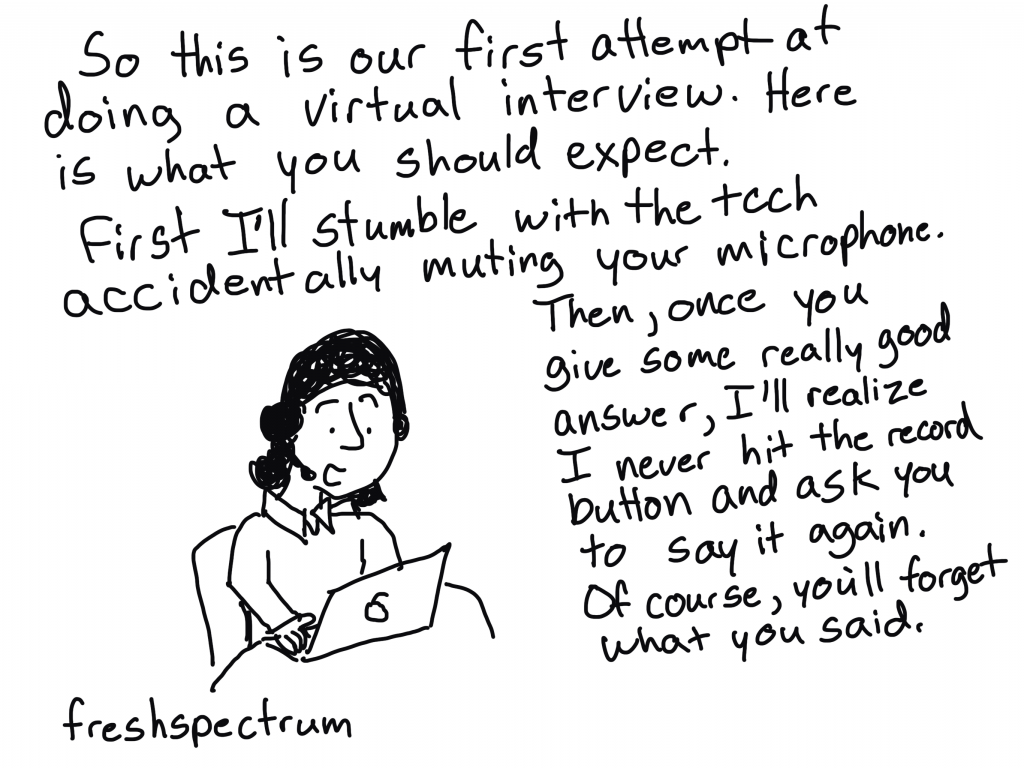
Common Zoom Fails
Your Video Doesn’t Work
Check to see if another program has hijacked your camera. People are constantly switching between programs like Microsoft Teams, Skype, and Zoom, among other software. Sometimes the camera is already in use, so it won’t show up for Zoom.
You Forget to Record the Zoom
There are settings in Zoom that will auto-record your meeting as soon as you start it up. If it’s important the presentation gets recorded, that might be a good way to go.
Zoom is Pulling from the Wrong Audio Source
Just because you are wearing a headset, doesn’t mean that’s where Zoom is getting its audio. Check your audio settings, even if people can technically hear you.
Somebody in Your Audience is Talking (or Eating) Loudly
When Zoom picks up a voice, that participant is going to fly to the top of the participant list. Keep it open and mute people. It’s way more effective than just lecturing your audience to “put their mics on mute.”
The Audience is Not Seeing Your Screen
Most of the time this is a pretty basic user error. You started to do the screen sharing stuff but just didn’t hit the right button.
For important webinars I usually show up with two computers. One to use as the presenter, and one to give me the audience’s view. I get to keep that one on mute, but it lets me see what they see.
You Lose Your Internet
It happens. For really important things, this is a good reason to have a backup presenter or producer who can keep the audience engaged (and the Zoom running) while you try to get your internet back.
Assuming you have wifi or some form of cable internet and a smart phone. Another thing you could do is have your cell phone at the ready as a secondary internet source. Have the Zoom info ready, and just pick up where you left off. Not a perfect solution, but way better than just disappearing.
Comment on How to formulate strong outputs by Thomas Winderl
In reply to Mirian.
Hi Miriam. Thanks, nice to know. On outcome formulas: That’s a bit more difficult. In general, I would start with “BY data” to make it time-bound. Then we have two options: 1) duty-bearers’ (most of the time the government’ + doing something different or better. For example: By 2025, the Department of Communication responds to copy-right infringement complaints on average within 24 hours. 2) right-holders (=citizens) + a difference in their lives or doing something different. For example: By 2026, vulnerable adolescents in X consume less alcoholic drinks. If you want to know more, we currently offer a free course on Results Based Management on our Results Lab website at https://products.results-lab.com/free_email_course_on_results_based_management
How Drawing Makes Us Better at Data Visualization
“Which software program is best for data visualization???” This is one of the most common questions about getting started with graphs, charts, and diagrams.
There are plenty of great software programs, like Excel and Tableau—and even PowerPoint!
There’s also a lesser-known secret to creating strong data visualizations: hand-drawn sketches!
Watch Our Episode of Sketchnote Chats
Want to learn more about how hand-drawn sketches are essential for data visualization?
I was recently interviewed by Emily Mills for an episode of the Sketchnote Chats series.
Emily is a professional illustrator and expert in sketchnoting. She is also the founder of the Sketchnote Academy and author of The Art of Visual Notetaking.
Recognize Emily’s name? She was a guest speaker in our Report Redesign course and I was happy to return the favor.
You can watch our episode here:
How Drawing Can Improve Our Data Visualizations
I use drawing in two ways:
- To brainstorm which chart type I need, and
- To piece together multiple charts on a page or screen (e.g., when designing dashboards that are composed of multiple smaller charts).
Drawing Helps Us Brainstorm Which Chart Type to Use
Here’s how I use hand-sketching to develop better visualizations.
First, I open my spreadsheet with my tabulated data. I might have a table with several columns and several rows of already-analyzed data.
Second, I set a timer on my phone for 10-15 minutes.
Third, I draw as many ideas as possible on paper. I think about whether this dataset can be represented through a donut chart, stacked column chart, hex map, Sankey diagram, and so on.
When I started doing this—back in 2012—I was only able to generate a handful of chart types during each brainstorming session. Now, I can generate a dozen ideas each time.
My audience benefits because they don’t have to suffer through the same ol’ bar charts over and over and over.
My audience also benefits because I’ve thought through the dataset at a much more sophisticated level. I explore whether the dataset has interesting chronological patterns that might be visualized in a line chart; whether there are interesting geographic patterns that might be visualized in a map, etc.
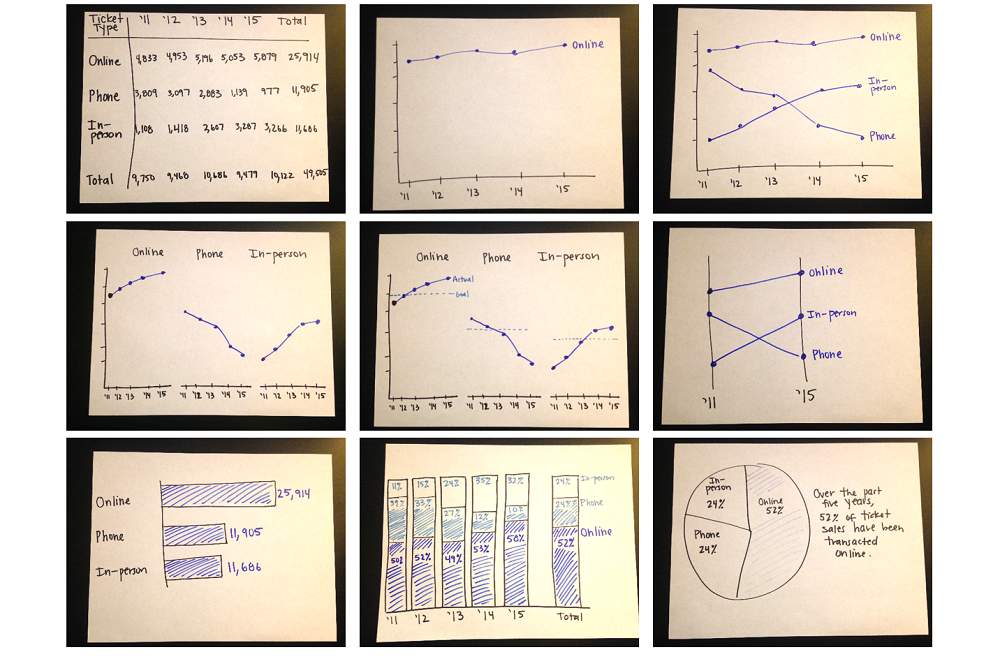
Here’s an example from the Harris Theater in Chicago, where I set my timer for 10-15 minutes, and was able to generate nine ideas for visualizing their (fictional) ticket sales data over time:
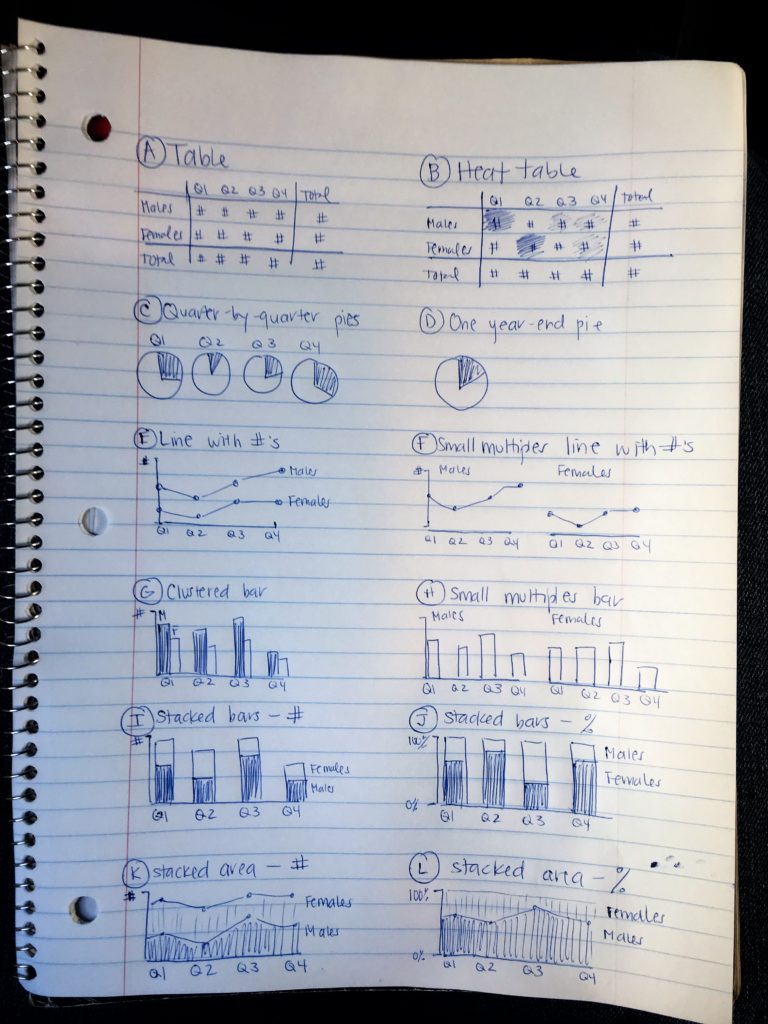
Here’s another example from a juvenile justice project, where I set my timer for 10-15 minutes and brainstormed 12 ideas for updating their pie charts:
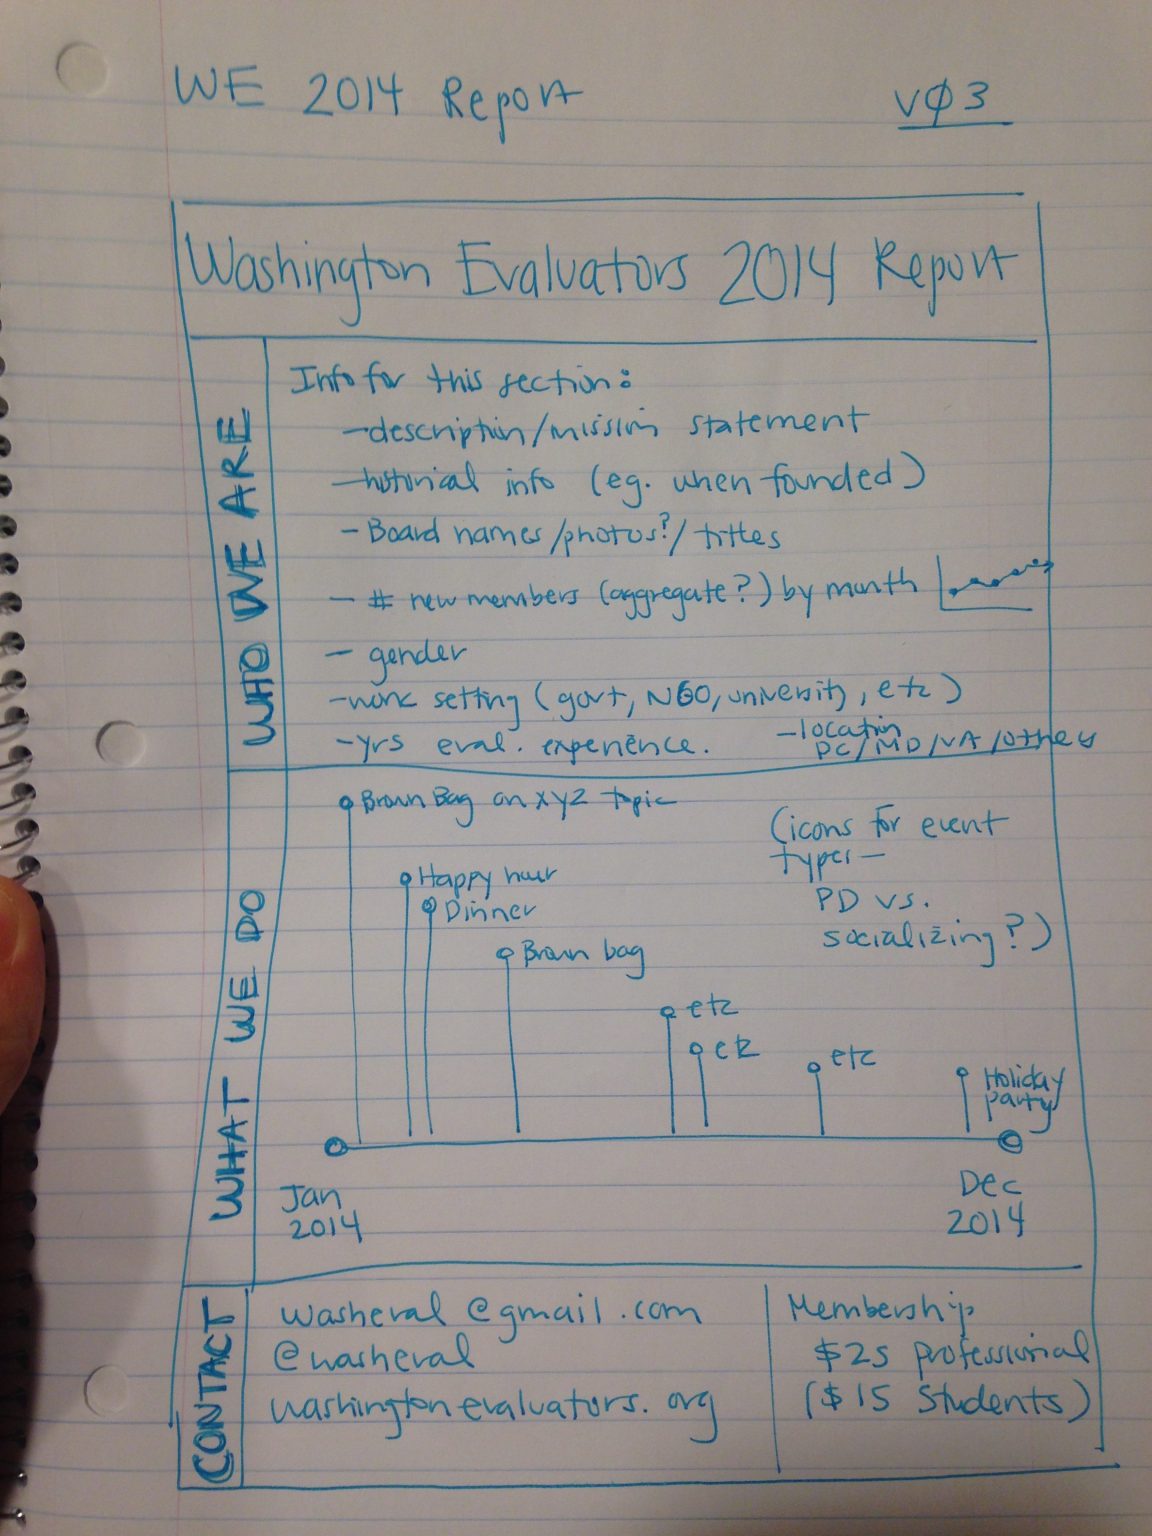
Drawing Helps Us Arrange Multiple Charts on a Page or Screen
Once I’ve selected lots of individual graphs to use, I often need to arrange them together on a page or screen.
For example, if I’m designing an infographic, the one-page summary might involve three, four, or five individual graphs.
Or, if I’m designing a dashboard, the screen might involve three, four, or five individual graphs.
I need to decide which graph should be displayed first, second, or third. Is there a natural sequence?
I also need to decide which graphs “go together.” Is there a natural grouping? A categorization? Similar graphs should be next to each other on the infographic or dashboard.
I use a pen and paper to sketch what that page could look like.
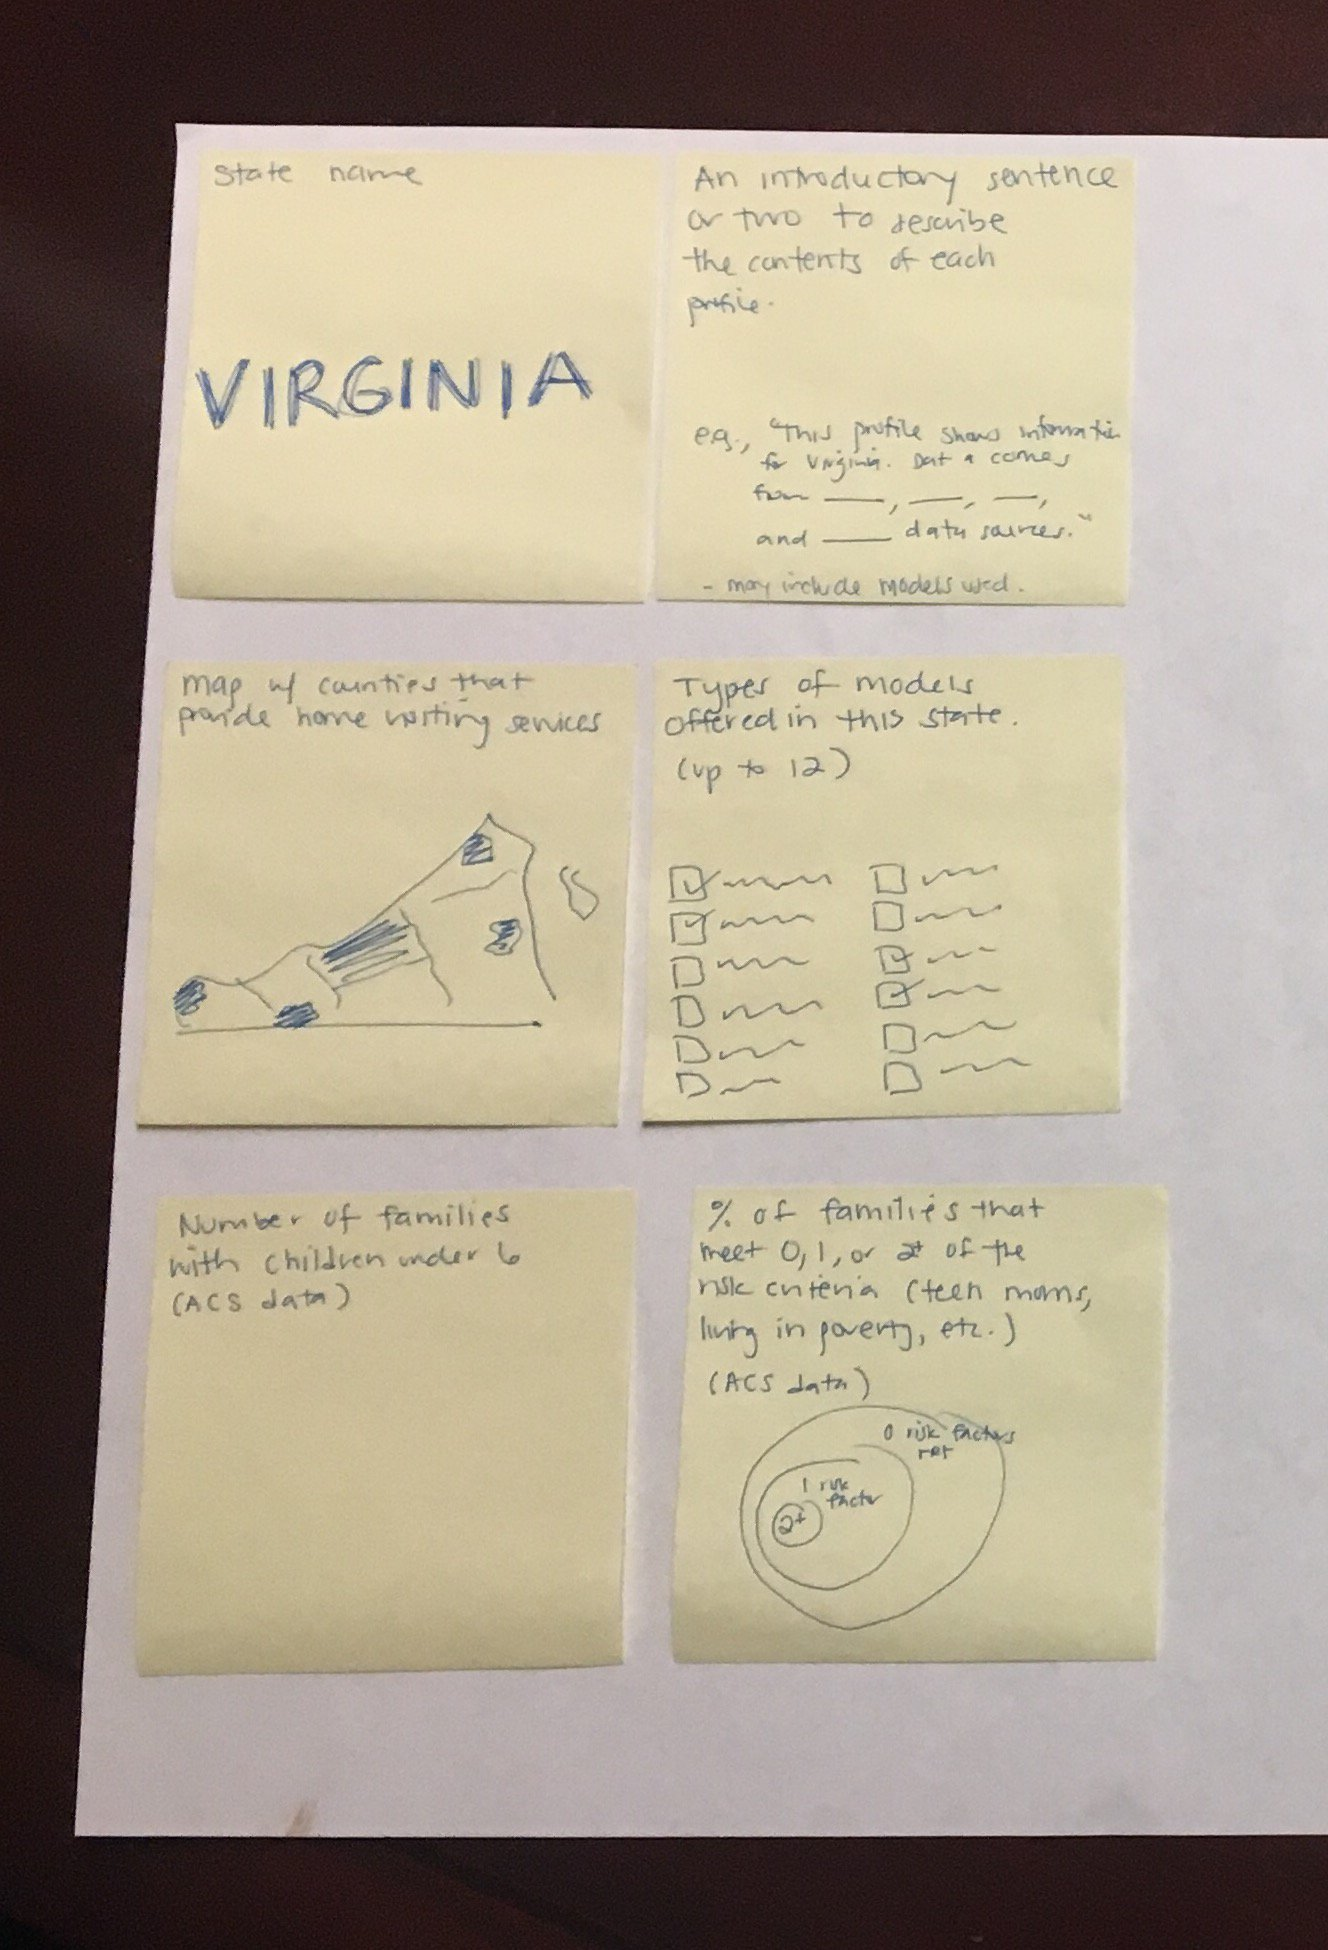
Here’s an example from the National Home Visiting Resource Center, where we used sticky notes to decide how to arrange multiple visualizations on the page:
Get Started with Sketching for Data Visualization
Want to incorporate sketching into your own dataviz design process? In this article, I share my step-by-step process.
Your Turn
Have you used hand-drawn sketches to develop better data visualizations? Comment below!