• Skip to main content
  • Skip to footer
  • Home

The May 13 Group

the next day for evaluation

  • Get Involved
  • Our Work
  • About Us
You are here: Home / Archives for allblogs

allblogs

Feb 17 2021

How to Create Power Point Report Templates in Canva

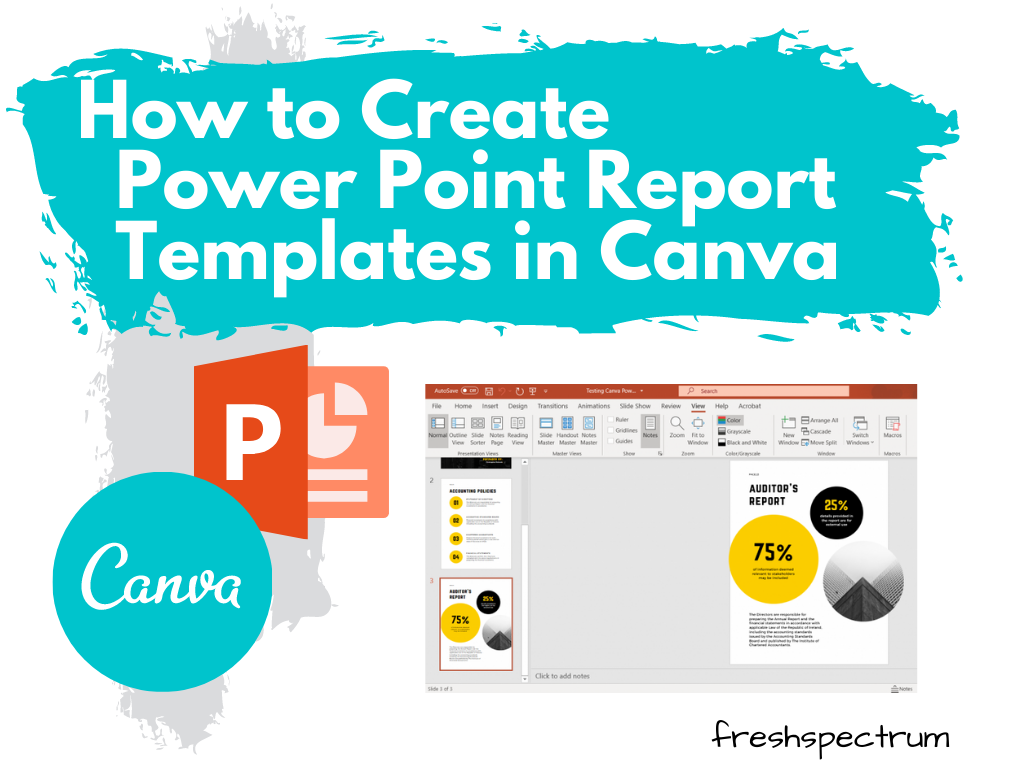
This is the first in a series of posts on data design in Canva. Today I’ll show you how to use Canva to create Power Point templates.

Power Point is certainly the most designer friendly tool out of Microsoft Office’s big three (Word, PowerPoint, and Excel). When working with clients hesitant to leave the comforts of the tools they know, it’s often my tool of choice for visual reports.

But working in Canva just makes the whole design process a heck of a lot easier (and faster). Lucky for us, there is no reason to choose between the two. We can have both!

How to Create Power Point Report Templates in Canva - Illustration

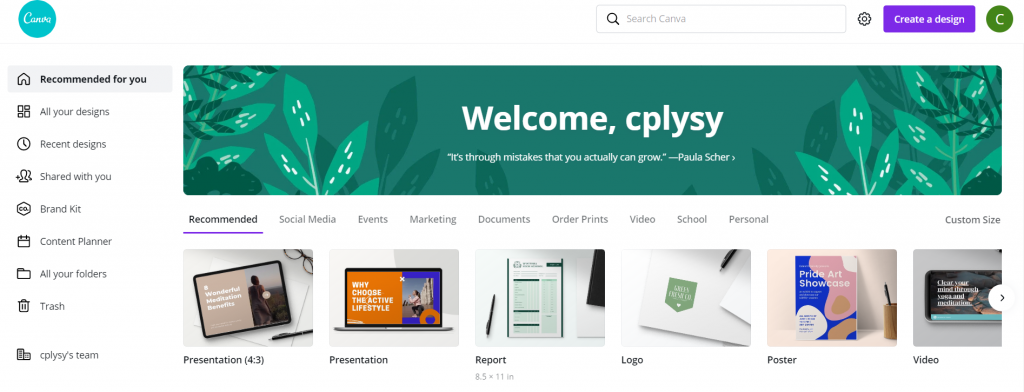
Choose your report size.

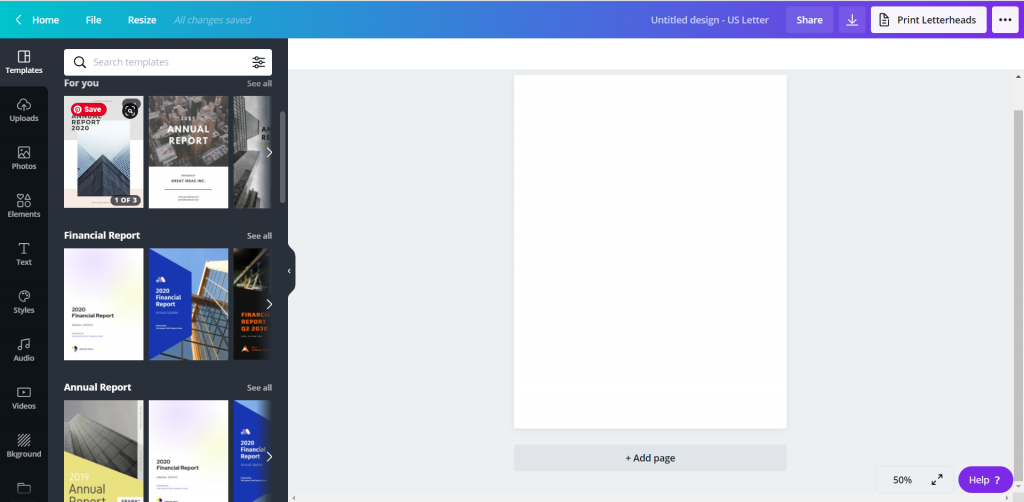
Okay, so go to Canva.com (sign up for an account if you don’t have one already) and pick a size. Reports come in all shapes and sizes these days so you don’t have to default to letter size (8.5 x 11).

But for the sake of this example, we’ll just choose the “Report” option.

How to Create Power Point Report Templates in Canva - Canva Open Screen

Pick out a Base Template

Templates are what make designing in Canva so easy. They take care of a lot of the visual design grunt work, so we can just pick a style we like and adapt for our purposes.

You’ll see the templates on the left side of the page. Some templates (especially report templates/presentation templates/magazine templates) include multiple page styles. Hovering your mouse over a template will scroll through the internal page options (if it has any).
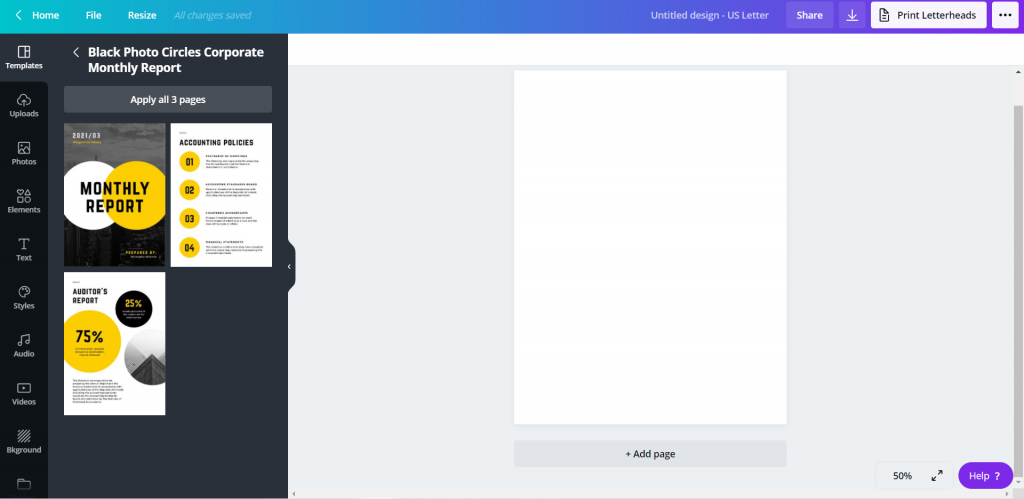
How to Create Power Point Report Templates in Canva - Pick out a Base Template

Choosing the Pages

When you pick a template, you have the option to go page by page adding in the template. Or you can just click the “Apply all…” button to give yourself a base to start.

How to Create Power Point Report Templates in Canva - Choosing a Template

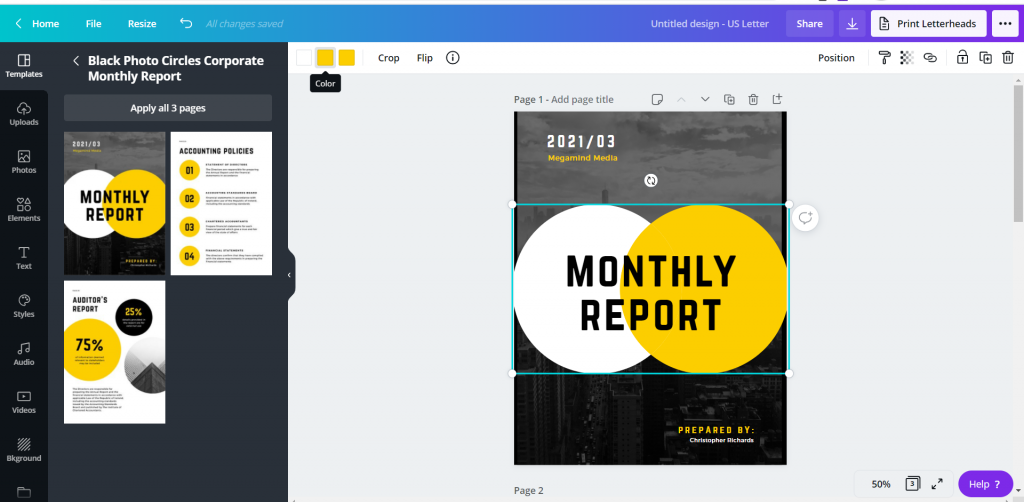
Tweak the Template to Meet Your Needs

Now that you have a base, just tweak the template for your own purposes.

Change colors, pictures, fonts, text, and add your logos. The templates can give you the start, a base aesthetic, but you can really make it your own.

How to Create Power Point Report Templates in Canva - Changing Fonts and Colors

Downloading the PowerPoint

So the basic download options in Canva include image and print standards (PNG, JPG, PDF). These are always the best way to ensure your formatting is maintained in final versions. So you won’t find the PowerPoint option when clicking “Download.”

Saving it to PowerPoint is less about design control, and more about creating something that can be easily altered/adapted by others after you are finished your work. To reach it, instead of clicking download, you are going to click the “…” menu button in the upper right hand of the screen.

How to Create Power Point Report Templates in Canva Illustration - Saving as PowerPoint

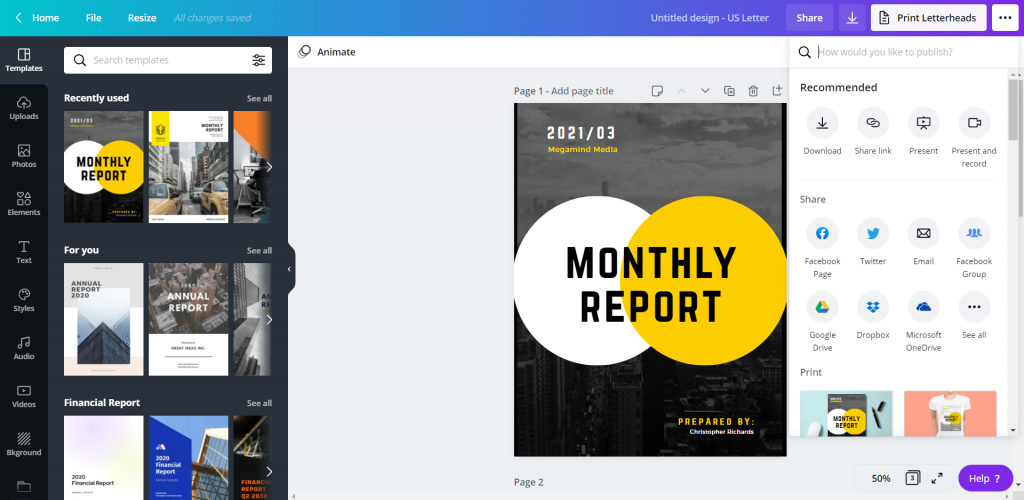
Under the “Share” options you will see another “…” button for “See all.” Click on that.

How to Create Power Point Report Templates in Canva Illustration - Saving as PowerPoint

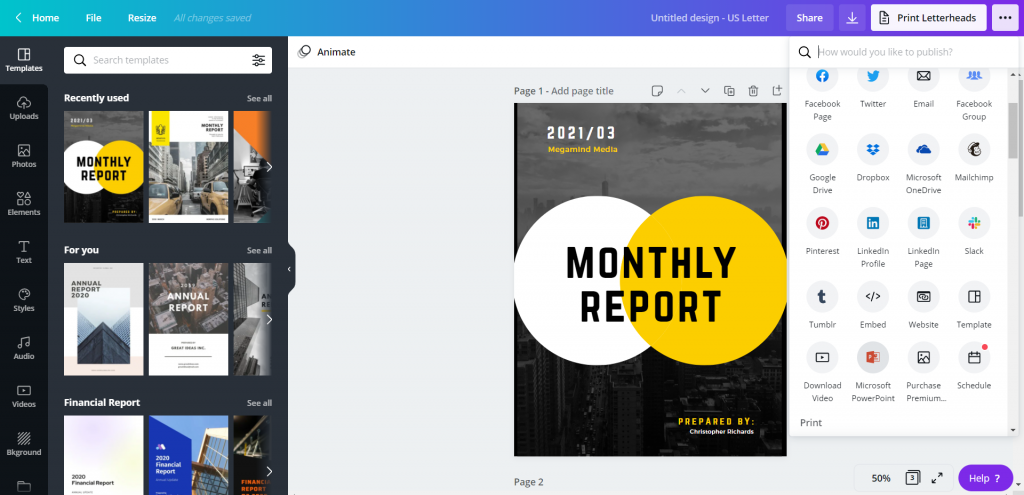
Find the save to Microsoft PowerPoint. When you click that, you’ll have the option to select the pages you want to download (or just download all pages).

How to Create Power Point Report Templates in Canva Illustration - Downloading PowerPoint

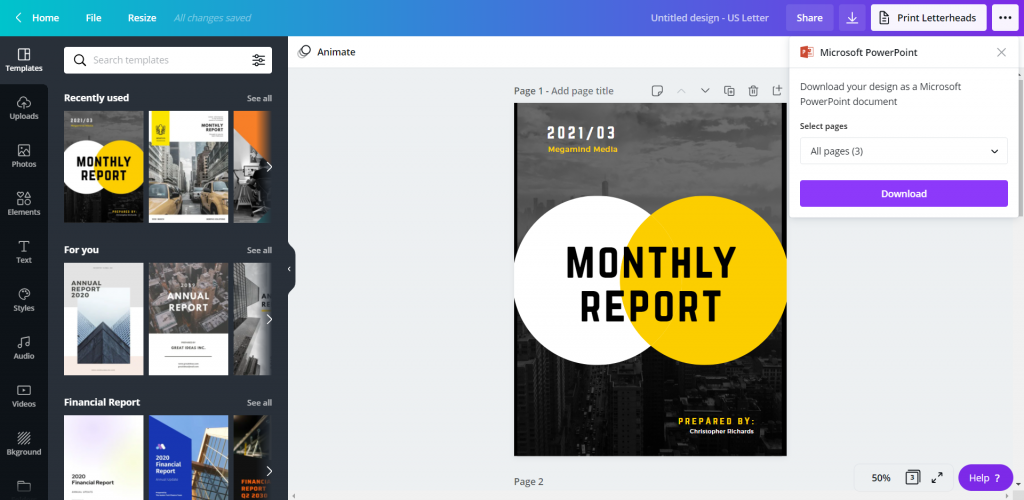
Click download and you’ll have a new pptx file on your computer.

How to Create Power Point Report Templates in Canva Illustration - Design Saved

Checking the File in PowerPoint

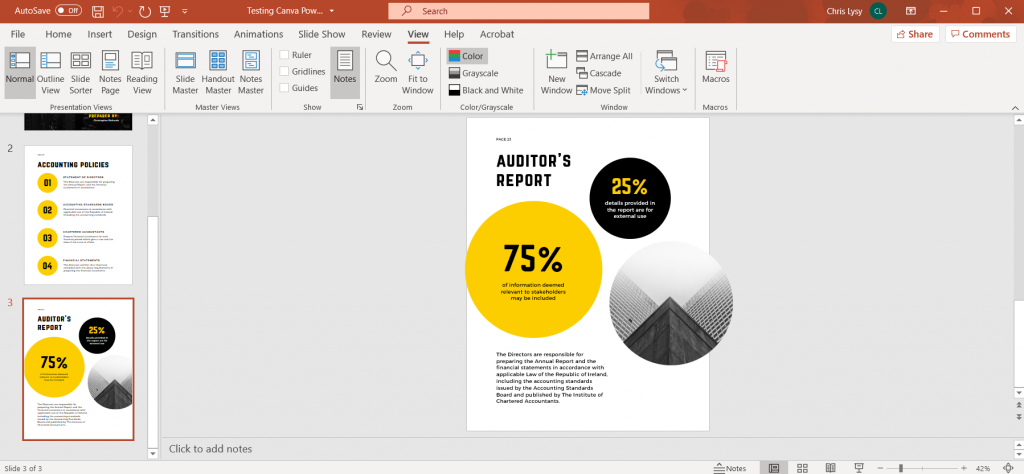
So it’s not always a perfect conversion, but it’s really close.

Depending on the fonts you have chosen in Canva, and the fonts you have on your computer, the text might get a little wonky. Shapes might also come in with different colors.

Canva also doesn’t show you when a shape extends outside the border of a file, but PowerPoint will. Don’t freak out when you see a shape extend off the edge, it won’t print that part.

How to Create Power Point Report Templates in Canva Illustration - Checking File in PowerPoint

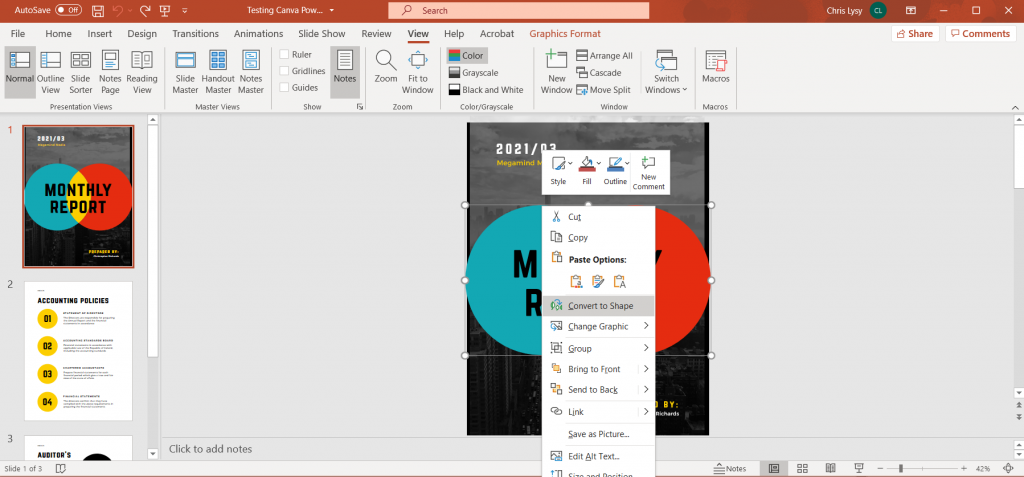
Some of the shapes, even though they might not be initially editable in PowerPoint can be converted with a right click (Convert to Shape). Like for the Venn on the front of this report which inexplicably changed color on the download.

How to Create Power Point Report Templates in Canva Illustration - Converting to Shape in PowerPoint

Sure it’s wonky, but that’s an Office product for you.

We make tradeoffs all the time. By switching over to PowerPoint, you miss out on some of the stuff that’s easy in Canva. And neither is as technically clean as working in a vector program like Adobe Illustrator or XD.

But PowerPoint is a known quantity for over a billion people, and as with everything software, there is a power in numbers.

Freshspectrum Cartoon by Chris Lysy inspired by Stephanie Evergreen.
"Why don't we go with purple for the slide backgrounds?"
"What a coincidence, purple's my favorite color." [lady wearing lots of purple]
Cartoon from 2014 – Inspired through an interview with Stephanie Evergreen about her slide reboots.

Written by cplysy · Categorized: freshspectrum

Feb 16 2021

Photo Love

Six hacks for renovating your evaluation report

PART 5

This article is Part 5 in a six-part series that walks you through how to reno your evaluation reports using six of Canva’s design lessons.

  • Part 1 focused on how to take your audience on a journey using storytelling techniques.

  • Part 2 focused on how to format your report with a consistent, cohesive look using colour and font.

  • Part 3 dove into grouping and spacing elements in your reporting.

  • Part 4 explored how to make elements in your report pop using focal points.

Speaking of focal points, let’s talk more about how to use images as focal points in your reports.

Why you should use images in your reports

Images are naturally dominant elements. In Part 4 of this series, we talked about the importance of dominance, but in a nutshell dominant elements tell our eyes where to look. Directing your audience’s eyes to an image is important because images convey stories. Like we talked about in Part 1, stories are important because they help us store information in our memory for future use. A good example of using images to convey a story is the Save the Children “Lottery of Life” campaign. We know just by looking at two images what is means to win the lottery in life.

Save The Children - Lottery of Life Campaign (Image 1)

Save The Children – Lottery of Life Campaign (Image 1)

Save The Children - Lottery of Life Campaign (Image 2)

Save The Children – Lottery of Life Campaign (Image 2)

How to select images for your report

Strong imagery

When selecting images, it is important to consider strong imagery. Strong images are simple, clear, and sincere images, like those used in the Lottery of Life campaign. The images are not overly complicated or cluttered. The images are also not grainy or blurred. In addition, the images don’t give off that cheesy stock photo vibe. It’s true that some stock images are definite no-go’s; however, with a discerning eye, you can often find some beautiful images.

We use iStock to find images and illustrations. If you can’t spend money to buy an image there are other options out there, you just might need to spend more time digging to find what you’re looking for. Sometimes Google Images is a good place to look, but make sure to use the ‘tools’ function filter using the appropriate ‘usage rights’ (e.g., creative commons licenses). Pixabay and Flickr are other sites to use for free images. Also, don’t forget your own photo library. You will be surprised at the photos you can find when looking back into your albums. Or, embrace your inner photographer and shoot some images for your report. We used the image below in a report. The picture is art from the side of a building that I took a photo of using my iPhone.

Example of using your own photography in your reporting

Example of using your own photography in your reporting

Relevance

Strong images also need to be relevant to the story you are trying to convey. When drafting my evaluation reports I think about the outcomes that the program is trying to achieve and then search for images that convey those outcomes. It is also important to think about representativeness in your images. If your evaluation takes place in a diverse population then your imagery should represent the diversity of that population. CreateHERstock is a site that was created after realizing “there was a big problem with stock imagery and the lack of representation.” It is a free stock image library focused on representing Black women. Whether it is race, gender or age, make sure the imagery aligns with your narrative. When you have chosen your image(s), send it to your stakeholders to review the image. I once chose an image and designed an entire report around it, only to find out that the image didn’t resonate with my clients.

How to use images in your report

While it is nice to use various images to convey your message, you may not have the budget for that. Not to worry! The following are some tips for how to incorporate and use that image in your report.

Starting and ending with an image

Two of the easiest ways to incorporate images into your reporting are to insert an image on the first and last pages. There is nothing worse than looking at a report that has nothing but a white background and tiny black writing. Inserting a picture on the cover instantly grabs the audience’s attention and gets them thinking about what is inside. Putting the same image on the back page is also a nice way to tie the report together.

Cover Page

Cover Page

Back Page

Back Page

Call-out boxes

We have talked in previous posts about the importance of breaking up text in your report; I often will do that with call out boxes and sidebars. To help draw the eyes to these areas I will sometimes insert a picture, again to help people understand what is in the box and why it is important

Example of a call-out box with an image

Example of a call-out box with an image

Backgrounds

Another idea is to take the image and add it as a background to certain pages in your report. The image below shows how we took the same cover image used in the rest of the report but used it as a background for a process we wanted to illustrate.

Example of a background image

Example of a background image

Don’t be afraid to crop, scale, re-colour and play with transparency. With some quick manipulations, you can use one image throughout your report without it looking stale. Rather, it looks like you have a report that looks cohesive and engaging.

Take a look at some reports you are creating. Are there opportunities to make incorporate some photo love? Try it out and make sure to stay tuned for the sixth article in our six-part series, “Dial Down Your Data” where I talk about simplifying your data, so it conveys what matters most.


Sign up for our newsletter

We’ll let you know about our new content, and curate the best new evaluation resources from around the web!


We respect your privacy.

Thank you!

Written by cplysy · Categorized: evalacademy

Feb 16 2021

Evaluation Roundup – January 2021

Welcome to our monthly roundup of new and noteworthy evaluation news and resources – here is the latest.

Have something you’d like to see here? Tweet us @EvalAcademy or connect on LinkedIn!

New and Noteworthy — Resources

What is a theory of change?

Stanford’s Social Innovation Review (SSIR) published an article in its fall 2020 magazine titled “Unpacking the Theory of Change.” In this article, Maoz Brown unpacks and organizes into a framework the various meanings to the term “theory of change” and its various objectives. As Brown explains, we would all love one clear and consistent explanation for how ToCs are to be used; however, the article “aims for a more realistic goal” of how to think about and express ToCs differently.

If you’re looking for a quick, light-hearted review of ToCs then check out Chris Lysy’s (@evalcentral) “What is a Theory of Change? Cartoon Glossary.

Systems change – the “do nots”

This recent article by SSIR explores the history of “systems enthusiasm” and how to continue to progress systems thinking. The authors explain there is no consensus on what is working from a “genuine systems perspective.” However, they offer a “thou shalt not” list that compares the principles and characteristics of a systems approach to a traditional approach (i.e., the though shalt nots) as a means for informing how to advance change.

Evaluating organizational change efforts

The Centre for Evaluation Innovation (CEI) recently released a brief that describes an evaluative approach it took to an organizational change process at the Fetzer Institute. CEI describes the “hybrid participatory case study” approach they took, what that means, why they chose this approach, the steps for this approach, the outcomes of this work, and CEI’s reflections on this approach. If you are supporting organizations as they embark on organizational culture change efforts then definitely check out this resource!

New and Noteworthy — Conferences, Webinars and Courses

Conference

Rapid Evaluation in Health Care Conference

Organized by: Nuffield Trust and the Health Foundation

Dates: January 26 – 28, 2021

Webinars

Program Evaluation in Practice: A Case Study of Central State University’s STEM Success Center

Sponsors/Presenters: The Rucks Group and Dr. Morakinyo Kuti, Project Director of the U.S. Department of Education’s funded STEM Success Center

Date: February 4, 2021

Time: 2:00pm – 3:30pm EDT

Competing Agendas: Bridging Funder and Organization Expectations in Evaluation

Presenters:

David Kurfurst and John Biles (Immigration, Refugees and Citizenship Canada)

Dr. Leah Hamilton (Mount Royal University),

Vicki Sinclair and Kathy Sherrell (Manitoba Association of Newcomer Organizations and Immigrant Services Society of BC)

Date: February 5, 2021

Time: 1:00pm EST

Evaluation Crash Course for Non-Evaluators

Presenters: Emma Leeburg, Lyssa Wilson Becho

Date: February 24, 2021

Time: 1:00pm – 2:00pm EST

Courses

Measurement Evaluation and Learning (MEL)

Instructor: Clear Horizon Academy

Start Date: February 12, 2021

Program Monitoring

Sponsor/Instructor: EnCompass Learning Center / Kerry Bruce

Start Date: February 1 (9:00am – 12:00pm EDT); February 3 (9:00am – 12:00pm EDT)

Being an Evaluator

Sponsor/Instructor: EnCompass Learning Center / Donna Podems

Start Date: February 24 (9:00am -12:00pm EDT); February 25 (9:00am – 12:00pm EDT)

Written by cplysy · Categorized: evalacademy

Feb 14 2021

La autoevaluación en las organizaciones

Fuente

Involucrar a las organizaciones en su propia auto-evaluación tiene grandes beneficios:

  • Promueve el aprendizaje de alta calidad
  • Contribuye al desarrollo de habilidades
  • Fomenta el desarrollo personal
  • Aumenta la confianza de los miembros, reduce el estrés y mejora la motivación de los miembros
  • Fomenta la participación en la organización, por lo que es ideal para las organizaciones que normalmente encuentran un poco incómodas las actividades en grupo o las tareas de organizaciones activas
  • Cuando se usa junto con el trabajo en grupo, puede ser una excelente manera de evaluar el papel personal y la contribución de uno en la experiencia del grupo y el proceso de aprendizaje.

Las autoevaluaciones organizacionales son una herramienta útil para los miembros/equipos/departamentos de la organización y pueden ayudar a los gerentes de la organización a comprender cómo piensan sus miembros/equipos. Pero no es una habilidad con la que nacemos, por lo que es importante establecer las condiciones necesarias para que tenga éxito.

Ser capaces de auto evaluarnos es una habilidad fundamental para aprender, mejorar y avanzar. Sin embargo, existen algunos retos para la autoevaluación que revisaremos, indicando también posibles soluciones o mitigaciones:

1.Subestimar el logro: los miembros tienden a infravalorar lo que han hecho.

2.Sobrestimar el logro: dan más peso a un trabajo de lo que realmente se merece.

3.Olvidar logros: Esto puede surgir cuando se les pide a los miembros de la organización que envíen ejemplos de trabajo para un portafolio o presentación.

4.Recordar un logro pero subestimando su importancia: no apreciar por completo la importancia de un resultado, porque quizás contenía conceptos que aún no se han cubierto en las lecciones.

5.Malinterpretación de la tarea: En algunos casos, los miembros pueden hacer un trabajo de autoevaluación que, en sí mismo, es brillante, pero que también es completamente irrelevante, porque se les pidió que hicieran otra cosa.

Algunas soluciones o mitigaciones: Para introducir la autoevaluación podemos poner en práctica una serie de elementos:

1.Hagamos claros los criterios: Los criterios de evaluación deben quedar claros para la organización desde el principio,  poniendo los criterios en el lenguaje de la organización. Otra es preparar ejemplos de trabajos pasados que se hayan evaluador según los criterios. Otro más es lograr que los miembros de la organización marquen el trabajo de otros departamentos.

2.Utilizar la evaluación entre pares: La evaluación por pares es útil porque implica tener una conversación sobre qué tan bien un trabajo cumple con los criterios de evaluación.

3.Vincular el logro a las metas: Si el objetivo de un trabajo se aclara, entonces la pregunta para el miembro de la organización no es “¿Qué tal lo he hecho en este trabajo o en esta tarea?” sino “¿Hasta qué punto lo que he hecho cumple con el objetivo?”.

4.Repasar y aprender de los errores al hacer la auto evaluación: Es fundamental dedicar tiempo a revisar los informes de autoevaluación para averiguar qué errores comunes cometieron los miembros de la organización al realizarla auto evaluación


Referencias

5 problemas con la autoevaluación y 4 soluciones

¿Revisión entre Pares o autoevaluación? Beneficios y desafíos


Written by cplysy · Categorized: TripleAD

Feb 12 2021

What is Equitable Evaluation? Cartoon Glossary

This is a series of posts providing quick overviews of important topics in research and evaluation. Each post in this series will include at least 3 cartoons from my archives and at least 3 links to recommended resources. I only give quotes here and recommend that you follow the links below each quote for more detailed information.

Cartoon by Chris Lysy of freshspectrum
As you all know, this leadership team has been facing some criticism for our total lack of diversity. Since equity is one of our core values we have decided to create a space on our team for one person of color to be hired into leadership in the coming year.

Three principles ground the Equitable Evaluation Framework™

As foundations and nonprofits, and the consultants and philanthropy-serving organizations that support them, explore what it means to be about and for equity, they must consider how all their assets and efforts align.

We believe that evaluation for these entities must be re-imagined based on three principles:

EVALUATION WORK IS IN SERVICE OF AND CONTRIBUTES TO EQUITY

Production, consumption, and management of evaluation and evaluative work should hold at its core a responsibility to advance progress towards equity.

EVALUATIVE WORK SHOULD BE DESIGNED AND IMPLEMENTED IN A WAY THAT IS COMMENSURATE WITH THE VALUES UNDERLYING EQUITY WORK

It should be multi-culturally valid and oriented toward participant ownership.

EVALUATIVE WORK CAN AND SHOULD ANSWER CRITICAL QUESTIONS ABOUT THE:

Effect of a strategy on different populations and on the underlying systemic drivers of inequity, and the ways in which history and cultural context are tangled up in the structural conditions and the change initiative itself.

Equitable Evaluation Initiative – The Equitable Evaluation Framework

Cartoon by Chris Lysy of freshspectrum
You know the saying, "do as they say, not as they do."
Sorry, but I have to call BS on that statement.

Supporting equitable evaluation without practicing it is hypocritical. 

It also makes it harder for others to practice equitable evaluation by reinforcing professional norms and orthodoxies that are decidedly inequitable but still widely accepted and practiced. If we are truly committed to it, we have to be willing to bear potential risks to our revenue stream or client relationships.

Equitable Evaluation Framework Applies to all Evaluation – Center for Evaluation Innovation

Cartoon by Chris Lysy of freshspectrum
"This is my racial equity lens. I just put it on when our racist policies and practices trigger the occasional PR crisis."

Equitable evaluation affects everyone engaged in the process, including those who use evaluation findings. Its primary aim is not only to shed light on the factors that impede equity, but also to analyze and assess interventions, investments, and strategies through a lens of promoting equity.

Raising the Bar – Integrating Cultural Competence and Equity: Equitable Evaluation Dean-Coffey, J., Casey, J., & Caldwell, L. D. (2014). The Foundation Review, 6(2)

Written by cplysy · Categorized: freshspectrum

  • « Go to Previous Page
  • Go to page 1
  • Interim pages omitted …
  • Go to page 204
  • Go to page 205
  • Go to page 206
  • Go to page 207
  • Go to page 208
  • Interim pages omitted …
  • Go to page 310
  • Go to Next Page »

Footer

Follow our Work

The easiest way to stay connected to our work is to join our newsletter. You’ll get updates on projects, learn about new events, and hear stories from those evaluators whom the field continues to actively exclude and erase.

Get Updates

Want to take further action or join a pod? Click here to learn more.

Copyright © 2026 · The May 13 Group · Log in

en English
af Afrikaanssq Shqipam አማርኛar العربيةhy Հայերենaz Azərbaycan dilieu Euskarabe Беларуская моваbn বাংলাbs Bosanskibg Българскиca Catalàceb Cebuanony Chichewazh-CN 简体中文zh-TW 繁體中文co Corsuhr Hrvatskics Čeština‎da Dansknl Nederlandsen Englisheo Esperantoet Eestitl Filipinofi Suomifr Françaisfy Fryskgl Galegoka ქართულიde Deutschel Ελληνικάgu ગુજરાતીht Kreyol ayisyenha Harshen Hausahaw Ōlelo Hawaiʻiiw עִבְרִיתhi हिन्दीhmn Hmonghu Magyaris Íslenskaig Igboid Bahasa Indonesiaga Gaeilgeit Italianoja 日本語jw Basa Jawakn ಕನ್ನಡkk Қазақ тіліkm ភាសាខ្មែរko 한국어ku كوردی‎ky Кыргызчаlo ພາສາລາວla Latinlv Latviešu valodalt Lietuvių kalbalb Lëtzebuergeschmk Македонски јазикmg Malagasyms Bahasa Melayuml മലയാളംmt Maltesemi Te Reo Māorimr मराठीmn Монголmy ဗမာစာne नेपालीno Norsk bokmålps پښتوfa فارسیpl Polskipt Portuguêspa ਪੰਜਾਬੀro Românăru Русскийsm Samoangd Gàidhligsr Српски језикst Sesothosn Shonasd سنڌيsi සිංහලsk Slovenčinasl Slovenščinaso Afsoomaalies Españolsu Basa Sundasw Kiswahilisv Svenskatg Тоҷикӣta தமிழ்te తెలుగుth ไทยtr Türkçeuk Українськаur اردوuz O‘zbekchavi Tiếng Việtcy Cymraegxh isiXhosayi יידישyo Yorùbázu Zulu