• Skip to main content
  • Skip to footer
  • Home

The May 13 Group

the next day for evaluation

  • Get Involved
  • Our Work
  • About Us
You are here: Home / Archives for allblogs

allblogs

May 26 2020

Evaluación/investigación con/sobre adolescentes

La Oficina de Investigación – Innocenti es un centro de investigación de UNICEF que tiene el mandato de liderar en la investigación que se centren en lagunas de conocimiento relevantes para los objetivos estratégicos de UNICEF y sus socios clave.

La Oficina de Investigación Innocenti emprende investigaciones:

-Prospectivas para identificar desafíos y oportunidades para la comunidad global en temas que afectan a los niños.

-Sobre temas delicados y emergentes, probando y proponiendo políticas y soluciones alternativas

La Oficina de Investigación Innocenti ha realizado una revisión de metodologías de investigación contemporáneas para el bienestar de los adolescentes en países de bajos y medianos ingresos (2017)

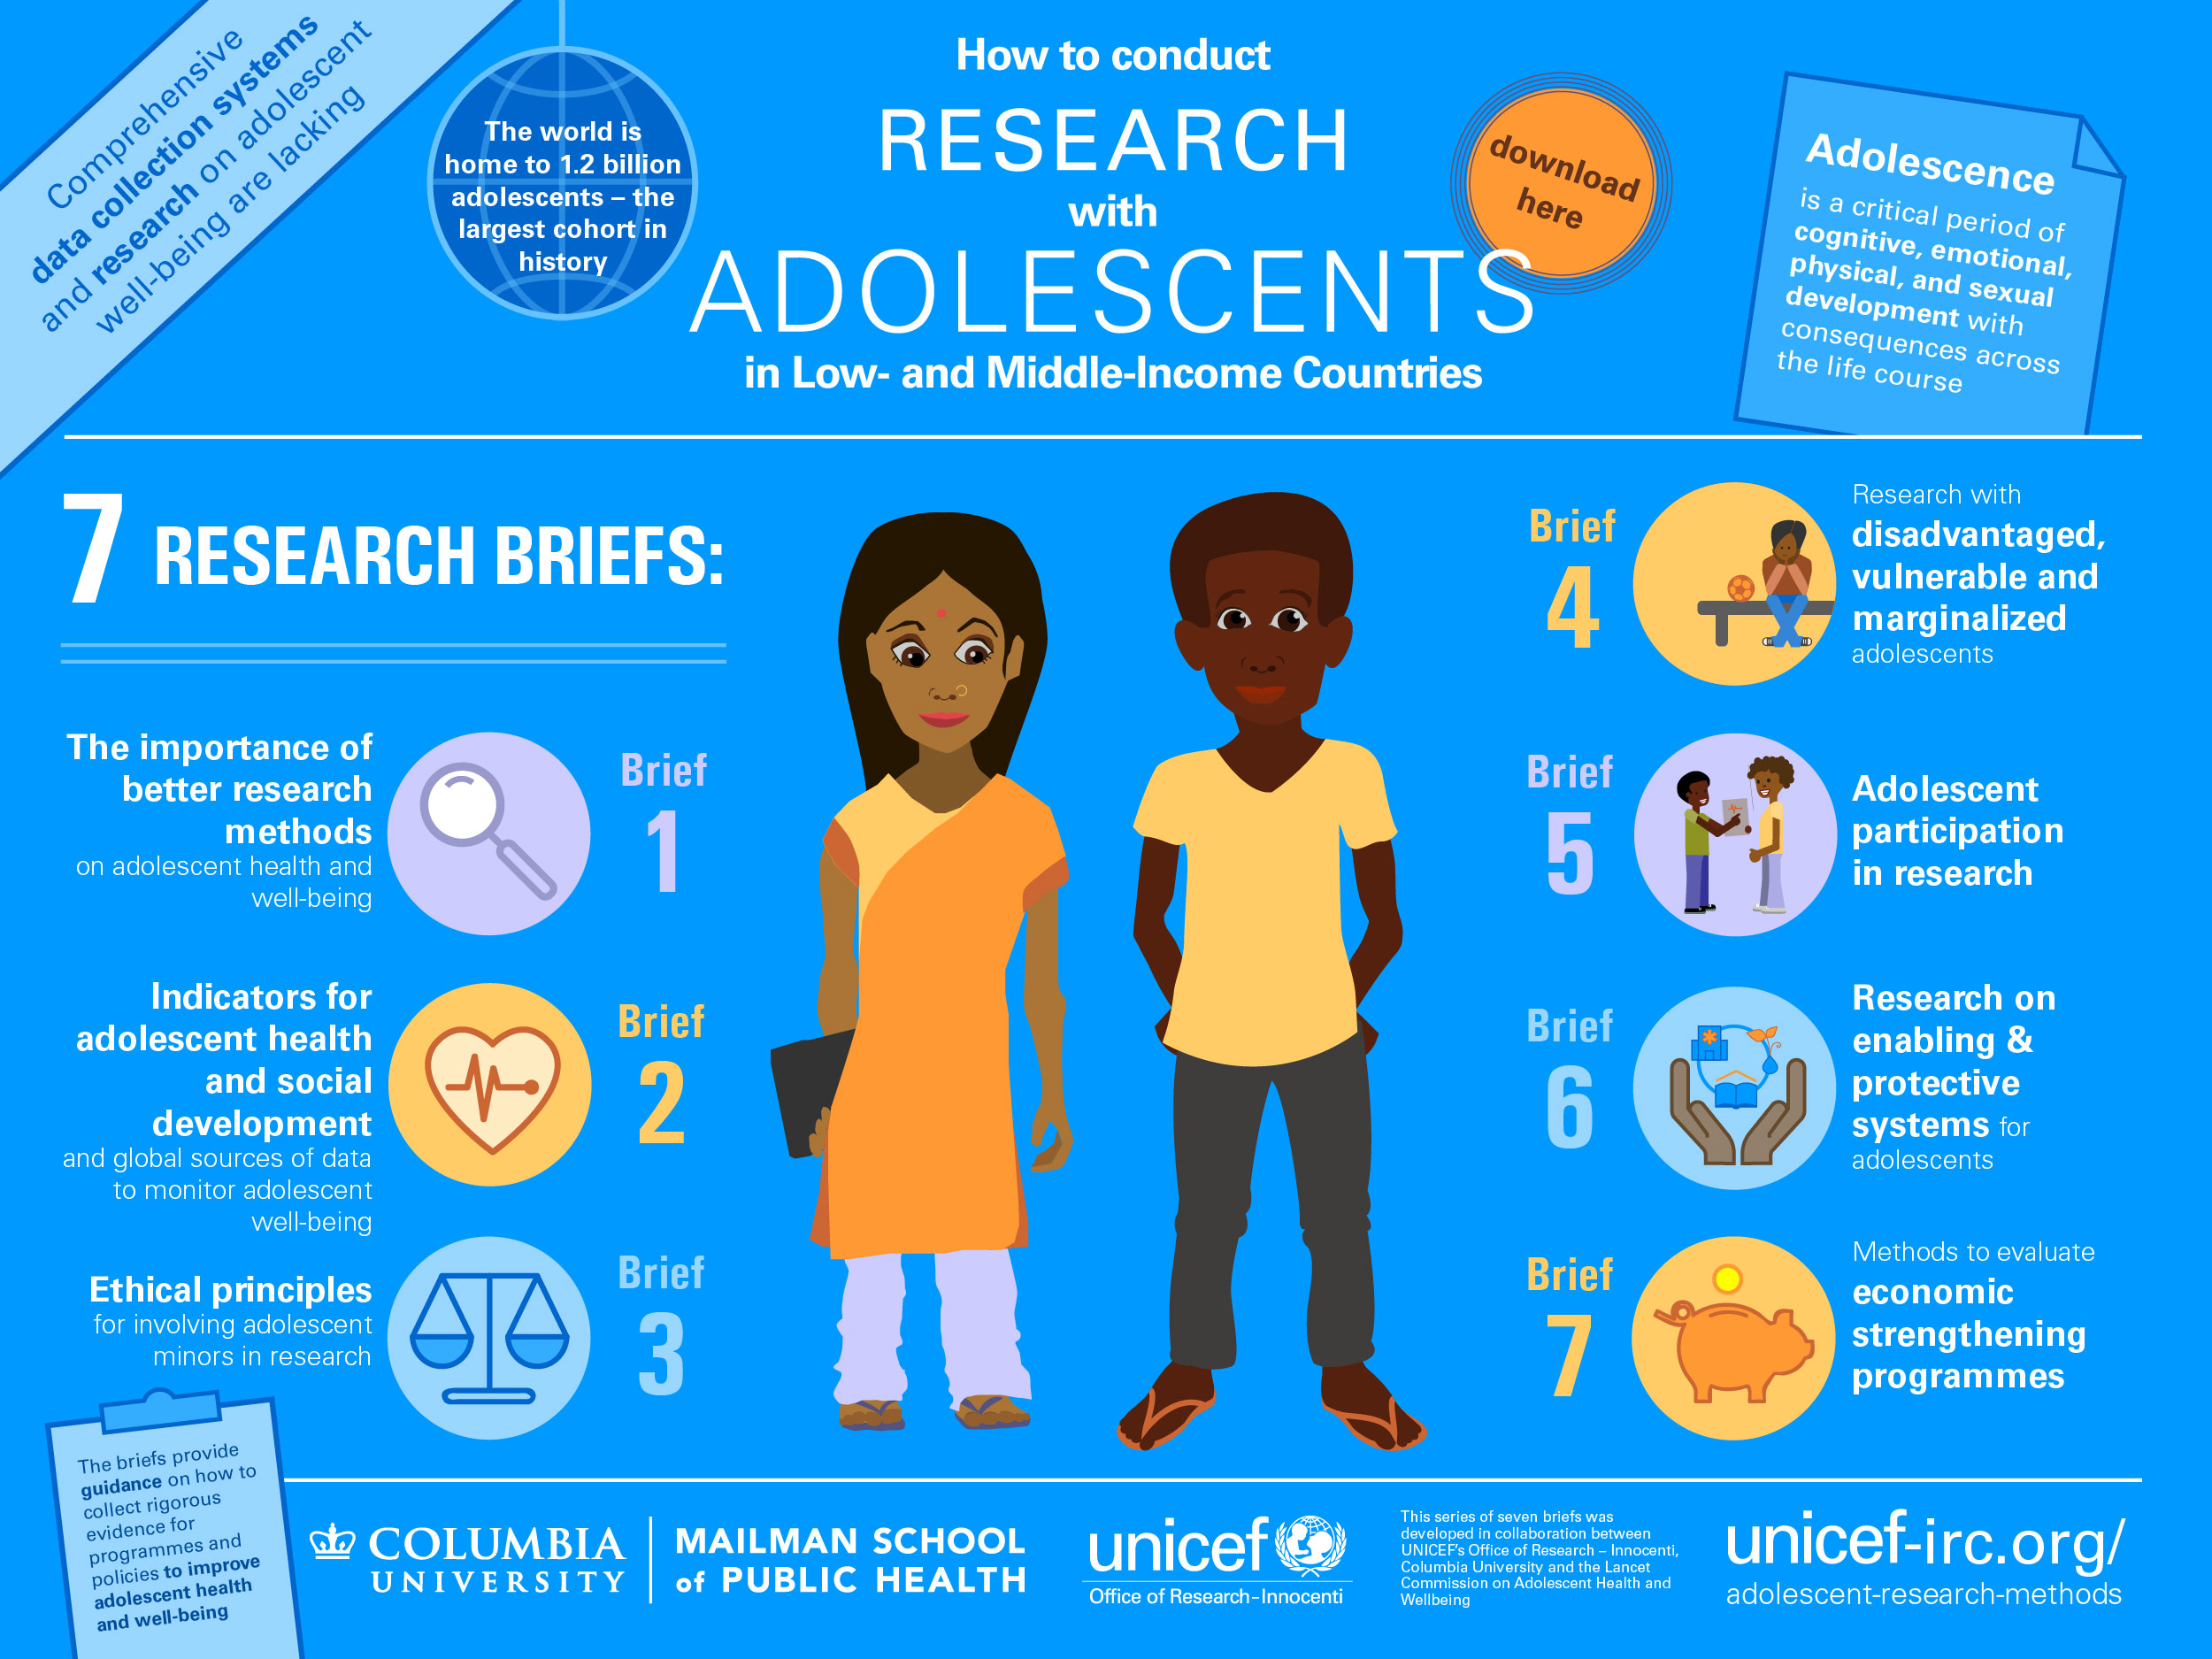
El objetivo: mejorar los esfuerzos para recopilar evidencias rigurosas para programas y políticas sobre salud y bienestar de los adolescentes.

Estos son los siete documentos de investigación que ha generado:

1.Mejora de la calidad metodológica de la investigación sobre el bienestar de los adolescentes

2. Datos e indicadores para medir la salud de los adolescentes, el desarrollo social y el bienestar

3.Inclusión y protección: obtener el consentimiento informado al realizar investigaciones con adolescentes

4.Investigación con adolescentes desfavorecidos, vulnerables y / o marginados

5. Participación de los adolescentes en la investigación: innovación, justificación y próximos pasos

6. Cómo medir los sistemas habilitadores y de apoyo para la salud de los adolescentes

7. Metodologías para capturar los efectos multidimensionales de las intervenciones de fortalecimiento económico

Written by cplysy · Categorized: TripleAD

May 26 2020

Common Issues When Entering Survey Data (and How to Solve Them)


This article is part of a series: How To Enter Survey Data

Part 1: Three Steps for Painless Survey Data Entry
Part 2: Preventing Mistakes in Survey Data Entry
Part 3: Common Issues with Survey Data Entry (and How to Solve Them)

In a previous article, Three Steps for Painless Survey Data Entry, I shared my system for entering data from paper surveys into a spreadsheet like Microsoft Excel. Here, I share solutions to two challenges you are likely to come across while entering survey data: 1) coding complex question types and 2) dealing with unclear responses. Addressing these challenges will require some advanced coding that I did not cover in my first article.


Entering data from complex survey questions

I recommend setting up the survey codebook in a systematic way because it increases data entry accuracy and speed. As a reminder, your codebook should look something like this:

Example survey codebook

Example survey codebook

Moving top to bottom and left to right, simply number the responses sequentially starting at 1. This works when you expect exactly one response to the question (e.g., Yes OR No). However, your survey won’t always be this simple. Below are some examples of how to set up a codebook for more complex questions:


Issue #1: Responses are already numbered

The question options may already be numbered on the survey, and respondents circle the number that applies (like in the image below). In this case, I would recommend following whatever numbering scheme is on the survey for data entry rather than re-numbering the responses. If someone circles 5, enter 5. Simple.

Example survey question: “To what extent do you agree or disagree with the following statements about the program? This program was easy to access.” Responses: Strongly agree (5), Agree (4), Neutral (3), Disagree (2), Strongly disagree (1).

Example survey question: “To what extent do you agree or disagree with the following statements about the program? This program was easy to access.” Responses: Strongly agree (5), Agree (4), Neutral (3), Disagree (2), Strongly disagree (1).

Issue #2: Table or matrix of questions

When you have multi-part questions (like the question matrix below), label each part of the question with lowercase letters starting at “a.” You’ll notice that in this example, there are checkboxes instead of numbers, so I added numbers in red to the codebook from left to right, starting at 1.

Question 1: To what extent do you agree or disagree with the following statements about the program? This program was easy to access. This program helped improve my life. I would recommend this program to a friend. Responses: Strongly agree (1), Agree (2), Neutral (3), Disagree (4), Strongly disagree (5).

Question 1: To what extent do you agree or disagree with the following statements about the program? This program was easy to access. This program helped improve my life. I would recommend this program to a friend. Responses: Strongly agree (1), Agree (2), Neutral (3), Disagree (4), Strongly disagree (5).

For this question, your data entry spreadsheet would be set up like this:

Example data entry spreadsheet

Example data entry spreadsheet


Issue #3: Select all that apply

A common question type is “select all that apply,” for example:

Question: How did you hear about our program? (Check all that apply). Responses: Friends or family, TV, Facebook, Twitter, Newspaper, I don’t remember.

Question: How did you hear about our program? (Check all that apply). Responses: Friends or family, TV, Facebook, Twitter, Newspaper, I don’t remember.

People can check as many options as they like, so the usual system of numbering sequentially will not work. Instead, we treat this question like a question matrix, where each response item is its own “question,” with possible responses being “checked” and “not checked.” The codebook would look like this:

Codebook for question: How did you hear about our program? (Check all that apply). Responses: Friends or family, TV, Facebook, Twitter, Newspaper, I don’t remember.

Codebook for question: How did you hear about our program? (Check all that apply). Responses: Friends or family, TV, Facebook, Twitter, Newspaper, I don’t remember.

This will make more sense with an example. If our survey comes back like this:

Example of answer to question: How did you hear about our program? (Check all that apply). Responses: Friends or family, TV, Facebook, Twitter, Newspaper, I don’t remember.

Example of answer to question: How did you hear about our program? (Check all that apply). Responses: Friends or family, TV, Facebook, Twitter, Newspaper, I don’t remember.

Reading through the responses in order (from top to bottom, left to right), we get:

  • Friends or family = not checked

  • TV = checked

  • Facebook = not checked

  • Twitter = checked

  • Newspaper = checked

  • I don’t remember = not checked


Using the codebook, these responses translate to:

  • Q1a = 0

  • Q1b = 1

  • Q1c = 0

  • Q1d = 1

  • Q1e = 1

  • Q1f = 0


So the data would be entered like this:

Example codebook

Example codebook


Dealing with unclear responses

If you’ve ever conducted a survey before, you’ve certainly seen some wonky responses. People will circle more than one option when you want them to select only one, they’ll skip questions or even entire pages, they’ll write comments beside their answers, they’ll create new answers and circle those instead… So we need a way to deal with these unclear answers that don’t fit into our nice neat data entry sheet. The key to dealing with wonky responses is to decide on a rule, document it, and apply it consistently.


Issue #4: Circled too many answers

When a respondent selects more than one answer (like checking “Very good” and “Good”), you have a few options:

  1. Code as “unclear” by entering 98. The advantage of doing this is that you do not make any guesses about what the respondent meant. Instead, you mark it as “unclear” and it is excluded from analysis; or

  2. Randomly pick one of the selected answers. You can do this by using a random number generator, or just type “flip a coin” into Google. The advantage of doing this is that you do not exclude as many responses (which may be important if you have a small sample size).


Issue #5: Made up their own answer

Sometimes people will write in their own answer (even when there is not an open-ended question). For example, you might see something like this:

Example of question where the respondent added a new option between “5” and “4” called “4.5” and circled that instead of one of the given responses.

Example of question where the respondent added a new option between “5” and “4” called “4.5” and circled that instead of one of the given responses.

The respondent created their own option (“4.5”) between Strongly agree and Agree (you’d be surprised how common this is). You can’t simply enter 4.5 into the data entry, because that is not one of the allowable responses in the codebook. Instead, you can treat this as if they circled “5” and “4,” and then carry on with the same procedure as when a respondent circles more than one answer. Your options are:

  1. Code as “unclear” by entering 98; or

  2. Randomly pick one of the selected answers (e.g., flip a coin to decide whether to enter “5” or “4”). 

Another example of a respondent creating their own answer is:

Example of a question where the respondent added a new response after “5” called “6” and wrote “Very!” beside it.

Example of a question where the respondent added a new response after “5” called “6” and wrote “Very!” beside it.

Here, the respondent made an option even higher than “Strongly agree”, which they wrote in as “6” and labeled with “Very!” Your options for data entry are:

  1. Code as “unclear” by entering 98; or

  2. Assume the respondent would “strongly agree” with the statement and enter “5” since it is the next closest response to their answer.


There are a few considerations when choosing an option for this scenario. On the one hand, we want to be careful to maintain the integrity of the original data – “6” is not the same thing as “Strongly agree,” so you may not want to assume that’s what the respondent meant. On the other hand, we might be fairly sure the respondent meant to indicate their agreement – should we try to capture the spirit of their response in the way we code the data? Either way of treating the data could be justified, so it’s important to decide what makes sense for your survey, document the rule, and follow it consistently.


I’ve covered some strategies you can use to overcome common challenges in entering survey data. If you conduct paper surveys, you’re likely to come across complex question types and unclear responses, but with some forethought and planning, you can make sure you’re prepared to deal with these challenges in a consistent way that makes sense for your data. However you choose to deal with complex questions or unclear responses on your survey, the key is to decide on a rule, document your decision (so it can be discussed later in the methods section), and follow it consistently.


Sign up for our newsletter

We’ll let you know about our new content, and curate the best new evaluation resources from around the web!


We respect your privacy.

Thank you!


Written by cplysy · Categorized: evalacademy

May 26 2020

Preventing Mistakes in Survey Data Entry


This article is part of a series: How To Enter Survey Data

Part 1: Three Steps for Painless Survey Data Entry
Part 2: Preventing Mistakes in Survey Data Entry
Part 3: Common Issues with Survey Data Entry (and How to Solve Them)

When entering survey data, it is important that it is accurate, easy to analyze, and fast. The best way to meet these goals is to set yourself (or your data entry people) up for success from the beginning.

The old cliché “garbage in, garbage out” certainly applies to survey data entry. Our analysis can only be as good as our data, so it’s critical that the survey data is accurately translated from paper to spreadsheet. But being extra careful while entering data can only go so far – we get tired, we forget, and we make mistakes. Here are three tools you can use to prevent errors in survey data entry by making your spreadsheet foolproof: 1) data validation, 2) colour-coding columns, and 3) a “count” formula.

If you haven’t already set up your survey codebook and data entry spreadsheet, check out the previous article in this series for instructions on how to do so.


1. Data validation

Data validation is your first defence against data entry errors, and it is very simple to implement. Data validation just means defining which values are allowed in which cells. After you have made the survey codebook and data entry spreadsheet, you can set the validation on a question-by-question basis. I will use this survey question as an example:

Question: To what extent do you agree or disagree with the following statements about the program?  Statement: This program was easy to access.  Responses: Strongly agree (5), Agree (4), Neutral (3), Disagree (2), Strongly disagree (1)

Question: To what extent do you agree or disagree with the following statements about the program?

Statement: This program was easy to access.

Responses: Strongly agree (5), Agree (4), Neutral (3), Disagree (2), Strongly disagree (1)

In the spreadsheet for Q1, we want to allow only seven different values to be entered (the five responses 1-5, plus 98 and 99 for “unclear” and “missing/ skipped”). To set up Data Validation in Microsoft Excel, the steps are:

  1. Highlight the Q1 column in your data entry spreadsheet

  2. Click the “Data” tab in the Microsoft Excel Ribbon

  3. Click “Data Validation”

  4. Set Allow to “List”

  5. Set Source to a list of the allowed values separated by commas (see image below)

  6. I choose not to use the “in-cell dropdown” feature because I find it slows down my data entry, but this is up to you.

  7. Click “Ok”

How to set up Microsoft Excel Data Validation to accept a list of allowable responses.

How to set up Microsoft Excel Data Validation to accept a list of allowable responses.

Now that data validation is set up, you will receive a pop-up message warning you if you enter a value that isn’t allowed for that question, which will guard against mis-typed data.


2. Colour-code columns

Colour-coding columns is especially helpful for long surveys. I highlight groups of questions in the same colour (e.g., a matrix containing six questions), which gives your eye a visual cue to make sure you’re still entering data in the correct cells of the spreadsheet. In addition to colours, you can also add borders between sections on the survey. For example:

Excel spreadsheet using colours and borders to differentiate survey sections.

Excel spreadsheet using colours and borders to differentiate survey sections.

By grouping questions together using colour and lines, you provide a visual anchor that helps you keep track of where you are in the data entry spreadsheet.


3. Count cells to make sure you didn’t miss any questions

It’s easy to accidentally skip a question, especially when it is at the end of the page (or maybe the respondent skipped it and you left it blank instead of entering 99). By adding a “count” column at the end of your data entry sheet, you can prevent this mistake. Simply add a column with the Excel formula =COUNTA(*specify the entire row*), then fill this formula down the entire column. This formula will count the number of cells in the row that aren’t blank:

Excel spreadsheet using =COUNTA to ensure all questions have been filled with data.

Excel spreadsheet using =COUNTA to ensure all questions have been filled with data.

In the example, the formula for the first row is =COUNTA(A2:P2). As you can see, if every cell is filled in properly (including the ID column), COUNTA will return the value 16 (because there are 16 non-blank cells). I name the count column “Count (16)” so I don’t forget it is supposed to add up to 16. If you accidentally skip a question, like I did on respondent ID#3 Q1b, the COUNTA value will be less than 16. This is a quick way to check when you reach the end of a survey that you didn’t miss any questions.

If your surveys don’t have ID numbers written on them, it can be very difficult or even impossible to go back and find a survey you made a mistake on. For this reason, I recommend checking the Count column at the end of every survey, or at least every few surveys, so it’s easy to flip back in your stack of surveys and find the culprit. Another option is to write the appropriate ID number on the surveys as you go, which gives you the ability to do quality control more easily.


Bonus Tip: Remember to save!

We all know the gut-wrenching feeling of a program crashing and you can’t remember the last time you saved. To avoid this heartbreak, I do a quick CTRL+S or CMD+S (save shortcut) at the end of every page of a survey – if you’re turning the page, save!


Sign up for our newsletter

We’ll let you know about our new content, and curate the best new evaluation resources from around the web!


We respect your privacy.

Thank you!


Written by cplysy · Categorized: evalacademy

May 26 2020

Three Steps for Painless Survey Data Entry


This article is part of a series: How To Enter Survey Data

Part 1: Three Steps for Painless Survey Data Entry
Part 2: Preventing Mistakes in Survey Data Entry
Part 3: Common Issues with Survey Data Entry (and How to Solve Them)

Arguably the most exciting part about conducting a survey is seeing the results – finally your hard work has come to fruition, and you get to hear what everybody had to say about your program or organization! But before you can get to that step, you need to transform the stack of paper surveys on your desk into useable data.

For some, the thought of survey data entry is a mind-numbing task, but I kind of love it… You get to switch the critical thinking part of your brain off and just focus on one simple task, which isn’t an opportunity we often get in this fast-paced world.

I’m going to share my three-step system for making survey data entry as easy and painless as possible, which comes from my experience designing, entering, and analyzing survey data.

Before you get started entering survey data, you should think about your goals. My priorities for survey data entry are that it is:

  • Accurate,

  • Easy to analyze, and

  • Fast.

The most important job of data entry is that it is accurate. If it isn’t accurate, then forget analysis and speed. Accurate data entry means what ends up in the spreadsheet reflects exactly what was on the survey, every single time.

The next priority is that the survey data is easy to analyze. With some forethought, you can save your data analyst (which might also be you!) a lot of time and headache down the road.

Finally, data entry should be as fast as possible – time is money, after all! But never, ever sacrifice accuracy for speed.

Here are the three steps you can follow to set yourself up for painless survey data entry:

1. Review the survey carefully

Familiarize yourself with the questions on the survey, and the available options. Are there fill in the blanks? Multiple choice? Select all that apply? Most likely there are many question types, and understanding all the different questions is critical to steps 2 and 3. If it’s your first time seeing the particular survey, you might want to sit down and fill out a blank copy as if you were a respondent to get a really good feel for the questions.

2. Create the codebook

You should never be typing out the verbatim responses to each question while entering survey data (e.g., “yes” “yes” “no” “yes”). Instead, assign each response a number (e.g., yes = 1, no = 2) and enter those numbers instead of words. This fulfills all of our data entry priorities: it is more accurate, easier to analyze, and faster.

The codebook is your translator between the survey and the data. It tells you (and the analyst) how to turn survey responses into numbers, and back again. A copy of this codebook should live in the same folder as the data entry sheet and be clearly named. For added convenience, I paste a copy of the codebook into the data entry spreadsheet (Step 3) in a tab called Codebook. Here is what a simple codebook looks like:

Example survey codebook

Example survey codebook

The codebook outlines which number should be entered for each response. In this example, if someone answered Yes to Q1, you would enter “1.” If they answered No, enter “2.” You’ll notice I added the question numbers beside the questions – sometimes the paper surveys you receive won’t have the questions numbered, so you should write them into the codebook.

How you assign the response codes is up to you, but I strongly recommend following this system: from left-to-right and top-to-bottom, number the responses sequentially starting from 1. This way, the codes are the same no matter what the question is, which helps you ensure accuracy and speed. By following the same coding system for every question, the data entry person knows that the first response is always “1,” the second is always “2,” and so on. Numbers are faster and more accurate to type than letters because they are all close together on your keyboard’s number pad. Note: there are some exceptions to this rule when it comes to more complex question types, which I will cover in a follow-up article.

When it comes time to analyze the data, you might need to recode the data depending on how it will be analyzed (for example, maybe you want to change all the 1’s back to Yes’s, or change all the 2’s to 0’s). This is quick and easy to do at the analysis stage, and is not very prone to errors as long as you document any changes you make. Trust me, it’s way easier to change all the 1’s to Yes’s at the end than it is to type out “y-e-s” (or even just “y”) during data entry.

You’ll notice that I added “blank = 99 and unclear response = 98.” These are codes you will use when someone skips a question (99) or if they check more boxes than they are supposed to (98). How you deal with missing or unclear responses is up to you – just decide on a rule, document it, and apply it consistently. Entering 99 instead of leaving a blank cell is good practice because then you know for sure that question was skipped by the respondent, and not accidentally missed during data entry. However, do not use 98 and 99 if you are recording a numeric variable like age, because you won’t know if it is supposed to be “99 years old” or “missing data.” In this case, you may want to use 999 for missing data instead. Read more about blanks in data entry in our article “Four Common Data Entry Mistakes (and How to Fix Them)”.

3. Create the data entry spreadsheet

Now that you have the codebook, the data entry spreadsheet is easy to create. Using Microsoft Excel or Google Sheets (or other spreadsheet software) create a new file with one column for each question, plus a column for an identification number (ID#). Each cell will contain one number corresponding to the response to that question. For the above example, the spreadsheet (with some sample data) would look like this:

Example survey data entry spreadsheet

Example survey data entry spreadsheet

In a data entry spreadsheet, each row should always contain all the data for one unique individual. I like to add an ID column and fill the ID numbers all the way down the column before starting data entry. Even if there is no ID number on the survey to begin with, it is a good idea to add it to the spreadsheet because some statistical programs require a unique ID for each respondent. You may also want to manually write the ID numbers on the surveys as you enter them — if you don’t put ID numbers on the surveys, it is very difficult to go back and fix mistakes or do quality control.

When entering data, I keep my right hand on the keyboard’s number pad, and my left hand on the Tab key. Hitting Tab moves you to the right in the spreadsheet (to the next question), and when you get to the end of each survey you hit Enter to move down to the start of the next row. Remember to keep an eye on the screen to make sure you are still entering data in the correct cells.


Now that you’ve familiarized yourself with the survey and set up your codebook and data entry spreadsheet, it’s time to start entering data! This is the part where I turn on a podcast or some music, and let my mind focus solely on the task of data entry. If you follow these steps, you might be surprised at how painless (and even relaxing) data entry can be.

In the next article, I will cover some more advanced survey data entry topics, such as entering complex question types and dealing with unclear responses.


Sign up for our newsletter

We’ll let you know about our new content, and curate the best new evaluation resources from around the web!


We respect your privacy.

Thank you!


Written by cplysy · Categorized: evalacademy

May 26 2020

Adventures in Teaching: Lessons Learned from Covid-19 Remote Teaching

Packing up the spring 2020 semester and transitioning to
remote teaching was difficult, not just for me but also for my students. As I
told them, “None of us signed up for online teaching. But we’ll make it through
this.” And we did! At least most of us did…

Part of the challenge was doing this in my first year at
UW-Stout. I was prepping two courses (undergraduate stats and graduate
evaluation), and practically prepping my two sections of intro psychology after
a major overhaul from the fall. I was trying to keep up my scholarship and
service commitments. I was already a little burned out from the semester and
had to skip my spring break to focus on transitioning to remote teaching. I was
trying to figure out how to work from home again after finally getting used to
working in my department every day.

On reflection, I think there were some things I did really
well with the transition that I want to keep in mind for future semesters.
There were also some things I struggled with and want to improve for next time.
Here are the five things I am taking away from my experiences with remote teaching
due to Covid-19:

1. 
Have more lenient late policies

I already had a fairly lenient late policy: the points
possible decrease every day an assignment is late, then it’s maximum 50% credit
but you can turn it in at any time during the semester.

After the transition, I made it even more lenient: turn in
anything for full credit by the last day of the semester. In other words, there
was no late policy. Deadlines were all suggestions.

Students were grateful for both structure of assignment
deadlines and for leniency when they couldn’t meet them. Some students needed
the regular deadlines, whereas others needed to focus on other courses before
they could think about mine. And you know what? It worked out just fine.

I was always a little worried about abuses to the policy. Would
students get the answers from another student to submit their homework? Would I
get a huge influx of grading right at the end of the semester? Neither seemed
to happen.

This policy doesn’t work for all situations, particularly
when a large project is broken up into multiple sub-projects. But I plan on
being much more lenient in the future.

Relatedly, I’m going to think more critically about
high-stakes assignments. All my classes went to low-stakes assignments
throughout the semester, and it was much more enjoyable for both students and
myself.

2. 
Incorporate more videos and flip the classroom

For my undergraduate stats class, I recorded all my attendance-optional
lectures and put them into our LMS. This didn’t require any additional effort
or time beyond adding the link to the LMS after the recording was done.

Yet it saved me so much time answering student questions. Students
learned pretty quickly that most of their questions could be answered by
referring back to the lecture, so I wasn’t fielding as many repetitive
questions about the basics. Instead, I could focus on the more advanced
questions students were asking about the content we were learning. It was so
much more rewarding!

I will definitely be incorporating more videos into my
classes in upcoming semesters, regardless of whether we’re online or in person.
I want to design my courses to be disaster-ready: flipped so that much of the
learning is on their own and class time is spent applying the content. That
way, if something does happen, they’re already set to finish out the semester
the way they started the semester.

p.s. If you’re looking to improve your videos, I finished
reading Karen Costa’s “99
Tips for Creating Simple and Sustainable Education Videos
” and I highly
recommend it.

3. 
Build a better classroom community

I was particularly proud of the community that I build in my
intro psych classes using team-based learning. But Covid-19 hit just when teams
were starting to norm and perform. To accommodate students’, I went completely
asynchronous and made the class as easy as possible for them to complete (and
still I had a number who sadly were not able to complete).

But the one thing I struggled with was keeping up the
classroom community we built when we were in-person. This was a struggle for
all my classes, even my graduate class that kept up synchronous meetings. I
just felt like I wasn’t connecting with a lot of my students anymore. I couldn’t
check in with them before, during, or after class like I was doing prior. And
email check-ins just weren’t the same…

I’m still not entirely sure how to go about this. I have
some ideas though: more videos to humanize myself and connect with students,
especially if we’re online; having an assignment for points that has students
come visit me during student hours, whether that be in my office or online;
continue to use MS Teams for each of my classes and grading on participation; and
continue to hold online student hours, even if I have in-person student hours. I’d
love other suggestions you have for building a community in an online
environment.

4. 
Embrace universal design for learning

The transition to remote teaching made me better embrace UDL in my classes: providing multiple
means of engagement, representation, and action and expression. I was already
doing it a little bit, but I realized how important it was for my students that
they have alternative ways to access and participate in the learning opportunities.
  

For example, I had two small papers in my intro psych class.
At the beginning of the semester, I decided to open it up so that students
could either write an essay or they could record a video. After the transition,
I had a student ask to just call me and describe what they did, which of course
I allowed.

I still have a lot to learn about UDL—and the CAST website provides a ton of great guidelines and resources—but one of my core principles in teaching is that my teaching is accessible for all students.


What about you? What lessons are you taking away from the transition to remote teaching due to Covid-19? What changes will you make to your land-based teaching moving forward? Add your comments below!

Written by Dana Wanzer · Categorized: danawanzer

  • « Go to Previous Page
  • Go to page 1
  • Interim pages omitted …
  • Go to page 262
  • Go to page 263
  • Go to page 264
  • Go to page 265
  • Go to page 266
  • Interim pages omitted …
  • Go to page 310
  • Go to Next Page »

Footer

Follow our Work

The easiest way to stay connected to our work is to join our newsletter. You’ll get updates on projects, learn about new events, and hear stories from those evaluators whom the field continues to actively exclude and erase.

Get Updates

Want to take further action or join a pod? Click here to learn more.

Copyright © 2026 · The May 13 Group · Log in

en English
af Afrikaanssq Shqipam አማርኛar العربيةhy Հայերենaz Azərbaycan dilieu Euskarabe Беларуская моваbn বাংলাbs Bosanskibg Българскиca Catalàceb Cebuanony Chichewazh-CN 简体中文zh-TW 繁體中文co Corsuhr Hrvatskics Čeština‎da Dansknl Nederlandsen Englisheo Esperantoet Eestitl Filipinofi Suomifr Françaisfy Fryskgl Galegoka ქართულიde Deutschel Ελληνικάgu ગુજરાતીht Kreyol ayisyenha Harshen Hausahaw Ōlelo Hawaiʻiiw עִבְרִיתhi हिन्दीhmn Hmonghu Magyaris Íslenskaig Igboid Bahasa Indonesiaga Gaeilgeit Italianoja 日本語jw Basa Jawakn ಕನ್ನಡkk Қазақ тіліkm ភាសាខ្មែរko 한국어ku كوردی‎ky Кыргызчаlo ພາສາລາວla Latinlv Latviešu valodalt Lietuvių kalbalb Lëtzebuergeschmk Македонски јазикmg Malagasyms Bahasa Melayuml മലയാളംmt Maltesemi Te Reo Māorimr मराठीmn Монголmy ဗမာစာne नेपालीno Norsk bokmålps پښتوfa فارسیpl Polskipt Portuguêspa ਪੰਜਾਬੀro Românăru Русскийsm Samoangd Gàidhligsr Српски језикst Sesothosn Shonasd سنڌيsi සිංහලsk Slovenčinasl Slovenščinaso Afsoomaalies Españolsu Basa Sundasw Kiswahilisv Svenskatg Тоҷикӣta தமிழ்te తెలుగుth ไทยtr Türkçeuk Українськаur اردوuz O‘zbekchavi Tiếng Việtcy Cymraegxh isiXhosayi יידישyo Yorùbázu Zulu